LOW - Bear slide continues=======
Volume
=======
- Slight decrease
==========
Price Action
==========
- Double Top
- Resisting at downtrend line
=================
Technical Indicators
=================
- Ichimoku
>>> price within cloud
>>> Red kumo expanding slightly
>>> Tenken - Below clouds & chiku
>>> Chiku - within
Next report date
—
Report period
—
EPS estimate
—
Revenue estimate
—
10.70 EUR
6.70 B EUR
80.78 B EUR
560.13 M
About Lowe's Companies, Inc.
Sector
Industry
CEO
Marvin R. Ellison
Website
Headquarters
Mooresville
Founded
1946
ISIN
US5486611073
FIGI
BBG01K3Y4154
Lowe's Companies, Inc. engages in the retail sale of home improvement products. The firm offers products for maintenance, repair, remodeling, home decorating, and property maintenance. It also provides home improvement products in the following categories: appliances, seasonal & outdoor living, lumber, lawn & garden, kitchens & bath, hardware, building materials, millwork, paint, rough plumbing, tools, electrical, flooring, and décor. The company was founded in 1946 and is headquartered in Mooresville, NC.
Related stocks

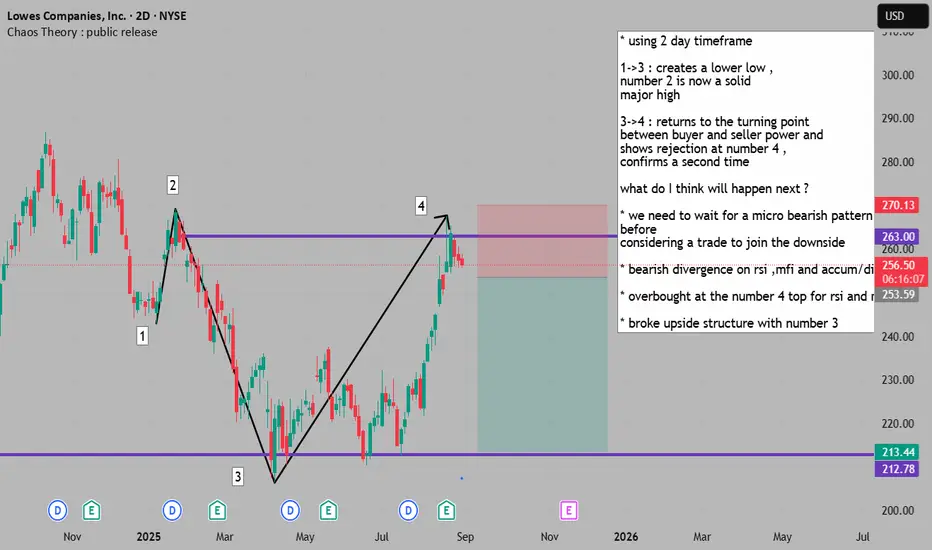
sideways market with recent bearish break = SELL * using 2 day timeframe
1->3 : creates a lower low ,
number 2 is now a solid
major high
3->4 : returns to the turning point
between buyer and seller power and
shows rejection at number 4 ,
confirms a second time
what do I think will happen next ?
* we need to wait for a micro bearish patte
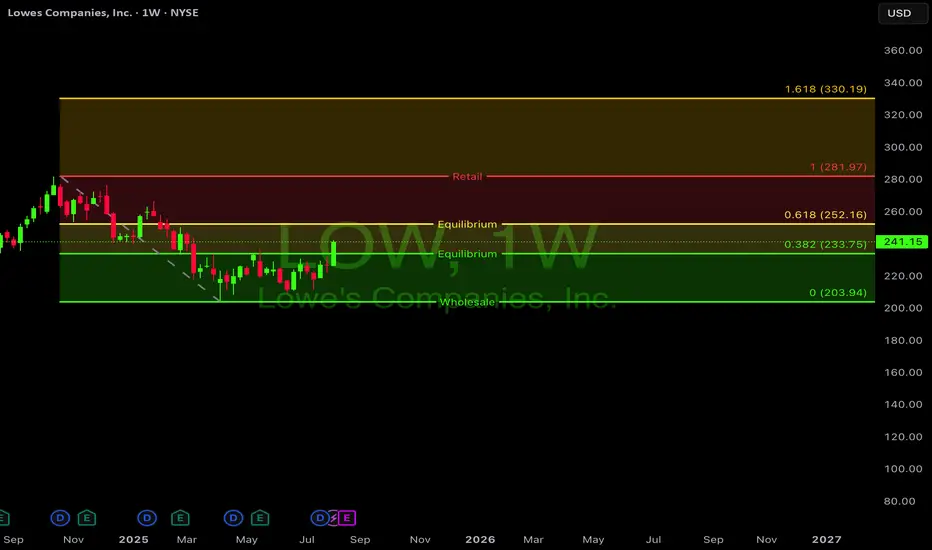
Bullish Analysis for Lowe's (LOW)Technical Analysis
Weekly Timeframe - Key Bullish Indicators
LOW has formed a strong base around the $206-$225 range and appears to be in an early stage of an uptrend
Recent weekly candle shows a decisive bullish move, closing at $241.15 which is the highest weekly close since March 2025
The stock

Can we hold?!Lowe's is currently sitting at a great support area, 200MA on the weekly chart. As noted on the chart, until the price breaks through that resistance, we continue to consolidate. I'd be surprised if price falls further, but anything is possible. The RSI on the weekly and Monthly are getting into

trade LOW earnings report with 250c exp 03.21Lowe's has taken several steps to mitigate the impact of tariffs on its business. Here are some key strategies they've employed:
Diversifying Supply Chain: Lowe's has worked to diversify its supply chain by sourcing products from different countries, reducing reliance on any single country.
Workin

Lowe’s Makes a Lower HighLowe’s has been falling since mid-October, and some traders may see further downside risk.
The first pattern on today’s chart is the series of lower highs and lower lows over the last three months. If the resulting descending channel remains in effect, it could point to potential move below the Jan

LOW Monthly broke out of prior ATH levelLOW has broken the prior All time high level (made in Dec 2021). As long as 260 holds, expecting to see 280 to 300 levels in coming days
Stop loss - loss of 260 on daily closing basis
T1 - 280
T2 - 300
If no current position then either wait for 270 break or wait for a retest of 264 level to see

Lowes Companies(Extended Hours) | Chart & Forecast SummaryKey Indicators On Trade Set Up In General
1. Push Set Up
2. Range Set up
3. Break & Retest Set Up
Notes On Session
# Lowes Companies(Extended Hours)
- Double Formation
* 265.00 USD | Swing High | Subdivision 1
* 197.00 USD | Support Area
- Triple Formation
* 012345 | 1&2 | Uptrend Bias | Subdivisi

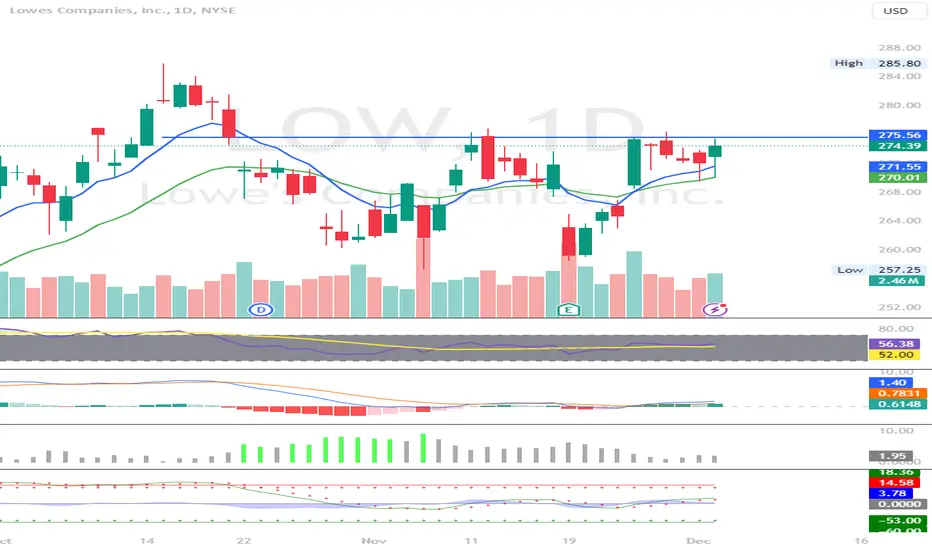
LOW- $275.50 level for breakoutLOW- stock on the way to make 3rd attempt to break $275.50 level. Looking for long calls above that level for a move towards $285 and $300. Stock has support at $270 and is strong on indicators.
See all ideas
Summarizing what the indicators are suggesting.
Neutral
SellBuy
Strong sellStrong buy
Strong sellSellNeutralBuyStrong buy
Neutral
SellBuy
Strong sellStrong buy
Strong sellSellNeutralBuyStrong buy
Neutral
SellBuy
Strong sellStrong buy
Strong sellSellNeutralBuyStrong buy
An aggregate view of professional's ratings.
Neutral
SellBuy
Strong sellStrong buy
Strong sellSellNeutralBuyStrong buy
Neutral
SellBuy
Strong sellStrong buy
Strong sellSellNeutralBuyStrong buy
Neutral
SellBuy
Strong sellStrong buy
Strong sellSellNeutralBuyStrong buy
Displays a symbol's price movements over previous years to identify recurring trends.
LOW.GT
Lowe's Companies, Inc. 7.11% 15-MAY-2037Yield to maturity
6.38%
Maturity date
May 15, 2037
LOW4161057
Lowe's Companies, Inc. 4.25% 15-SEP-2044Yield to maturity
5.90%
Maturity date
Sep 15, 2044
LOW5472121
Lowe's Companies, Inc. 5.8% 15-SEP-2062Yield to maturity
5.89%
Maturity date
Sep 15, 2062
LOW5563998
Lowe's Companies, Inc. 5.85% 01-APR-2063Yield to maturity
5.88%
Maturity date
Apr 1, 2063
LOW5384543
Lowe's Companies, Inc. 4.45% 01-APR-2062Yield to maturity
5.85%
Maturity date
Apr 1, 2062
LOW4970509
Lowe's Companies, Inc. 5.125% 15-APR-2050Yield to maturity
5.85%
Maturity date
Apr 15, 2050
LOW5472120
Lowe's Companies, Inc. 5.625% 15-APR-2053Yield to maturity
5.79%
Maturity date
Apr 15, 2053
LOW5563997
Lowe's Companies, Inc. 5.75% 01-JUL-2053Yield to maturity
5.78%
Maturity date
Jul 1, 2053
US548661EJ2
Lowe's Companies, Inc. 4.25% 01-APR-2052Yield to maturity
5.77%
Maturity date
Apr 1, 2052
LOW4817956
Lowe's Companies, Inc. 4.55% 05-APR-2049Yield to maturity
5.77%
Maturity date
Apr 5, 2049
US548661DZ7
Lowe's Companies, Inc. 3.0% 15-OCT-2050Yield to maturity
5.76%
Maturity date
Oct 15, 2050
See all 1LOW bonds
Curated watchlists where 1LOW is featured.


Frequently Asked Questions
The current price of 1LOW is 202.55 EUR — it has decreased by −1.67% in the past 24 hours. Watch Lowe's Companies, Inc. stock price performance more closely on the chart.
Depending on the exchange, the stock ticker may vary. For instance, on MIL exchange Lowe's Companies, Inc. stocks are traded under the ticker 1LOW.
1LOW stock has fallen by −2.62% compared to the previous week, the month change is a −1.96% fall, over the last year Lowe's Companies, Inc. has showed a −15.94% decrease.
We've gathered analysts' opinions on Lowe's Companies, Inc. future price: according to them, 1LOW price has a max estimate of 283.06 EUR and a min estimate of 192.48 EUR. Watch 1LOW chart and read a more detailed Lowe's Companies, Inc. stock forecast: see what analysts think of Lowe's Companies, Inc. and suggest that you do with its stocks.
1LOW reached its all-time high on Nov 27, 2024 with the price of 265.15 EUR, and its all-time low was 178.90 EUR and was reached on Nov 13, 2023. View more price dynamics on 1LOW chart.
See other stocks reaching their highest and lowest prices.
See other stocks reaching their highest and lowest prices.
1LOW stock is 1.70% volatile and has beta coefficient of 0.73. Track Lowe's Companies, Inc. stock price on the chart and check out the list of the most volatile stocks — is Lowe's Companies, Inc. there?
Today Lowe's Companies, Inc. has the market capitalization of 114.37 B, it has increased by 1.89% over the last week.
Yes, you can track Lowe's Companies, Inc. financials in yearly and quarterly reports right on TradingView.
Lowe's Companies, Inc. is going to release the next earnings report on Nov 19, 2025. Keep track of upcoming events with our Earnings Calendar.
1LOW earnings for the last quarter are 3.79 EUR per share, whereas the estimation was 3.72 EUR resulting in a 2.07% surprise. The estimated earnings for the next quarter are 2.60 EUR per share. See more details about Lowe's Companies, Inc. earnings.
Lowe's Companies, Inc. revenue for the last quarter amounts to 20.99 B EUR, despite the estimated figure of 20.98 B EUR. In the next quarter, revenue is expected to reach 18.09 B EUR.
1LOW net income for the last quarter is 2.09 B EUR, while the quarter before that showed 1.44 B EUR of net income which accounts for 44.98% change. Track more Lowe's Companies, Inc. financial stats to get the full picture.
Yes, 1LOW dividends are paid quarterly. The last dividend per share was 1.03 EUR. As of today, Dividend Yield (TTM)% is 2.01%. Tracking Lowe's Companies, Inc. dividends might help you take more informed decisions.
Lowe's Companies, Inc. dividend yield was 1.75% in 2024, and payout ratio reached 37.24%. The year before the numbers were 1.98% and 32.97% correspondingly. See high-dividend stocks and find more opportunities for your portfolio.
As of Nov 6, 2025, the company has 270 K employees. See our rating of the largest employees — is Lowe's Companies, Inc. on this list?
EBITDA measures a company's operating performance, its growth signifies an improvement in the efficiency of a company. Lowe's Companies, Inc. EBITDA is 10.71 B EUR, and current EBITDA margin is 14.44%. See more stats in Lowe's Companies, Inc. financial statements.
Like other stocks, 1LOW shares are traded on stock exchanges, e.g. Nasdaq, Nyse, Euronext, and the easiest way to buy them is through an online stock broker. To do this, you need to open an account and follow a broker's procedures, then start trading. You can trade Lowe's Companies, Inc. stock right from TradingView charts — choose your broker and connect to your account.
Investing in stocks requires a comprehensive research: you should carefully study all the available data, e.g. company's financials, related news, and its technical analysis. So Lowe's Companies, Inc. technincal analysis shows the strong sell today, and its 1 week rating is sell. Since market conditions are prone to changes, it's worth looking a bit further into the future — according to the 1 month rating Lowe's Companies, Inc. stock shows the strong sell signal. See more of Lowe's Companies, Inc. technicals for a more comprehensive analysis.
If you're still not sure, try looking for inspiration in our curated watchlists.
If you're still not sure, try looking for inspiration in our curated watchlists.