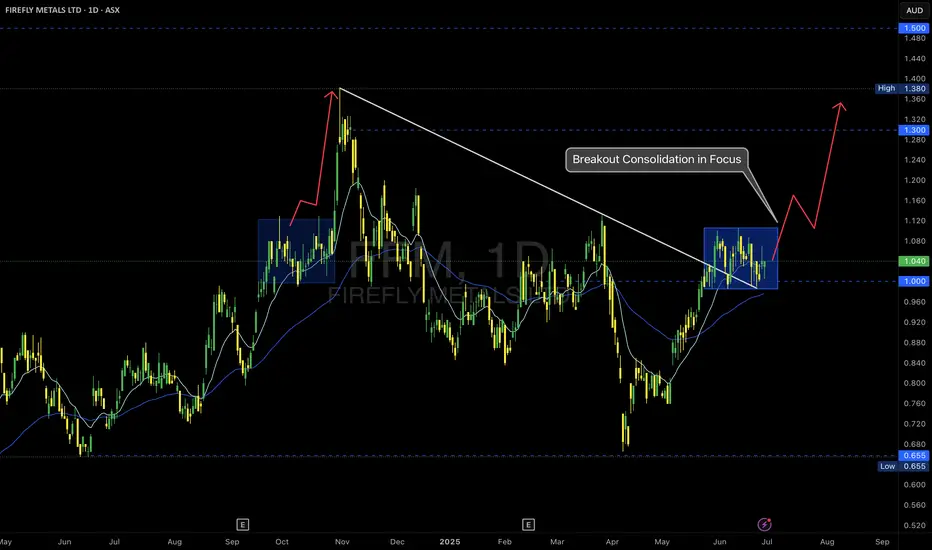
FFM -- ASX – Breakout Consolidation in Focus
📝 Description
Firefly Metals is setting up a classic breakout continuation scenario after reclaiming the $1.00 psychological level and breaking the long-term trendline resistance.
🔹 Key Observations:
• Trendline Break: The descending trendline from the prior high was decisively breached, signaling
FireFly Metals Ltd.
No trades
Next report date
—
Report period
—
EPS estimate
—
Revenue estimate
—
−0.01 USD
−7.47 M USD
0.00 USD
736.74 M
About FireFly Metals Ltd
Sector
Industry
CEO
Darren Cooke
Website
Headquarters
West Perth
Founded
2004
IPO date
Sep 21, 2005
Identifiers
2
ISIN AU0000313769
FireFly Metals Ltd. engages in the exploration of minerals. Its segments include Green Bay, Pickle Crow, and Limestone Well. The company was founded on August 3, 2004 and is headquartered in West Perth, Australia.
Related stocks
FFM Targeting 1.5??Hi dear trading lovers and FFM buyers...
PLEASE NOTE THAT THIS IS ONLY AN ANALYSIS AND COULD BE WRONG...
Chart and lines are explaining my idea...
SEEMS FFM is in a uptrend targeting 1.5 and finally 1.7...
Also note that:
"Macquarie has initiated coverage of FireFly Metals with an Outperform ra

See all ideas
Summarizing what the indicators are suggesting.
Neutral
SellBuy
Strong sellStrong buy
Strong sellSellNeutralBuyStrong buy
Neutral
SellBuy
Strong sellStrong buy
Strong sellSellNeutralBuyStrong buy
Neutral
SellBuy
Strong sellStrong buy
Strong sellSellNeutralBuyStrong buy
An aggregate view of professional's ratings.
Neutral
SellBuy
Strong sellStrong buy
Strong sellSellNeutralBuyStrong buy
Neutral
SellBuy
Strong sellStrong buy
Strong sellSellNeutralBuyStrong buy
Neutral
SellBuy
Strong sellStrong buy
Strong sellSellNeutralBuyStrong buy
Displays a symbol's price movements over previous years to identify recurring trends.
CPPR
HANetf ICAV - Sprott Pure Play Copper Miners UCITS ETF AccumUSDWeight
1.15%
Market value
1.49 M
USD
Explore more ETFs
Frequently Asked Questions
The current price of MNXMF is 1.62 USD — it has increased by 23.66% in the past 24 hours. Watch FireFly Metals Ltd. stock price performance more closely on the chart.
Depending on the exchange, the stock ticker may vary. For instance, on OTC exchange FireFly Metals Ltd. stocks are traded under the ticker MNXMF.
MNXMF stock has risen by 20.10% compared to the previous week, the month change is a 19.12% rise, over the last year FireFly Metals Ltd. has showed a 157.14% increase.
We've gathered analysts' opinions on FireFly Metals Ltd. future price: according to them, MNXMF price has a max estimate of 2.28 USD and a min estimate of 1.35 USD. Watch MNXMF chart and read a more detailed FireFly Metals Ltd. stock forecast: see what analysts think of FireFly Metals Ltd. and suggest that you do with its stocks.
MNXMF reached its all-time high on Dec 17, 2007 with the price of 20.84 USD, and its all-time low was 0.001499 USD and was reached on Aug 30, 2017. View more price dynamics on MNXMF chart.
See other stocks reaching their highest and lowest prices.
See other stocks reaching their highest and lowest prices.
MNXMF stock is 22.36% volatile and has beta coefficient of 2.03. Track FireFly Metals Ltd. stock price on the chart and check out the list of the most volatile stocks — is FireFly Metals Ltd. there?
Today FireFly Metals Ltd. has the market capitalization of 988.73 M, it has decreased by −0.79% over the last week.
Yes, you can track FireFly Metals Ltd. financials in yearly and quarterly reports right on TradingView.
FireFly Metals Ltd. is going to release the next earnings report on Sep 25, 2026. Keep track of upcoming events with our Earnings Calendar.
MNXMF earnings for the last half-year are 0.00 USD per share, whereas the estimation was −0.01 USD, resulting in a 89.00% surprise. The estimated earnings for the next half-year are 0.00 USD per share. See more details about FireFly Metals Ltd. earnings.
MNXMF net income for the last half-year is −485.09 K USD, while the previous report showed −3.70 M USD of net income which accounts for 86.90% change. Track more FireFly Metals Ltd. financial stats to get the full picture.
No, MNXMF doesn't pay any dividends to its shareholders. But don't worry, we've prepared a list of high-dividend stocks for you.
Like other stocks, MNXMF shares are traded on stock exchanges, e.g. Nasdaq, Nyse, Euronext, and the easiest way to buy them is through an online stock broker. To do this, you need to open an account and follow a broker's procedures, then start trading. You can trade FireFly Metals Ltd. stock right from TradingView charts — choose your broker and connect to your account.
Investing in stocks requires a comprehensive research: you should carefully study all the available data, e.g. company's financials, related news, and its technical analysis. So FireFly Metals Ltd. technincal analysis shows the strong buy rating today, and its 1 week rating is strong buy. Since market conditions are prone to changes, it's worth looking a bit further into the future — according to the 1 month rating FireFly Metals Ltd. stock shows the buy signal. See more of FireFly Metals Ltd. technicals for a more comprehensive analysis.
If you're still not sure, try looking for inspiration in our curated watchlists.
If you're still not sure, try looking for inspiration in our curated watchlists.