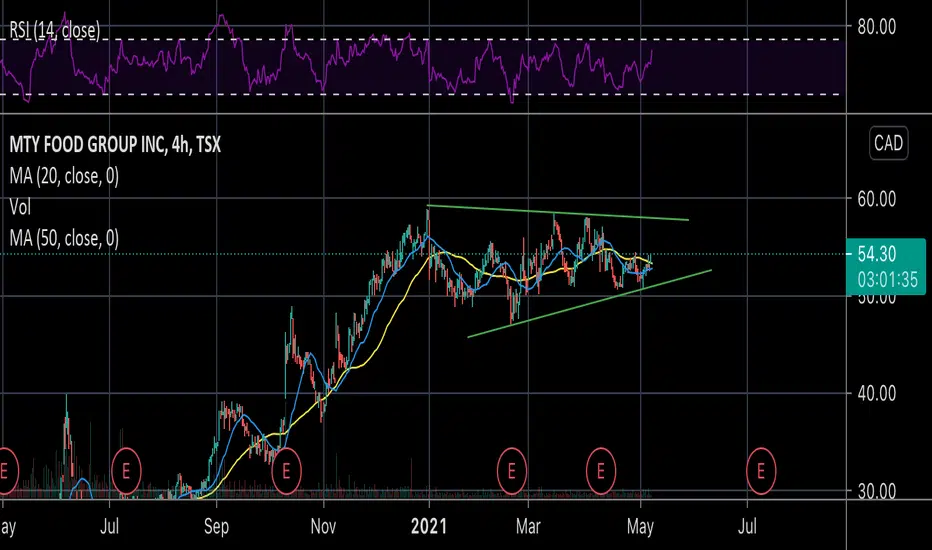
MtyMty looks to be consolidating for a while now.
I like this company fundamentally.
Small idea, possible swing but unpredictable market.
DYOR.
I think this will move up with re opening in Canada.
MTY Food Group, Inc.
No trades
Next report date
—
Report period
—
EPS estimate
—
Revenue estimate
—
1.04 USD
17.25 M USD
827.38 M USD
18.92 M
About MTY Food Group Inc.
Sector
Industry
CEO
Eric Lefebvre
Website
Headquarters
Saint-Laurent
Founded
1979
IPO date
Feb 7, 1989
Identifiers
3
ISIN CA55378N1078
MTY Food Group, Inc. engages in the franchise and operation of causal dining restaurants and sale of retail products under a multitude of banners. It operates through the Canadian Operations and USA and International Operations segments. Its brands include Papa Murphy's, Cold Stone Creamery, Thai Express, Sweet Frog, Taco Time Us, Sushi Shop, Toujours Mikes, Mucho Burrito, Baton Rouge, Manchu Wok, Baja Fresh, Mr. Sub, Taco Time Ca, Yuzu Sushi, Allo Mon Coco, Pizza Delight, Scores, Ben, and Florentine. The company was founded by Stanley Ma in 1979 and is headquartered in Saint-Laurent, Canada.
Related stocks
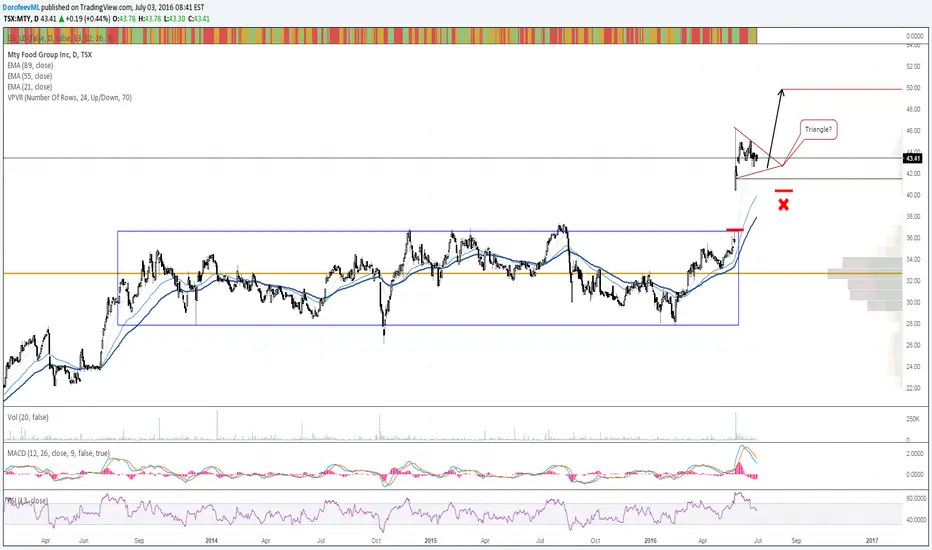
Inverse Head and Shoulders on MTYOne of my favorite Canadian companies.
Still below pre covid price levels.
I think this will run soon.

MTY UPDATEPossible cup and handle forming.
I still believe long term this is a great Canadian stock that is still trading below pre covid levels. With malls scheduled to re open in Quebec and other parts of canada, we can see a move up.
Short term target is $55-57
Long term target imo is pre covid level

MTY Update WeeklySymmetrical Triangle.
Resistance is $55 atm.
Long term can be beneficial although a little bearish at the moment.
Hugh upside value when restaurants and malls open again.
Can be a good long term play.
Short term targets of 55, 60, 65 if we can keep a bullish momentum.
Earnings can cause bear

MTY GambleProbably on the companies that got hit hardest by Covid and the pandemic. Still trying to find its way back to pre covid levels. This can be a great long term buy. I was in this at 28 and sold at 50. Will look to get in again if we see sub 45. Their focus is food court restaurants which are still re

Watching For Upside in MTY.TOLong-term uptrend with a cup and handle like pattern forming through most of this year. Looking for a continuation to the upside. Steady earnings and revenue growth.
Not buying quite yet. Waiting for a breakout above the recent short-term highs. These patterns can last a while, so don't want to j

See all ideas
Summarizing what the indicators are suggesting.
Neutral
SellBuy
Strong sellStrong buy
Strong sellSellNeutralBuyStrong buy
Neutral
SellBuy
Strong sellStrong buy
Strong sellSellNeutralBuyStrong buy
Neutral
SellBuy
Strong sellStrong buy
Strong sellSellNeutralBuyStrong buy
An aggregate view of professional's ratings.
Neutral
SellBuy
Strong sellStrong buy
Strong sellSellNeutralBuyStrong buy
Neutral
SellBuy
Strong sellStrong buy
Strong sellSellNeutralBuyStrong buy
Neutral
SellBuy
Strong sellStrong buy
Strong sellSellNeutralBuyStrong buy
Displays a symbol's price movements over previous years to identify recurring trends.
DRFC
Desjardins RI Canada Multifactor - Net-Zero Emissions Pathway ETFWeight
0.25%
Market value
516.41 K
USD
Explore more ETFs
Frequently Asked Questions
The current price of MTYFF is 32.15 USD — it has increased by 0.09% in the past 24 hours. Watch MTY Food Group, Inc. stock price performance more closely on the chart.
Depending on the exchange, the stock ticker may vary. For instance, on OTC exchange MTY Food Group, Inc. stocks are traded under the ticker MTYFF.
MTYFF stock has risen by 2.70% compared to the previous week, the month change is a 10.66% rise, over the last year MTY Food Group, Inc. has showed a −8.15% decrease.
We've gathered analysts' opinions on MTY Food Group, Inc. future price: according to them, MTYFF price has a max estimate of 36.70 USD and a min estimate of 27.15 USD. Watch MTYFF chart and read a more detailed MTY Food Group, Inc. stock forecast: see what analysts think of MTY Food Group, Inc. and suggest that you do with its stocks.
MTYFF reached its all-time high on Oct 7, 2021 with the price of 56.55 USD, and its all-time low was 11.00 USD and was reached on Mar 18, 2020. View more price dynamics on MTYFF chart.
See other stocks reaching their highest and lowest prices.
See other stocks reaching their highest and lowest prices.
MTYFF stock is 0.44% volatile and has beta coefficient of 0.96. Track MTY Food Group, Inc. stock price on the chart and check out the list of the most volatile stocks — is MTY Food Group, Inc. there?
Today MTY Food Group, Inc. has the market capitalization of 710.41 M, it has increased by 2.79% over the last week.
Yes, you can track MTY Food Group, Inc. financials in yearly and quarterly reports right on TradingView.
MTY Food Group, Inc. is going to release the next earnings report on Feb 19, 2026. Keep track of upcoming events with our Earnings Calendar.
MTYFF earnings for the last quarter are 0.87 USD per share, whereas the estimation was 0.89 USD resulting in a −2.72% surprise. The estimated earnings for the next quarter are 0.59 USD per share. See more details about MTY Food Group, Inc. earnings.
MTY Food Group, Inc. revenue for the last quarter amounts to 216.06 M USD, despite the estimated figure of 213.97 M USD. In the next quarter, revenue is expected to reach 201.76 M USD.
MTYFF net income for the last quarter is 20.28 M USD, while the quarter before that showed 41.67 M USD of net income which accounts for −51.33% change. Track more MTY Food Group, Inc. financial stats to get the full picture.
Yes, MTYFF dividends are paid quarterly. The last dividend per share was 0.27 USD. As of today, Dividend Yield (TTM)% is 3.12%. Tracking MTY Food Group, Inc. dividends might help you take more informed decisions.
MTY Food Group, Inc. dividend yield was 2.35% in 2024, and payout ratio reached 111.11%. The year before the numbers were 1.94% and 23.45% correspondingly. See high-dividend stocks and find more opportunities for your portfolio.
As of Feb 14, 2026, the company has 7.63 K employees. See our rating of the largest employees — is MTY Food Group, Inc. on this list?
EBITDA measures a company's operating performance, its growth signifies an improvement in the efficiency of a company. MTY Food Group, Inc. EBITDA is 189.98 M USD, and current EBITDA margin is 22.68%. See more stats in MTY Food Group, Inc. financial statements.
Like other stocks, MTYFF shares are traded on stock exchanges, e.g. Nasdaq, Nyse, Euronext, and the easiest way to buy them is through an online stock broker. To do this, you need to open an account and follow a broker's procedures, then start trading. You can trade MTY Food Group, Inc. stock right from TradingView charts — choose your broker and connect to your account.
Investing in stocks requires a comprehensive research: you should carefully study all the available data, e.g. company's financials, related news, and its technical analysis. So MTY Food Group, Inc. technincal analysis shows the strong buy rating today, and its 1 week rating is buy. Since market conditions are prone to changes, it's worth looking a bit further into the future — according to the 1 month rating MTY Food Group, Inc. stock shows the neutral signal. See more of MTY Food Group, Inc. technicals for a more comprehensive analysis.
If you're still not sure, try looking for inspiration in our curated watchlists.
If you're still not sure, try looking for inspiration in our curated watchlists.