Clean EnergyThe transition to clean energy has been happening but at a slower pace. Fossil fuel is here to stay for years to come since our survival heavily depends on its byproducts. The iShare Clean Energy ETF will trach this transition as we increase the adoption of clean/renewable energy.
The ETF is heavi
Key stats
About iShares Global Clean Energy ETF
Expense ratio
0.41%
Home page
Inception date
Jun 24, 2008
ICLN invests in global clean energy companies, which is defined as those involved in the biofuels, ethanol, geothermal, hydroelectric, solar, and wind industries. Aside from holding companies that produce energy through these means, ICLN also includes companies that develop technology and equipment used in the process. Selected by the index committee, the fund is weighted by market-cap and exposure score subject to several constraints and reconstituted semi-annually. Prior to April 19, 2021, the index followed a more narrow methodology.
Classification
What's in the fund
Exposure type
Utilities
Electronic Technology
Producer Manufacturing
Stock breakdown by region

ICLN etf nice look here. With solar running hot I've got me eye on this Global Clean energy ETF with big holdings in ENPH (8.9%) SEDG (8.2%) and FSLR (8.2%) Clean looking wedge pattern here on the daily. Not a lot of ATR on this one but could set up for a nice swing. Watching for a breakout of that 20 spot if solar continue

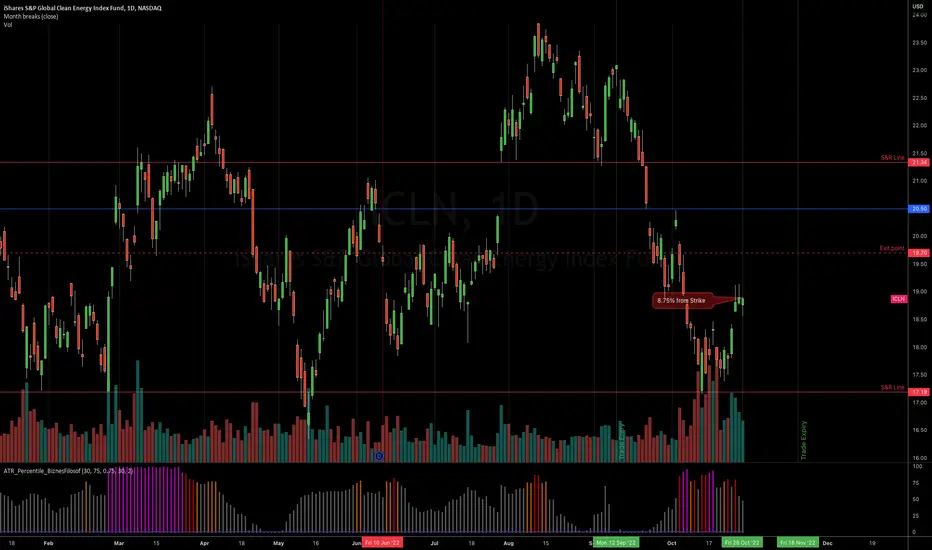
ICLN Bullish inclined naked puts 14 Oct expiryWhats The Plan/Trade/Thought
ICLN is one of the 3 largest renewable energy ETF’s by assets under management. These 3 ETFs all have a significant holding on to stock ENPH. So it almost acts like an insulated ENPH proxy.
ICLN generally follows the S&P and the drops a less drastic. The recent 6%

ICLN Bearish inclined naked calls 18 Nov expiry
Whats The Plan/Trade/Thought
ICLN is an ETF filled with companies that will rely heavily on bank loans to operate, this would probably result in accelerated dips with the increasing interest rates
Risk Mitigation
I see 19.70 as my indicator that my direction is wrong and I should exit
Can
ICLN - Global Clean Energy ETF - LongPrices are trading in a corrective formation ahead of an impulse upward 5th wave. The next move will drive the market higher to 25.20, 25.50 and 26.10. We would recommend building long positions at market with a take profit at 25.20/50.
A daily close below 20.00 would invalidate the upward scenario


Global Clean Energy READY TO TAKE OFF?!Energy dependent Nations looking for new sources of energy primarily clean Energy. The Bipartisan Infrastructure Law and the Energy Act of 2020 provides over $60 billion primarily for new major clean energy demonstration and deployment programs and more than triples DOE’s annual funding for energy p

Clean Energy Index Fund - Good entry levelClean Energy sector shows a solid entry point.
Fib retracement and fib extension seem to have formed a bottom at the 17 level.
IMHO this is a good entry level, with SL below 17 and target above 40 offering an 8:1 ratio.
The macro outlook also support the bullish case.

2022 ICLN Renewable Energy Sector ETFHey the renewable energy sector has underperformed the market in 2021, will look for an entry of $15-16 area in 2022 for a big swing stay updated.

$icln - a healthy looking monthly chartlots panicked over the sell off since ATH.
Just sit back, relax. set it and forget it. this is not a stock to trade.

See all ideas