🇺🇸 Review of MVIS – MicroVisionIn recent weeks, MicroVision (MVIS) has been gaining attention again. The company specializes in advanced laser and sensor technologies, focusing on autonomous vehicle solutions – combining both hardware and software to give cars "smart eyes" to understand the road.
Leading analysts currently rate
MicroVision, Inc.
No trades
Next report date
—
Report period
—
EPS estimate
—
Revenue estimate
—
−0.3679 USD
−96.92 M USD
4.70 M USD
301.47 M
About MicroVision, Inc.
Sector
Industry
CEO
Glen W. de Vos
Website
Headquarters
Redmond
Founded
1993
IPO date
Aug 27, 1996
Identifiers
3
ISIN US5949603048
MicroVision, Inc. engages in the development of laser beam scanning technology. The company integrates micro-electrical mechanical systems, lasers, optics, hardware, algorithms and machine learning software into its proprietary technology to address existing and emerging markets. It also develops automotive lidar sensors and provides solutions for advanced driver-assistance systems, autonomous vehicles, and non-automotive applications. The company was founded in May 1993 and is headquartered in Redmond, WA.
Related stocks
MicroVision (MVIS) - Swing TradeTechnically and fundamentally set up for a run to $2.50-$3.00 by EOY.
All-time high institutional ownership.
Industrial LiDAR deals "very close."
Military/Anduril potential connections is the ultimate wildcard.
Ongoing Auto OEM RFQs.
Once current resistance of 1.20 is broken, we're back in
MicroVision Inc - MVIS Stock on Triggering Explosive Level
Target prices between 14.72$ - 18.27$ ---- 88.6% / 113%
Bearish Shark Harmonic shap pattern 🦈
Strongly Buy recommended 👌
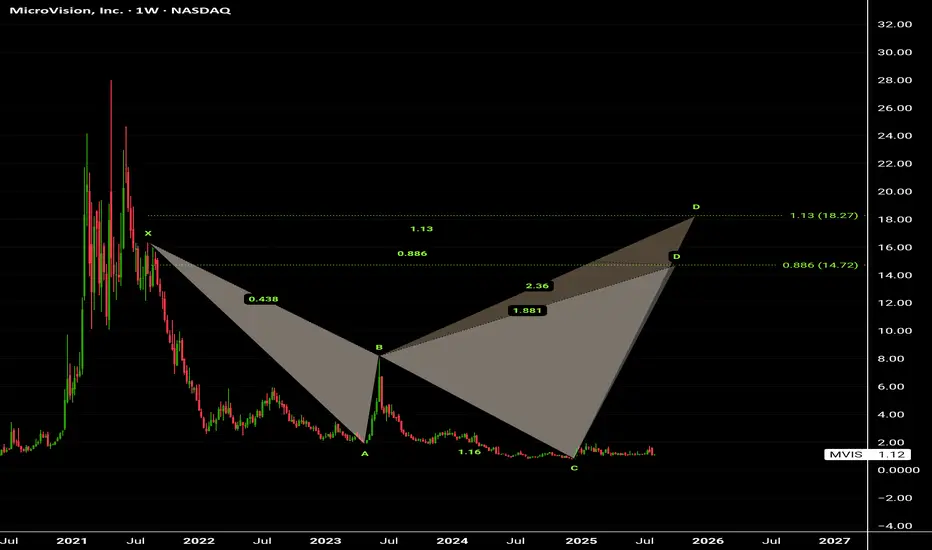
Microvision Inc (MVIS).Stock on triggering Explosive Level.
🦈 Shark Harmonic shap Target price above 14$ .
Any breaking up Resistance level 1.21$ , Buying signal triggering, Explosive level = 1.95$
Highly recommended for Buying now 👌

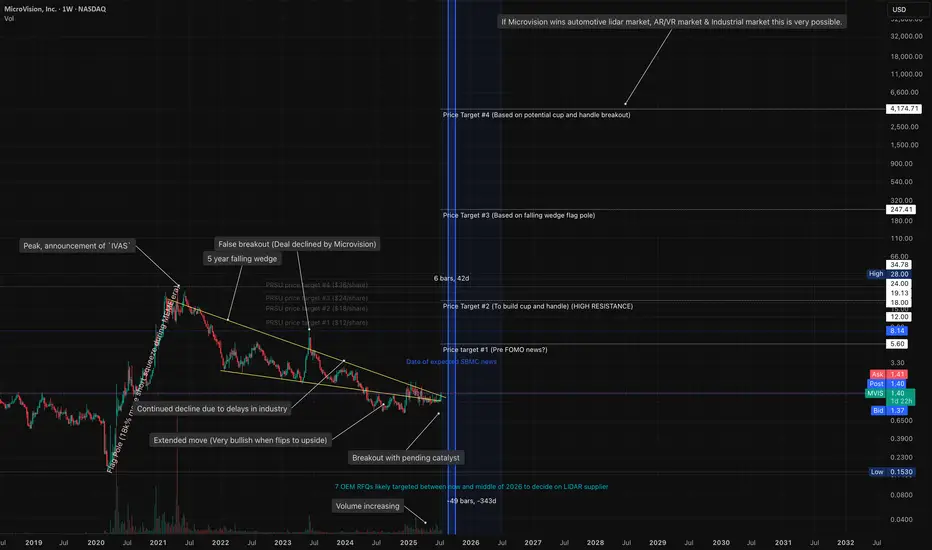
Markets Converging MVIS market changing potentialMicrovision is weeks away from hitting an intense inflection point.
Pending news for SBMC (decision date August 29th )
Microvision is partnered with NVDA for their driving lidar and software -- and have a plug and play system better than any competitor. (an update was made to MVIS website while
MVIS Swing Trade Setup & Technical AnalysisCurrent Price Action:
• MVIS is trading at a key support zone ($1.30-$1.40), which has historically been an accumulation area.
• The broader trend remains bullish, but short-term price action is consolidating.
• Volume is increasing, indicating growing interest, but a decisive breakout or rejection

MVIS multi pattern bullish reversal to 5 year highs and beyondgiven the different chart patterns.This is my humble expectation for MVIS between now and end of 2026.I believe we will FOMO to $3.00 before news. Settle back down to 1.50 range forming an inverse head and shoulders.Then with good news, running to $7/8 range and consolidating. At that point, we wi

Microvision is entering new price levels.NASDAQ:MVIS has broken the $2.00 resistance, forming a new trading range from that level. This stock is ideal for long-term investments as well.
(This is our signal)

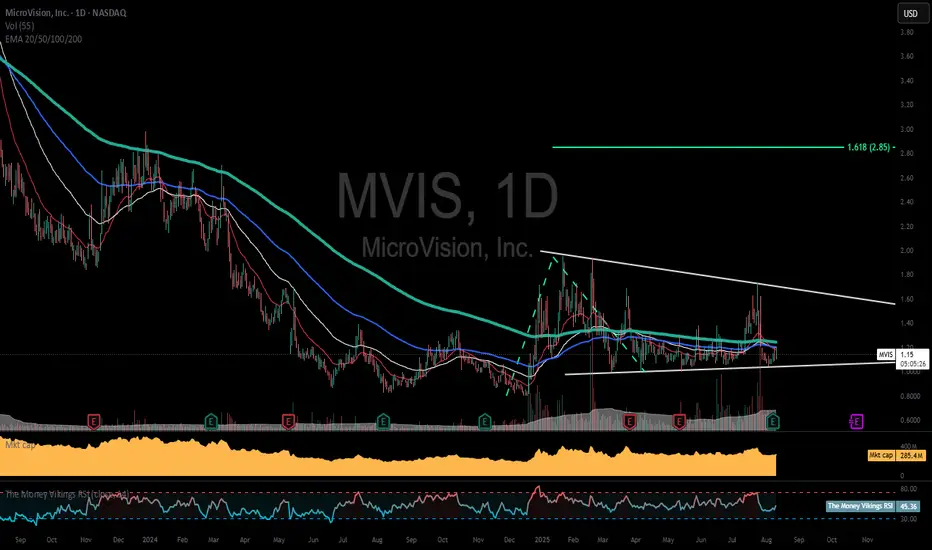
MVIS ready to go? Technical Analysis of MVIS (MicroVision, Inc.)
Key Observations:
Falling Wedge Pattern:
The chart shows MVIS trading within a long-term falling wedge, which is generally a bullish reversal pattern if broken to the upside.
The stock attempted to break out recently but is currently testing key levels

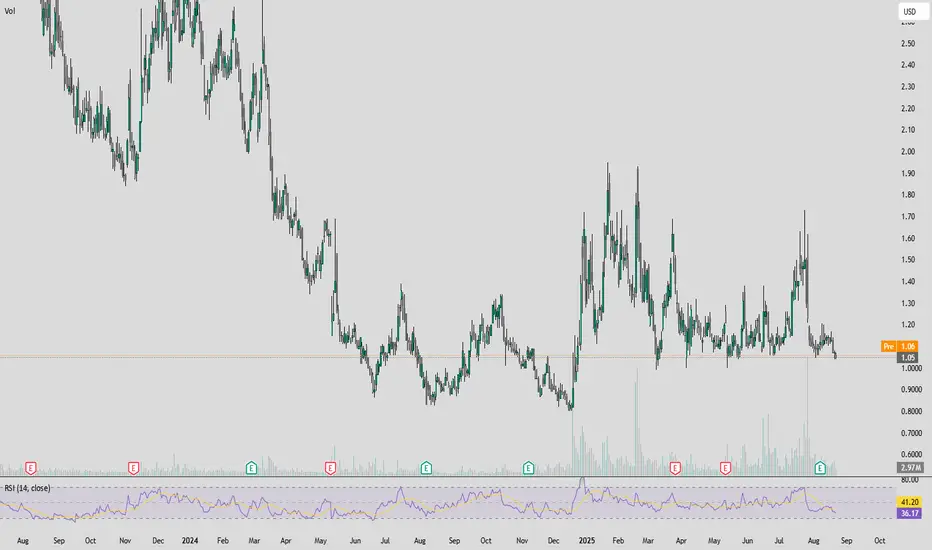
$MVISOff lows, break out of descending wedge with a low volume retest. Key area to break low 1.70s for move into mid SET:2S with short term targets green, white, and pink lines in that area.

See all ideas
Summarizing what the indicators are suggesting.
Neutral
SellBuy
Strong sellStrong buy
Strong sellSellNeutralBuyStrong buy
Neutral
SellBuy
Strong sellStrong buy
Strong sellSellNeutralBuyStrong buy
Neutral
SellBuy
Strong sellStrong buy
Strong sellSellNeutralBuyStrong buy
An aggregate view of professional's ratings.
Neutral
SellBuy
Strong sellStrong buy
Strong sellSellNeutralBuyStrong buy
Neutral
SellBuy
Strong sellStrong buy
Strong sellSellNeutralBuyStrong buy
Neutral
SellBuy
Strong sellStrong buy
Strong sellSellNeutralBuyStrong buy
Displays a symbol's price movements over previous years to identify recurring trends.
Frequently Asked Questions
The current price of MVIS is 0.7515 USD — it has increased by 7.62% in the past 24 hours. Watch MicroVision, Inc. stock price performance more closely on the chart.
Depending on the exchange, the stock ticker may vary. For instance, on NASDAQ exchange MicroVision, Inc. stocks are traded under the ticker MVIS.
MVIS stock has risen by 8.39% compared to the previous week, the month change is a −22.17% fall, over the last year MicroVision, Inc. has showed a −45.94% decrease.
We've gathered analysts' opinions on MicroVision, Inc. future price: according to them, MVIS price has a max estimate of 3.00 USD and a min estimate of 2.00 USD. Watch MVIS chart and read a more detailed MicroVision, Inc. stock forecast: see what analysts think of MicroVision, Inc. and suggest that you do with its stocks.
MVIS reached its all-time high on Mar 20, 2000 with the price of 548.0000 USD, and its all-time low was 0.1530 USD and was reached on Mar 16, 2020. View more price dynamics on MVIS chart.
See other stocks reaching their highest and lowest prices.
See other stocks reaching their highest and lowest prices.
MVIS stock is 8.14% volatile and has beta coefficient of 0.74. Track MicroVision, Inc. stock price on the chart and check out the list of the most volatile stocks — is MicroVision, Inc. there?
Today MicroVision, Inc. has the market capitalization of 229.51 M, it has increased by 3.34% over the last week.
Yes, you can track MicroVision, Inc. financials in yearly and quarterly reports right on TradingView.
MicroVision, Inc. is going to release the next earnings report on Mar 4, 2026. Keep track of upcoming events with our Earnings Calendar.
MVIS earnings for the last quarter are −0.05 USD per share, whereas the estimation was −0.06 USD resulting in a 16.67% surprise. The estimated earnings for the next quarter are −0.05 USD per share. See more details about MicroVision, Inc. earnings.
MicroVision, Inc. revenue for the last quarter amounts to 241.00 K USD, despite the estimated figure of 225.00 K USD. In the next quarter, revenue is expected to reach 1.60 M USD.
MVIS net income for the last quarter is −14.22 M USD, while the quarter before that showed −14.23 M USD of net income which accounts for 0.08% change. Track more MicroVision, Inc. financial stats to get the full picture.
No, MVIS doesn't pay any dividends to its shareholders. But don't worry, we've prepared a list of high-dividend stocks for you.
As of Feb 16, 2026, the company has 185 employees. See our rating of the largest employees — is MicroVision, Inc. on this list?
EBITDA measures a company's operating performance, its growth signifies an improvement in the efficiency of a company. MicroVision, Inc. EBITDA is −52.55 M USD, and current EBITDA margin is −1.58 K%. See more stats in MicroVision, Inc. financial statements.
Like other stocks, MVIS shares are traded on stock exchanges, e.g. Nasdaq, Nyse, Euronext, and the easiest way to buy them is through an online stock broker. To do this, you need to open an account and follow a broker's procedures, then start trading. You can trade MicroVision, Inc. stock right from TradingView charts — choose your broker and connect to your account.
Investing in stocks requires a comprehensive research: you should carefully study all the available data, e.g. company's financials, related news, and its technical analysis. So MicroVision, Inc. technincal analysis shows the sell today, and its 1 week rating is sell. Since market conditions are prone to changes, it's worth looking a bit further into the future — according to the 1 month rating MicroVision, Inc. stock shows the sell signal. See more of MicroVision, Inc. technicals for a more comprehensive analysis.
If you're still not sure, try looking for inspiration in our curated watchlists.
If you're still not sure, try looking for inspiration in our curated watchlists.