US NAS 100 BIG FALLPreferably suitable for scalping and accurate as long as you watch carefully the price action with the drawn areas.
With your likes and comments, you give me enough energy to provide the best analysis on an ongoing basis.
And if you needed any analysis that was not on the page, you can ask me with a comment or a personal message.
Enjoy Trading ;)
Trade ideas

Nasdaq Holds Firm After Support Rebound| Focus on 25820 BreakoutUSNAS100 | Overview
The price retested our support at 25430 and bounced perfectly, just as outlined in the previous analysis.
After reaching the resistance zone, the index is now consolidating between 25700 and 25820, awaiting a decisive breakout.
A 1H close above 25820 would confirm bullish continuation, targeting 25960 and 26170.
However, a 4H close below 25700 would indicate the start of a bearish correction, with downside potential toward 25570 and 25430.
Pivot Line: 25700
Resistance: 25820 · 25960 · 26170
Support: 25570 · 25430 · 25230
Outlook:
USNAS100 remains bullish while above 25700, with upside targets at 25960–26170.
A confirmed 4H close below 25700 would shift the short-term tone to a bearish correction toward 25570–25430.

Nasdaq Fails to Return to Record HighsOver the past six trading sessions, the Nasdaq index has begun to show a notable bearish correction of more than 2.6% in the short term, reinforcing a downward bias that remains active at this stage. So far, the selling pressure has persisted as the market grows increasingly concerned about the performance of several companies linked to artificial intelligence, which have maintained significant valuations without yet reporting profits strong enough to justify those price levels. This situation has started to raise warning signals and trigger a short-term decline in confidence, which, if sustained, could become a key driver of stronger selling pressure in Nasdaq movements over the coming sessions.
Uptrend Still Holding
Despite recent corrections, the Nasdaq index has managed to preserve a steady upward trendline since around April 14 of this year, and so far, there has not been a strong enough sell-off to cause a meaningful break of this trend in the short term. However, if the current selling pressure continues, it could increase the risk of weakening the buying trendline, which has recently entered a phase of consolidation or pause over the past few sessions.
RSI
The RSI indicator line remains oscillating close to the 50 level, suggesting a technical balance between buying and selling strength over the average impulses of the last 14 trading sessions. As long as this behavior persists, the market may enter a more pronounced phase of indecision in the short term, reflecting the absence of a clear directional bias in price movements.
MACD
The MACD indicator, meanwhile, has started to show a neutral pattern, as its histogram continues to approach the zero line. This indicates indecision in the strength of short-term moving averages and could be signaling the formation of a more significant technical neutrality, where the market seeks an equilibrium point before defining a new directional move.
Key Levels to Watch:
26,000 points – Main resistance: Corresponds to the recent record highs and stands as the most important bullish barrier to watch. Movements that manage to hold above this level could confirm a stronger buying bias, potentially allowing the uptrend to continue on the chart.
25,115 points – Near support: This zone coincides with the most recent price retracements and could act as a technical barrier against potential short-term downward corrections.
23,800 points – Critical support: This level corresponds to the 23.6% Fibonacci retracement on the chart. Bearish movements that reach and break below this area could put the current trendline at risk and generate a stronger selling bias in the short term.
Written by Julian Pineda, CFA – Market Analyst

Nasdaq Battle between correction & innovationNASDAQ 100 (NDX)
Nasdaq 100 Index (NDX) currently sits at a crucial inflection point, defined by the overwhelming dominance of the technology sector's structural growth against a backdrop of increasing macroeconomic and technical vulnerability. After a historic rally driven by Artificial Intelligence (AI) euphoria, the market is undergoing a necessary and sharp correction, testing key support levels established during the latest bullish surge.
The Durable Foundation: AI, Earnings, and Profitability
The core bullish case for the NDX remains robust, fundamentally driven by the "Magnificent Seven" and the pervasive, non-negotiable surge in AI infrastructure spending. Unlike the speculative rallies of previous cycles, today's leaders are characterized by deep profitability, substantial cash flow, and diverse revenue streams.
Recent corporate earnings reaffirm this strength, with the technology sector posting strong double digit growth. This profitability suggests that investment in AI is being funded through internal cash flow, making the rally more sustainable than the debt fuelled expansion seen two decades ago. The long term trajectory is further supported by an accommodative Federal Reserve pivot, which is now in rate cutting mode a supportive contrast to the tightening cycle that ended the 2000 rally. The secular trend of technological innovation is accelerating, transforming AI from a growth narrative into an essential business imperative.
Macroeconomic and Sentiment Headwinds
Despite underlying corporate strength, recent market action signals a decisive sentiment shift rooted in macro uncertainty and high valuations. The index has experienced its steepest weekly decline since March, indicating heavy profit taking and a collective "reality check" among traders.
Several factors are contributing to this sentiment reversal:
1. Concentration Risk: The sheer weight of the largest components now represents an extraordinary percentage of the overall market capitalization, making the NDX acutely sensitive to volatility in just a few key names.
2. Labor Market Cooling: Data showing a significant spike in job cuts (particularly in the tech and warehousing sectors) has unsettled investors, suggesting that economic cooling is accelerating faster than anticipated.
3. Consumer Confidence: A sharp drop in consumer sentiment reflects heightened anxiety related to economic uncertainty and political instability, which historically dampens forward looking market optimism.
4. Valuation Concerns: While not at 2000 extremes, valuations remain elevated, shifting the market’s focus entirely from multiple expansion to demanding flawless execution and continuous earnings growth.
Technical Outlook: The Critical 25,000 Support Test
From a technical perspective, the NDX has been in a clear, rising trend channel over the medium to long term, confirming a persistent buy the dip mentality. However, the recent sell off has introduced significant short term caution.
The index is currently testing a non negotiable support zone around 25,000. This level is psychologically important and corresponds to a previous major breakout point. A decisive breakdown below this support could trigger a cascading sell off as automated stop loss orders are activated, potentially paving the way toward the next major supports at 24,500 and, more critically, 23,980.
Key Technical Levels:
• Immediate Support: 25,000
• Secondary Supports: 24,500, then 23,980
• Immediate Resistance: 25,200, followed by 25,500 and 25,700
Conclusion: Navigating the Volatility
Nasdaq 100 remains an index of unparalleled innovation and long term potential, yet its short term path is fraught with risk. The outlook hinges on the NDX's ability to hold the critical 25,000 support level. A bounce from this zone would confirm the resilience of the dip buyers and maintain the medium term bullish structure. Failure to hold this level, however, would signal a deeper technical correction is underway, shifting the focus to the lower support zones as the market cleanses its excessive exuberance. Traders should remain nimble, respecting the clear shift in short term momentum while maintaining conviction in the long term, secular growth of the technology giants.

NAS100 Berish FlagThere is a double top rejection currently at play on H1 and a bearish flag on M15.
A break out and retest of this flag will provide safer and a higher probability setup.

US NAS 100Preferably suitable for scalping and accurate as long as you watch carefully the price action with the drawn areas.
With your likes and comments, you give me enough energy to provide the best analysis on an ongoing basis.
And if you needed any analysis that was not on the page, you can ask me with a comment or a personal message.
Enjoy Trading ;)

US NAS 100With your likes and comments, you give me enough energy to provide the best analysis on an ongoing basis.
And if you needed any analysis that was not on the page, you can ask me with a comment or a personal message.
Enjoy Trading ;)

Nasdaq - The most important structure!💰Nasdaq ( TVC:NDQ ) perfectly respects structure:
🔎Analysis summary:
Over the course of the past couple of months, the Nasdaq has been rallying an expected +50%. Still, until the Nasdaq will retest the upper channel resistance trendline, this rally won't be over. Therefore, we can still see a rally of another +10% in the very near future.
📝Levels to watch:
$25,000 and $30,000
SwingTraderPhil
SwingTrading.Simplified. | Investing.Simplified. | #LONGTERMVISION

NAS100 – Bullish Setup Alert (Inverse Head & Shoulders on 30min)#NAS100 has been moving sideways on the higher time frames, showing consolidation after recent volatility. However, on the 30-minute chart, it’s now forming a clean Inverse Head & Shoulders pattern, which is a classic bullish reversal signal.
Key Levels to Watch:
Neckline Breakout Zone: Watch for a breakout above the neckline for confirmation of bullish momentum.
Entry Plan: Wait for a break and retest of the neckline before entering a long position.
Targets: Short-term resistance zones and Fibonacci extensions can be used for profit booking.
Risk Management: Always use a tight stop-loss below the right shoulder to protect capital.
Technical Outlook:
Once the neckline is broken with volume confirmation, it may trigger a strong bullish continuation move — aligning with broader market momentum.
What’s your view on this setup?
Do you see a breakout coming soon, or another fakeout before the move? Share your thoughts below
#NAS100 #Trading #PriceAction #ChartAnalysis #TechnicalAnalysis #HeadAndShoulders #Forex #Indices #DayTrading

US NAS 100Preferably suitable for scalping and accurate as long as you watch carefully the price action with the drawn areas.
With your likes and comments, you give me enough energy to provide the best analysis on an ongoing basis.
And if you needed any analysis that was not on the page, you can ask me with a comment or a personal message.
Enjoy Trading ;)

NAS100 Trade Set Up Nov 6 2025Price is bullish making HH/HL on the 1h and BOS of the Asia range so i will wait for price to sweep internal SSL and/or tap into 1h FVG to then look for 1m-5m IFVG/CISD to take buys to PDH and daily FVG to fill the imbalance

Nasdaq 100 Rebounds as Traders Anticipate End of the US ShutdownNasdaq 100 Rebounds as Traders Anticipate End of the US Shutdown
As the chart shows, the Nasdaq 100 index has started the week on a positive note amid growing expectations that the longest government shutdown in US history may soon come to an end.
According to Reuters, a bill has been introduced in the Senate proposing amendments to extend government funding until 30 January. The news acted as a bullish catalyst for equity markets. Still, the question remains – is the risk truly behind us?
Technical Analysis of the Nasdaq 100
Analysing the hourly chart of the Nasdaq 100 on 4 November, we:
→ Drew an ascending channel;
→ Noted signs of momentum exhaustion, as mentioned in our previous headline.
Since then, price action has evolved as follows:
→ The lower boundary of the channel provided support (1), prompting a brief rebound;
→ The 25,770 level acted as resistance (2) on two occasions, strengthening the bears’ confidence to push for a downside breakout — which ultimately succeeded.
The index’s subsequent movements have now more clearly outlined the formation of a descending channel (shown in red).
From the demand-side perspective:
→ After a false bearish breakout below 24,680 (showing characteristics of a Liquidity Grab pattern), the market staged an aggressive rally from point B;
→ Today’s session opened with a bullish gap, and the price has moved above the red median line.
From the supply-side perspective:
→ The 25,500 level, where sellers gained control during the previous channel breakout, may now act as resistance;
→ If the A→B move is viewed as an impulse, today’s rally appears to be a corrective rebound consistent with Fibonacci proportions — suggesting that downward momentum could resume within the red channel.
This article represents the opinion of the Companies operating under the FXOpen brand only. It is not to be construed as an offer, solicitation, or recommendation with respect to products and services provided by the Companies operating under the FXOpen brand, nor is it to be considered financial advice.

US NAS 100Preferably suitable for scalping and accurate as long as you watch carefully the price action with the drawn areas.
With your likes and comments, you give me enough energy to provide the best analysis on an ongoing basis.
And if you needed any analysis that was not on the page, you can ask me with a comment or a personal message.
Enjoy Trading ;)

Prepare for explosive move potential in US100
Market context
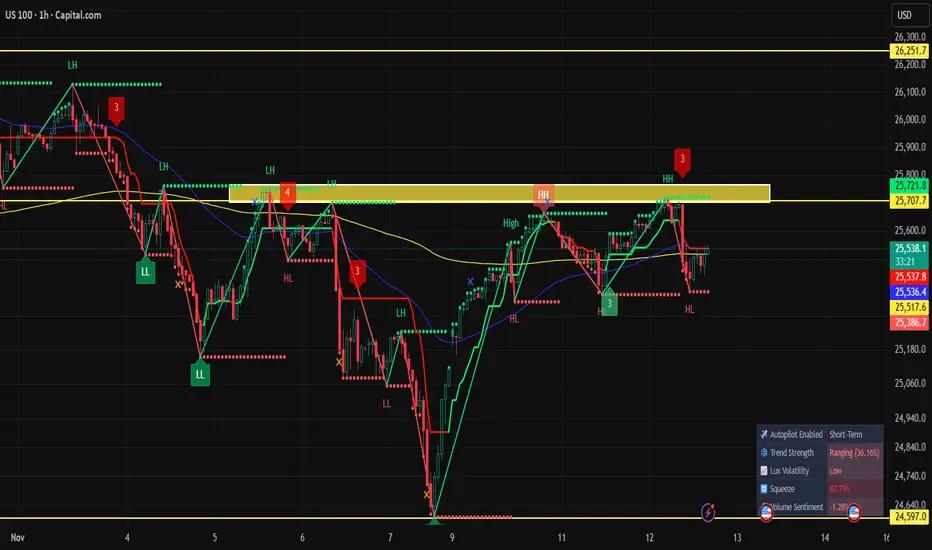
US100 has reversed the entire dump and is now coiling directly under a major supply band. Every pullback since the V-shaped bottom has formed a higher low and none of them have broken structure. Sellers keep defending the same yellow zone around 25700–25780 but each rejection has lost impact. That’s absorption.
The MAs aren’t rejecting price anymore. They’re flattening and starting to curl which usually shows the downtrend is done and the market is transitioning. Price is sitting in a tight range under supply with controlled candles instead of aggressive sell-offs. That’s exactly what you expect before a volatility expansion.
The squeeze being elevated here is the final piece. Low volatility coil under supply + higher lows + squeeze primed = pressure building. When the squeeze releases from this type of structure, it usually fires toward the side that’s been applying pressure. Buyers are the ones stepping in sooner each time, so the pressure is clearly up.
Clean liquidity is sitting above the recent HH inside and just above that yellow band. Everything on this chart points to that liquidity being taken first before anything else happens.
Key zones on US100
Support and demand
Major demand from the V reversal at 24600–24700
Intraday demand at 25100–25200
Most recent higher low structure around 25500
Resistance and supply
Main supply block (yellow zone) at 25700–25780
Liquidity sitting above the HH inside that band
Higher timeframe resistance at 26250
Structure
Higher lows stepping into fixed supply
Very low volatility coil
Squeeze primed
No LL since the reversal
Liquidity parked above price
Long setup through supply
This is the cleanest idea because the pattern is exactly what you want before an upside release: coiling, higher lows, weakening supply, squeeze loaded and obvious stops above.
What I need to see
A strong 1H close above the yellow supply block. Not a wick, an actual body close above roughly 25780. That confirms buyers finally cracked the ceiling.
Then a retest. Squeeze expansions often break then pull back once into the breakout zone to confirm it as support. That retest tells me it’s a proper breakout, not just a liquidity grab.
Entry
Retest zone for the long: 25730–25780
Trigger: a clean 15M rejection from that zone followed by a bullish close
Stop
Stop goes below the retest low and below the body of the old supply. Anything under 25600 is fine.
If US100 closes a 1H candle back inside the yellow zone after entry, I’m out immediately.
Targets
First target: 25900–26000
Second target: 26250
If the squeeze really opens up, US100 can run straight through those levels.
Short setup only if it becomes a sweep
I only consider a short when the breakout is fake. Coils like this usually break upward, but when they fake out, it’s violent. I want to be ready to flip quickly.
What confirms the sweep short
A spike above the yellow supply grabbing the HH liquidity, then a heavy rejection and a close back inside the zone.
Then US100 must break the most recent higher low on the 15M (around 25500). Without that break in structure, there is no short.
Entry
Short the underside of the yellow block on the retest or take the first clean 15M lower high after the structure break.
Stop
Above the sweep wick. If price trades above it again, the idea is dead.
Targets
First target: 25100–25200
Second target: 24800 area (origin of the V reversal)
Management and invalidation
Long idea
Valid as long as the last HL (around 25500) holds.
Lose that and I drop the long idea and prepare for the sweep short instead.
I am not trading the chop inside the range.
Short idea
Only valid after a sweep + break of structure.
Without both, I do not touch the short side because coils like this don’t normally break down first.
Summary
US100 isn’t showing weakness at all. It’s coiling under a ceiling with the squeeze loaded, volatility dying off and higher lows stepping into the same supply over and over. Sellers are defending one level and failing to push it down. That usually means the market wants the liquidity above the highs in the yellow zone. I’m looking to trade the break and retest long as my main setup. If it sweeps the highs, snaps back inside and breaks structure, I flip into the short. Otherwise I leave the range alone.
NAS100 Trade Set Up Nov 10 2025Price has shifted to bullish structure on the 1h so i will wait for price to sweep SSL or tap into bullish 1h FVG before looking for buys to target higher BSL

US NAS 100Preferably suitable for scalping and accurate as long as you watch carefully the price action with the drawn areas.
With your likes and comments, you give me enough energy to provide the best analysis on an ongoing basis.
And if you needed any analysis that was not on the page, you can ask me with a comment or a personal message.
Enjoy Trading ;)

US100 – Bullish Reversal Setup-H4: Turning bullish with a new high at 25,667.
Pullback: Formed a lower high, now H1 shifting bullish again.
Plan: Looking for buys above 25,542, SL below last H1 LH.
Adjustment: If another H1 LH forms and breaks upward, trail SL for tighter risk.
-Fundamental: Shutdown-end hopes , supporting the bullish scenario.

NASDAQ - Signal#NASDAQ - Signal
H4 - Formation of the 3rd wave + trend line breakout. Stop at the low of the 1st wave.
Entry: 25758.3
TP: 26252.9 - 26916.2 - 27341.2 - 28019.1
Stop: 25142.7

US100 - BULLISH POSSIBILITYPrice constantly forming higher lows which indicate a strong uptrend tendency. Possibility of stronger confirmation if you decide to wait for price to break above 25,750. This is purely ideas purpose only and should not be used alone to take on a trade. Good profits traders.

Nasdaq: Sharp tech drop sets up critical support testNasdaq slid 2% yesterday in its sharpest tech-led drop since late summer—are we looking at a healthy correction, or could there be a deeper move ahead?
Caution returned to tech stocks as AI valuations and a handful of Big Tech earnings disappointed. The broader market also retreated, with traders watching for the next move from both the Fed and the earnings calendar.
Key drivers:
AI and semiconductor leaders like Nvidia, AMD, and Palantir led the selloff as investors questioned how much further the AI trade can run.
Hawkish remarks from multiple Fed officials raised doubts about any imminent rate cuts, even after the recent 25bp cut, fuelling profit-taking in volatile growth names.
Top Wall Street banks cautioned about stretched valuations, warning a 10–20% correction was possible as positioning remains crowded in mega caps.
Technically, the Nasdaq is pulling back from historic highs, testing median channel support with RSI retreating toward neutral. Key resistances are near 25500 and 25750, with support showing at 25200 and then under 25k.
Stay nimble and respect the potential range between 25450 and 25870 as pivotal for the next Nasdaq swing. Wait for strong resistance confirmation, but don’t ignore bounce risk if earnings and data surprise to the upside.
This content is not directed to residents of the EU or UK. Any opinions, news, research, analyses, prices or other information contained on this website is provided as general market commentary and does not constitute investment advice. ThinkMarkets will not accept liability for any loss or damage including, without limitation, to any loss of profit which may arise directly or indirectly from use of or reliance on such information.

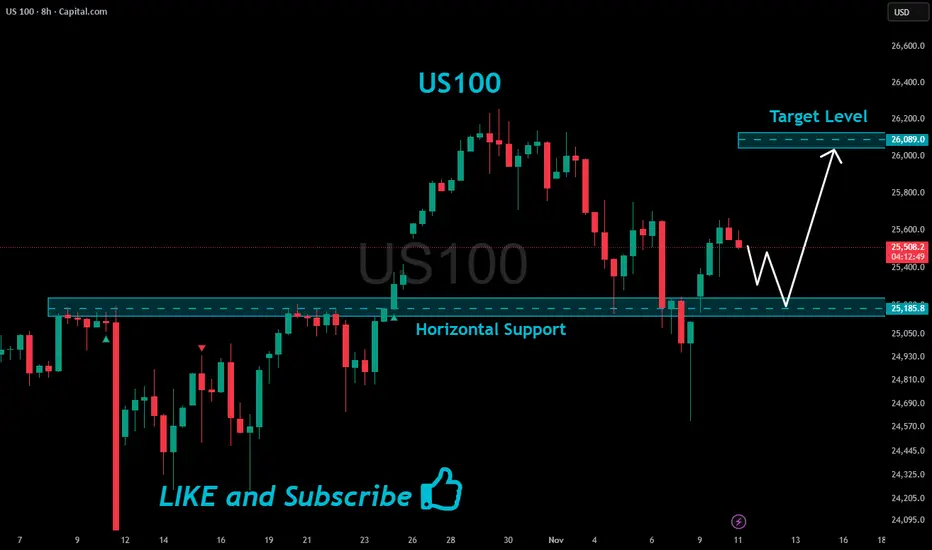
US100 Support Ahead!
HI,Traders !
#US100 is making a local
Bearish correction but
We are bullish biased mid-term
So after the pair hits the horizontal
Support of 25185.8 we will be
Expecting a local bullish rebound !
Comment and subscribe to help us grow !
NAS100 Trade Set Up Nov 12 2025Price trading above PDH and has a daily gab above to fill but first i would want to see a sweep of London lows/SSL before looking for 1m-5m IFVG/CISD to continue higher to sweep BSL and fill the daily imbalance

Nasdaq Short: Peak Confirmed; Bear Market ConfirmedIt is now clear that the bull market ended on 30th Oct and that we have already seen the first completed wave down for Nasdaq that unfolded in clear 5-wave structure. The sub-waves also showed clear 5-wave structure themselves.
We are currently in a wave 2 retracement that is facing the first real support-turned-resistance. However, take note that wave 2 can technically go all the way up to the start of wave 1 without invalidating the idea. So look out for reversal signal or confirmation before you short.
