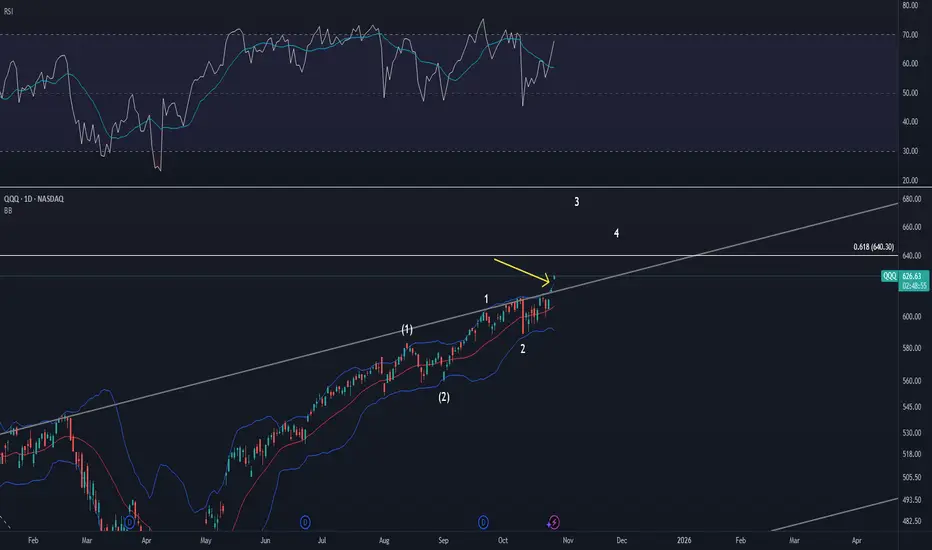
Lockout rally in wave 3 of (3)Oct 27's daily candle is significant because it's the first time that bursts out of the daily Bollinger Band and remains outside. This is typical action for wave 3 of (3). Full-on lockout rally mode. Any pull back will retest the outside of the band. I believe another gap up tomorrow.
Trade ideas
How Currency Valuations Impact Exporters and ImportersIntroduction
Currency valuation is one of the most powerful forces shaping global trade dynamics. Every day, trillions of dollars’ worth of goods, services, and investments cross borders, and the exchange rates between currencies determine how much value each participant gains or loses. A small shift in the rupee, dollar, euro, or yen can have a massive impact on exporters’ earnings, importers’ costs, and even a country’s overall trade balance.
For exporters and importers, understanding currency valuation is not just a financial technicality — it is a survival strategy. Whether a company sells machinery to Europe, imports raw materials from China, or outsources services to the U.S., fluctuations in exchange rates directly affect profitability, competitiveness, and strategic planning.
This essay explores how currency valuations influence exporters and importers, the mechanisms behind exchange rate movements, their implications on pricing, profitability, and policy decisions, and how businesses can manage the risks associated with currency fluctuations.
Understanding Currency Valuation
Currency valuation refers to the market-determined worth of one currency relative to another. It is usually expressed as an exchange rate — for example, ₹83 per U.S. dollar means that one dollar can be exchanged for 83 Indian rupees.
Exchange rates fluctuate due to a combination of factors such as:
Inflation differentials
Interest rate variations
Trade balances
Foreign investment flows
Central bank policies
Market speculation
When a currency appreciates, its value rises compared to others, meaning it can buy more foreign currency. When it depreciates, it loses value, meaning more domestic currency is needed to buy the same amount of foreign currency.
These movements, while often subtle on a daily basis, can have profound effects on international trade.
Impact on Exporters
Exporters earn revenue in foreign currencies but often bear costs in their home currency. Therefore, currency depreciation usually benefits exporters, while currency appreciation tends to hurt them. Let’s explore both situations.
1. Currency Depreciation: A Competitive Advantage
When a country’s currency depreciates, its goods and services become cheaper in foreign markets. For example, if the Indian rupee weakens from ₹75 to ₹85 per U.S. dollar, an American buyer can now buy more Indian products for the same amount of dollars.
This creates several benefits for exporters:
Price Competitiveness: Products appear cheaper abroad, boosting demand.
Higher Profits: Exporters earn more in domestic currency when converting foreign sales revenue.
Market Expansion: Depreciation can help penetrate new markets or outcompete suppliers from stronger-currency nations.
For instance, India’s textile and IT service exporters often benefit when the rupee weakens against the dollar. Their revenues in dollars translate into higher rupee earnings, improving margins even if prices remain constant.
2. Currency Appreciation: A Profit Squeeze
When a domestic currency strengthens, exporters face a dual challenge:
Their products become more expensive for foreign buyers, reducing competitiveness.
Their foreign revenues shrink in domestic terms.
For example, if the rupee appreciates from ₹85 to ₹75 per dollar, the same $1 million export sale now converts into ₹75 million instead of ₹85 million — a clear loss in rupee terms.
Unless exporters hedge their exposure or increase prices (which may hurt demand), their profit margins shrink significantly.
Industries that rely heavily on exports — such as automobiles, textiles, or pharmaceuticals — are particularly sensitive to such changes.
3. Long-Term Effects on Export Strategy
Persistent currency appreciation can force exporters to rethink their strategy:
Shift production abroad to reduce currency exposure.
Focus on higher value-added goods where price sensitivity is lower.
Increase use of financial hedging instruments.
On the other hand, a consistently weak currency can encourage export-led growth but might raise inflation due to costlier imports (like energy or components).
Impact on Importers
Importers face the opposite situation. They pay for foreign goods and services in foreign currencies but sell them domestically in their local currency. Hence, currency appreciation generally benefits importers, while currency depreciation hurts them.
1. Currency Appreciation: Lower Import Costs
When the domestic currency strengthens, importers gain purchasing power. They can buy more goods from abroad for the same amount of domestic currency.
For example, if the rupee appreciates from ₹83 to ₹78 per dollar, a $10,000 machine from the U.S. costs ₹7.8 lakh instead of ₹8.3 lakh.
The benefits include:
Reduced Import Costs: Lower costs for raw materials, equipment, or finished goods.
Lower Inflation: Cheaper imports can reduce overall price pressures in the domestic economy.
Improved Margins: Importers or retailers can either lower their selling prices or increase profit margins.
Industries such as electronics, oil, and automobiles — which rely heavily on imports — often welcome currency appreciation.
2. Currency Depreciation: Costly Imports
Depreciation has the opposite effect. The domestic currency buys fewer foreign goods, increasing import costs.
For example, if the rupee depreciates from ₹83 to ₹88 per dollar, that same $10,000 machine now costs ₹8.8 lakh.
This can lead to:
Higher Input Costs: Import-dependent manufacturers face rising costs of raw materials or components.
Inflationary Pressure: Costlier imports can push up consumer prices, especially for fuel or food.
Profit Margin Squeeze: Importers may struggle to pass higher costs to consumers, hurting profitability.
A prolonged depreciation phase can thus make it difficult for import-driven sectors like energy, technology, and healthcare to maintain stable pricing structures.
Exchange Rate Pass-Through: Linking Valuation to Pricing
The concept of exchange rate pass-through (ERPT) explains how much of the currency movement is reflected in the final price of goods.
Full Pass-Through: Exporters/importers adjust prices completely in line with exchange rate changes.
Partial Pass-Through: Companies absorb part of the exchange rate impact to remain competitive.
For example, if the rupee weakens 10% but an exporter only raises prices abroad by 5%, the remaining 5% is absorbed in margins.
The degree of pass-through depends on market conditions, demand elasticity, and brand power. Highly competitive markets (like garments) show low pass-through, while niche products or monopolistic services show higher pass-through.
Case Examples
1. Indian IT and Pharmaceutical Exporters
When the rupee depreciates, these sectors thrive because they earn in dollars but spend in rupees. During 2020–2023, rupee weakness benefited companies like Infosys, TCS, and Sun Pharma, improving operating margins despite global volatility.
2. Oil and Gold Importers
India imports most of its crude oil and gold. When the rupee weakens, import bills rise sharply, widening the current account deficit and creating inflationary pressure. This shows how currency valuation directly influences macroeconomic stability.
3. Japanese Yen and Export Competitiveness
Japan has long relied on a weak yen to maintain export competitiveness in automobiles and electronics. When the yen strengthens sharply, companies like Toyota or Sony face reduced foreign earnings, prompting shifts in production to other regions.
Macroeconomic Implications
1. Trade Balance Effects
Currency depreciation tends to boost exports and reduce imports, improving the trade balance. Conversely, appreciation may widen trade deficits.
However, the J-Curve effect suggests that after depreciation, the trade deficit may initially worsen (as import bills rise before export volumes adjust) before eventually improving.
2. Inflation and Interest Rates
A weaker currency can stoke inflation through higher import costs, prompting central banks to raise interest rates. A stronger currency can have a disinflationary effect, allowing for looser monetary policy.
Hence, exporters and importers must watch not just exchange rates but also central bank reactions.
3. Investment Flows
Stable currency values attract foreign investment, while volatile or overvalued currencies deter it. Export-oriented economies like China and South Korea often manage currency levels strategically to maintain competitiveness.
Risk Management and Hedging Strategies
Given the volatility in currency markets, exporters and importers use various tools to manage risk:
Forward Contracts: Lock in future exchange rates to avoid uncertainty.
Options and Futures: Provide flexibility to benefit from favorable moves while limiting losses.
Natural Hedging: Matching foreign currency revenues and expenses (e.g., using dollar earnings to pay dollar liabilities).
Diversification: Expanding trade across multiple markets to reduce dependency on one currency.
A disciplined hedging strategy protects profit margins and ensures financial stability despite volatile exchange rates.
Policy and Central Bank Interventions
Governments and central banks often intervene in foreign exchange markets to prevent excessive currency swings.
Managed Float Systems: Authorities allow market forces to determine exchange rates but step in during volatility.
Reserve Management: Buying or selling foreign reserves to influence currency supply.
Export Incentives and Import Duties: Used to balance the impact of currency movements on trade sectors.
For example, the Reserve Bank of India (RBI) actively manages rupee liquidity to avoid sharp fluctuations that could harm exporters or spike import costs.
The Balance Between Exporters and Importers
While a weaker currency aids exporters, it hurts importers and raises inflation. Conversely, a stronger currency benefits importers and consumers but reduces export competitiveness.
Thus, an optimal exchange rate — not too strong, not too weak — is crucial. The goal for policymakers is to maintain stability rather than favor one side.
In the long run, productivity, innovation, and diversification are more sustainable sources of competitiveness than currency manipulation.
Conclusion
Currency valuation stands at the crossroads of global trade, linking the fortunes of exporters, importers, investors, and entire economies. A fluctuating exchange rate is more than a number on a financial screen — it is a reflection of economic strength, investor confidence, and trade competitiveness.
For exporters, a weaker domestic currency can mean opportunity; for importers, it can mean challenge — and vice versa. But those who understand the mechanics of currency valuation, hedge their risks, and adapt strategically can turn volatility into advantage.
In a globalized era, exchange rate literacy is as essential as market knowledge. Whether you’re shipping goods overseas or sourcing materials from abroad, managing currency exposure is not merely financial prudence — it’s the foundation of resilient international business.

QQQ rally to 700Chart is about as simple as can be. If the COVID rally can do it, then the AI rally can to.

QQQ BTD Meets Stellar Megacap EarningsBuyers are stepping right back in on strong fundamentals rather than waiting for a deeper pullback
1. Catalysts
AMZN
Cloud & ad segments both surprised to the upside, margins expanded sharply - that’s the kind of result that revives the “AI + consumer resilience” narrative
AAPL
Solid services growth and upbeat iPhone guidance, plus strong China sales commentary - markets read that as macro-resilient
Together, these two control nearly 18-20% of QQQ’s weighting, so their beats mechanically lift the ETF
2. Technical implication
Futures & post-market prints around +1% (≈$632 to $639) mean QQQ is already testing back above R3 ($630.9)
If that holds into tomorrow’s open, it neutralizes the bearish engulfing from earlier & confirms buyers defending the channel
RSI on the 4H will likely turn up again before it ever reaches 50 - a bullish reset without full mean reversion
3. Key levels overnight into tomorrow
$637-$640
Post-market top/resistance band
If it breaks & holds >$640, then momentum squeeze likely
$630-$632
Prior R3/now potential support
Buyers defending here = bullish continuation
$620-$625
Must-hold range if futures fade
Below $620 would reopen mean-reversion path
If futures fade back to ~$632 at open, that’s normal profit-taking - the key is whether the first dip gets bought quickly
This is classic “buy-the-dip meets stellar megacap earnings” behavior
Given the Fed pause backdrop & strong tech prints, the odds now tilt toward QQQ retesting ~$645-$650 before any new consolidation phase

A Lesson in Patience and structure - ORB waited till 2pm todayFellow traders,
Today tested patience more than precision.
The morning was a maze — choppy price action, overlapping candles, and zero conviction. The ORB range between 9:30–9:45 never gave clean confirmation. Buyers held the low, sellers pressed the top, but neither could gain control. Every candle said, “not yet.”
Then came midday compression. From 11 AM to 1:30 PM, QQQ coiled tightly under the EMAs and VWAP. That silence wasn’t random — it was the market loading energy. The moment VWAP was lost for good, the floodgates opened.
Finally, around 2 PM, the breakdown came: a clean retest rejection of the ORB box and an accelerated drop through 629. The move I had been watching all day finally unfolded — only this time, discipline said don’t chase.
And that’s the point of today’s session.
Not every move is yours to catch. Sometimes your biggest win is not forcing a trade that forms too late or breaks your system’s timing window.
Patience is part of the strategy.
The setup played out exactly as it should — I just didn’t have to be in it to learn from it.
Stay disciplined. Stay sharp.
— Trades with B ⚡
Daily Recap – The Patience Play (QQQ ORB Setup)Fellow traders,
Today was one of those sessions that remind us: sometimes the best trade is no trade at all.
The morning ORB (9:30 – 9:45 NY) gave us a wide initial range with very little conviction in either direction. We saw price flirt with both edges, but no candle could close decisively outside the box. Each push quickly reversed, leaving nothing but wicks and false momentum.
Volume stayed neutral and the EMAs never truly separated — a classic sign of indecision. Even the higher-timeframe (30-min) trend stayed flat, confirming there was no clean alignment to give us the confidence we needed.
Mid-session, price finally poked above the ORB high — but it immediately failed and rolled right back into the range. Later in the day, the real move came to the downside… well past the optimal ORB window. By then, discipline meant staying out.
👉 No setup, no entry — and that’s perfectly fine.
The goal isn’t to trade every day; it’s to trade only when probability lines up.
Tomorrow, we reset with the same rules:
Wait for a clean break and retest outside the ORB.
Confirm volume and trend.
Let the market come to us.
Stay patient, stay disciplined, and remember — consistency is built on the days you don’t force it.
— Trades with B
QQQ : Stay heavy on positionsQQQ : Stay heavy on positions (QLD, TQQQ)
Entering a risk-on, high-volatility zone.
In stay light on positions zones, I hold QQQ and reduce exposure.
In stay heavy on positions zones, I increase allocation using a mix of QLD and TQQQ.
** This analysis is based solely on the quantification of crowd psychology.
It does not incorporate price action, trading volume, or macroeconomic indicators.

QQQ Will Collapse! SELL!
My dear followers,
I analysed this chart on QQQ and concluded the following:
The market is trading on 617.00 pivot level.
Bias - Bearish
Technical Indicators: Both Super Trend & Pivot HL indicate a highly probable Bearish continuation.
Target - 605.94
About Used Indicators:
A super-trend indicator is plotted on either above or below the closing price to signal a buy or sell. The indicator changes color, based on whether or not you should be buying. If the super-trend indicator moves below the closing price, the indicator turns green, and it signals an entry point or points to buy.
Disclosure: I am part of Trade Nation's Influencer program and receive a monthly fee for using their TradingView charts in my analysis.
———————————
WISH YOU ALL LUCK
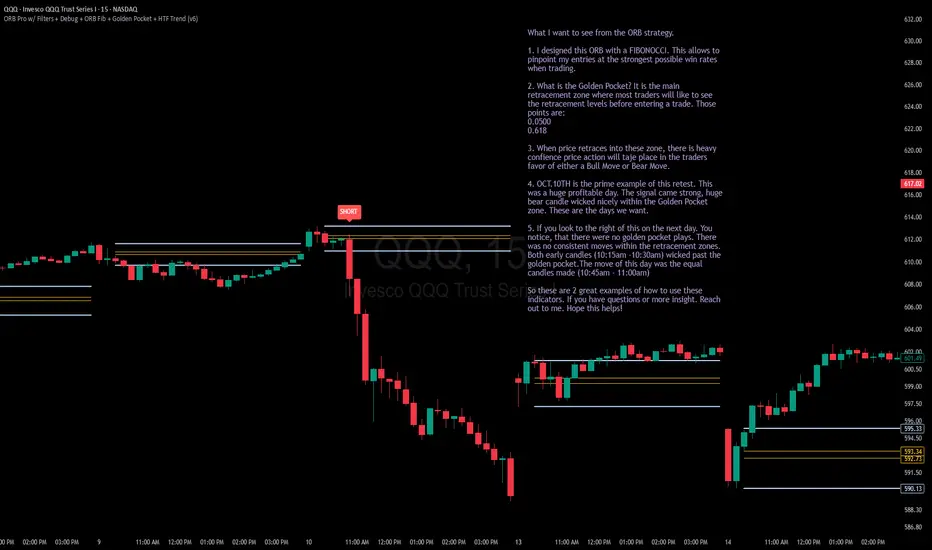
RECAP TODAY. USING THE SIGNALS AND TOOLS Fellow traders - followers,
I have some today to recap on the day.
Now I will say this. Today went the way they said it would go UP! All the overnight new, the morning media and the tech headlines all made today a profitable day for the bulls! I will also say this: it is a scary situation, because we have no resistance levels up here, so where does all this up trend movement stop? What do we know or where to put our stop losses?
In building these indicators, I'm learning a few things. I'm learning more about myself and about what to look for exactly. There will be days where I will lose. Just like Friday: -$280! The price action was just not as consistent and friendly like it was today.
Let me break down today:
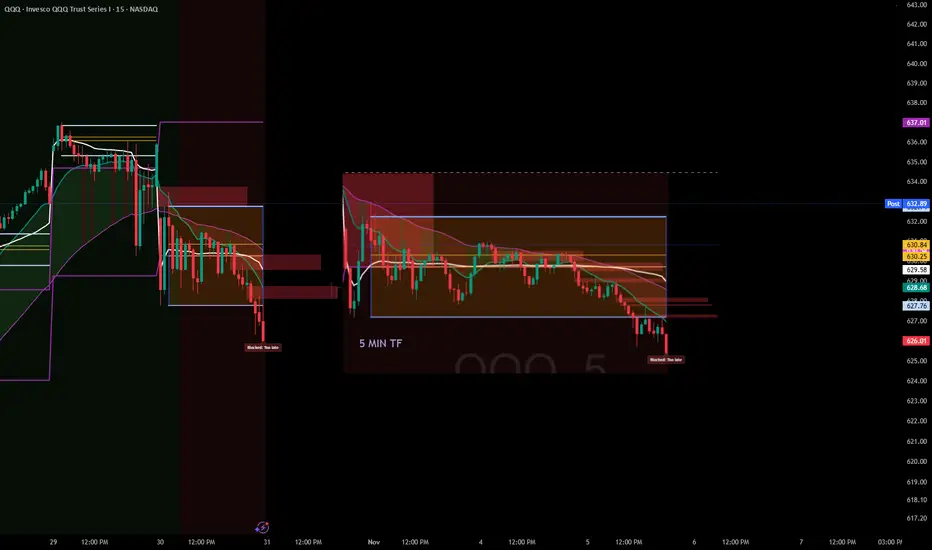
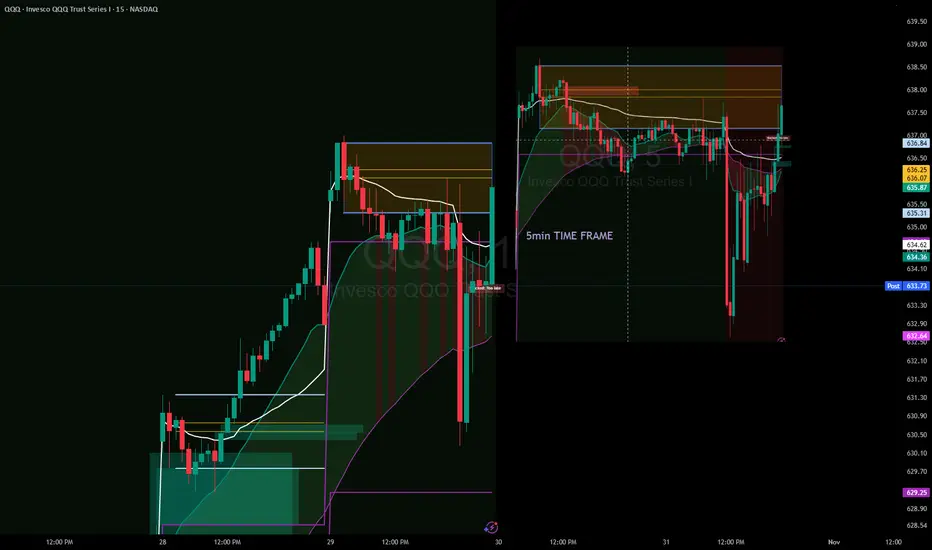
1. I attached the 5min chart to show you what the " Golden Pocket " of my indicator resembles.
A confirmation of price action and direction.
It reacted perfectly. 10:15am Bear candle - 10:20am Bull Doji inside pocket - 10:30am Engulfing Bull candle with a long signal! You couldn't ask for a better set up to the upside to make your money!
2. The 15min time frame was a little more of a bulky solid read. Bull candles with wicks.
The 10:15am candle carried the long signal with it. The wick within that candle was our 5min candles playing out.
Weather you waited for the 15min plays or you entered in the 5mins. You won.
3. So, with all this, there is another indicator I play. That is my 0dte Context bundle. How this works in our favor is that in this specific situation you want to make sure your trends are moving where they need to go. The EMA, SMA and VWAP lines all had same up direction. The Green EMA/SMA Cloud all indicated up is where it's going.
You have the tools to assist in decisions. If you need more help with reading these indicators. Let me know. I'm always down to help out.
Patient is still key. Confirmations are still key. Remember that when trading. Do not get antsy and enter in trades that are not strong or that will not check all your entry boxes.
Thank you again for the follows and the support. I hope these are helpful.
God Bless,
Trades with B!

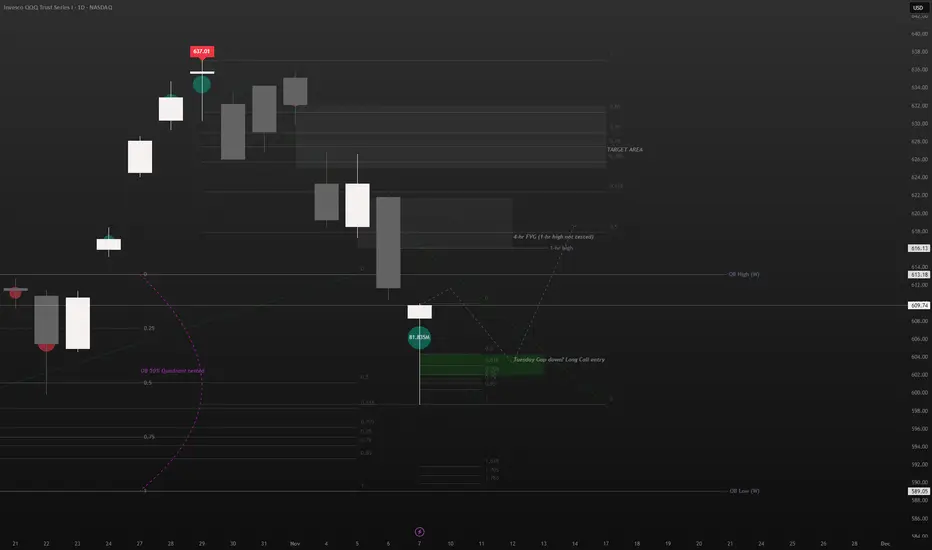
QQQ (Long idea)Lots of things going on here (haha).
1. This week we closed with a bullish hammer on daily after testing the inside 50% quadrant of the weekly OB candle.
- Good support shows strength back to the upside.
- I want to see a gap down Tuesday into the green area for calls.
2. Don't get the long idea twisted, I am still temporarily bearish.
- I am long back up to the 4-hr FVG, looking at a 1-hr high sweep. After this I am watching for continued downside.
- A push past the 4-hr FVG indicates bullishness and my target changes to .705 of the fibs.
3. If the 4-hr FVG fails, then my target becomes the OB low on weekly.
FULL REVIEW 8-11-25 BEARISH REVERSAL TREND IN THE STOCK MARKET?TOP BEARISH REVERSAL SIGNAL IN THE STOCK MARKET?
Stock market overview.
On all the larger timeframes, everything on my watchlist is in a BULLISH TREND. On Daily market in bearish reversal signal.
The RSI is overbought and has negative divergence, indicating a likely downside reversal.
My watchlist: #gold #dxy #qqq #spx #vix #dia #iwm #appl #tsla #nvda #msft #amzn #googl #meta
Thanks for the likes and comments!
Good luck to everyone!

QQQ : Stay heavy on positionsQQQ : Stay heavy on positions (QLD, TQQQ)
Entering a risk-on, high-volatility zone.
A signal for catching a bounce has emerged.
In stay light on positions zones, I hold QQQ and reduce exposure.
In stay heavy on positions zones, I increase allocation using a mix of QLD and TQQQ.
** This analysis is based solely on the quantification of crowd psychology.
It does not incorporate price action, trading volume, or macroeconomic indicators.

QQQ: Runaway or Exhaustion Gap?QQQ just printed a strong bullish gap on the daily chart, but context suggests caution. With widening SOFR spreads signaling a dollar funding shortage, this move may represent an exhaustion gap rather than a continuation breakout.
Runaway Gap Characteristics
Mid-trend breakout with moderate volume
Price holds above the gap for several sessions
Liquidity and macro conditions remain supportive
Exhaustion Gap Characteristics
Occurs after an extended trend
Large gap accompanied by a volume spike
Fails to hold above the gap and quickly reverses
Macro Context
SOFR–OIS spreads are widening, pointing to tightening dollar liquidity.
Similar conditions in Q4 2018 and February 2020 preceded major reversals in QQQ as funding stress reduced leverage and weakened follow-through in risk assets.
Current Read
Estimated odds: 35 percent runaway, 65 percent exhaustion.
A close below the gap low or a rapid fill within a few sessions confirms exhaustion.
Sustained price strength on steady volume favors continuation.
What to Watch
SOFR–OIS spread trend next week
Dollar index strength and its correlation with QQQ
Volume and RSI behavior near the gap zone
Bottom line:
This gap looks bullish on the surface, but underlying liquidity stress could turn it into a final pop before a corrective phase. Monitor liquidity data before assuming a continuation.

Some notes to reflect on. A little how to for the indicatorHey everyone,
Hope you guys & gals are doing well using these indicators. I'm publishing a chart that I wrote some notes for. Notes are offering some insight on what look for when using this indicator. If you have any questions, let me know. I am planning to get videos up soon when I get some extra free time.
Thank you again for the support!
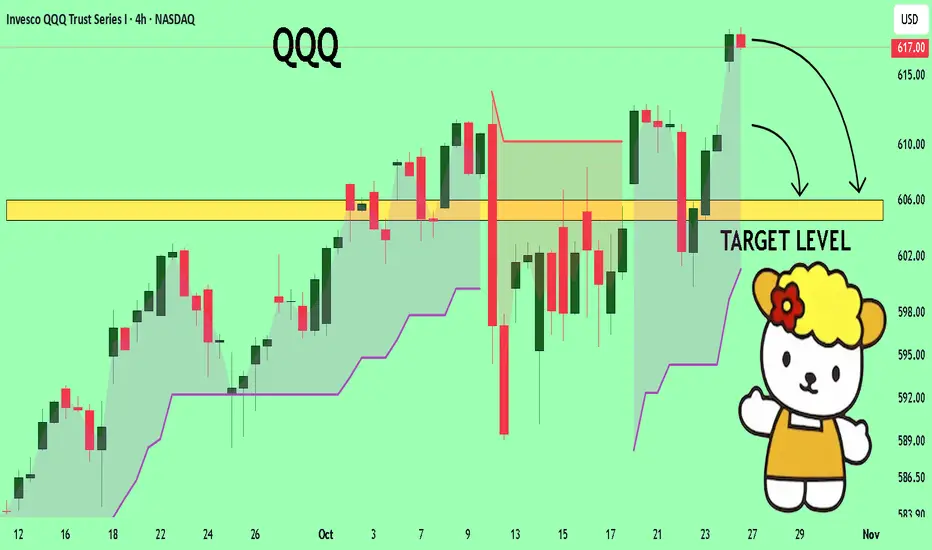
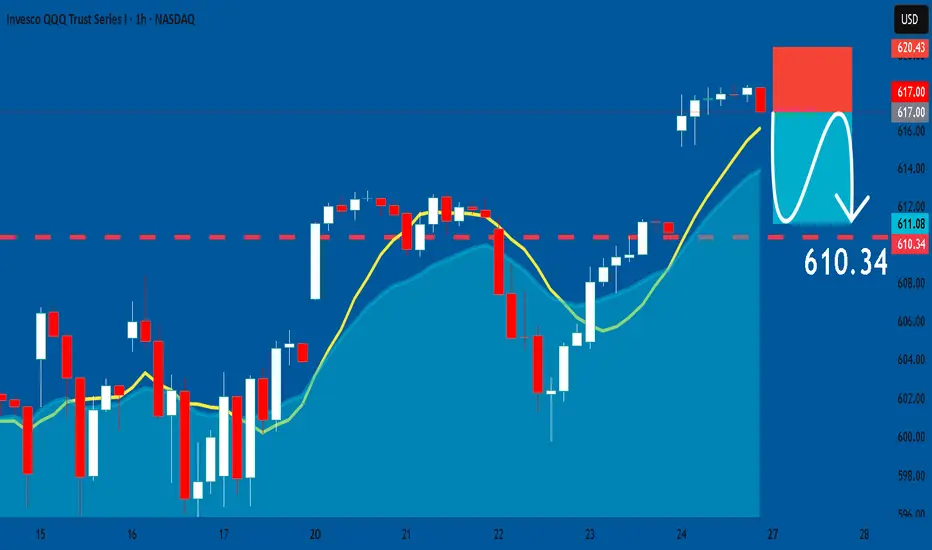
QQQ: Short Trading Opportunity
QQQ
- Classic bearish formation
- Our team expects fall
SUGGESTED TRADE:
Swing Trade
Sell QQQ
Entry Level - 617.00
Sl -620.43
Tp - 610.34
Our Risk - 1%
Start protection of your profits from lower levels
Disclosure: I am part of Trade Nation's Influencer program and receive a monthly fee for using their TradingView charts in my analysis.
❤️ Please, support our work with like & comment! ❤️
Developed Market and Emerging MarketIntroduction
The global economy is an interconnected network of nations at different stages of economic development. These stages are generally categorized into developed markets, emerging markets, and frontier markets. Among them, developed and emerging markets play the most significant roles in shaping international trade, investment flows, and financial stability. Understanding these two categories is essential for investors, policymakers, and economists who analyze global financial dynamics, risk profiles, and growth opportunities.
Developed markets represent mature, advanced economies with strong industrial bases, high income per capita, and stable political systems. Emerging markets, on the other hand, are countries in the process of industrialization and modernization, showing rapid growth but also facing economic volatility and structural challenges. This distinction helps investors gauge risk, return potential, and diversification strategies in global portfolios.
1. Definition and Concept
Developed Market
A developed market (also known as an advanced or mature market) refers to a country with a highly industrialized economy, well-established financial systems, and high living standards. These nations have robust infrastructure, sophisticated regulatory frameworks, and stable political environments that promote predictable business operations. Their economic activities are primarily driven by services and advanced manufacturing rather than agriculture or basic industries.
International organizations such as the International Monetary Fund (IMF), World Bank, and United Nations classify developed markets based on indicators like:
Gross Domestic Product (GDP) per capita
Human Development Index (HDI)
Financial market sophistication
Industrial diversification
Institutional strength and governance quality
Examples of developed markets include:
United States
Canada
United Kingdom
Germany
France
Japan
Australia
South Korea
Switzerland
These economies form the backbone of global financial systems and often host major stock exchanges such as the NYSE, NASDAQ, London Stock Exchange, and Tokyo Stock Exchange.
Emerging Market
An emerging market is a nation transitioning from a developing to a developed economy. These countries experience rapid industrialization, urbanization, and integration into the global economy, leading to substantial growth potential. However, they also face higher risks, including political instability, inflation volatility, and weaker institutional frameworks.
The term "emerging market" was popularized by economist Antoine van Agtmael in the 1980s to describe countries with growing capital markets that were becoming attractive to foreign investors.
Criteria defining emerging markets include:
Moderate to high GDP growth rates
Expanding middle class
Increasing foreign investment
Developing infrastructure and technology
Improving governance and market reforms
Prominent emerging markets include:
China
India
Brazil
Russia
Mexico
Indonesia
South Africa
Turkey
Thailand
These countries often form part of groupings such as BRICS (Brazil, Russia, India, China, South Africa) or MINT (Mexico, Indonesia, Nigeria, Turkey).
2. Key Characteristics
Developed Markets
High Income Levels:
Developed economies have high GDP per capita, reflecting widespread wealth and purchasing power. For example, countries like the U.S. and Switzerland boast per capita incomes exceeding $60,000 annually.
Mature Financial Systems:
Their banking systems, capital markets, and insurance sectors are well-established and transparent, governed by strong regulatory frameworks.
Low Political and Economic Risk:
Stable governments, rule of law, and consistent economic policies create confidence among investors.
Advanced Infrastructure:
Efficient transportation, communication, and energy networks support productivity and competitiveness.
Technological Leadership:
Developed nations are at the forefront of innovation in industries such as IT, biotechnology, and renewable energy.
Stable Currency and Inflation:
Their central banks, such as the U.S. Federal Reserve or the European Central Bank, maintain price stability and sound monetary policy.
Emerging Markets
High Growth Potential:
Emerging economies often record faster GDP growth, sometimes exceeding 5–8% annually, driven by industrialization and rising domestic consumption.
Expanding Middle Class:
Economic development leads to a growing middle-income population, which boosts demand for goods, housing, and financial services.
Reform-Driven Economies:
Structural reforms, such as privatization and liberalization, make these markets more attractive to foreign investors.
Developing Financial Systems:
Their capital markets are growing but may still lack depth, transparency, and liquidity compared to developed markets.
Currency and Political Volatility:
Exchange rates and government policies can fluctuate significantly, affecting investor confidence.
Urbanization and Industrialization:
Rapid city expansion and manufacturing growth drive job creation and export competitiveness.
3. Economic Indicators Comparison
Indicator Developed Markets Emerging Markets
GDP per capita High (> $40,000) Moderate ($5,000–$20,000)
Growth rate Moderate (1–3%) High (4–8%)
Inflation Low and stable Moderate to high
Infrastructure Advanced Developing
Political stability Strong Varies widely
Currency stability High Often volatile
Industrial base Services and high-tech Manufacturing and agriculture
Income inequality Relatively low Often high
Financial markets Deep and liquid Expanding but less liquid
4. Role in Global Economy
Developed Markets’ Role
Developed economies act as the anchors of global finance and trade. They host the largest multinational corporations, reserve currencies, and financial hubs. The U.S. dollar, euro, and yen serve as international mediums of exchange, influencing global monetary policy. Their advanced financial systems provide capital to the rest of the world through foreign direct investments (FDI) and institutional funds.
They also drive technological innovation and research & development, setting global standards in production and governance. Developed markets’ consumer demand fuels global exports from emerging and developing nations, linking their prosperity to world trade flows.
Emerging Markets’ Role
Emerging economies represent the engine of global growth in the 21st century. They contribute a significant share of global GDP expansion due to large populations, rapid industrialization, and consumption growth. For instance, China and India alone account for over one-third of global economic growth.
They are crucial suppliers of raw materials, manufactured goods, and increasingly digital services. Moreover, they offer investment diversification opportunities, as their growth cycles may differ from developed economies. Emerging markets also play an essential role in addressing global challenges such as energy demand, environmental sustainability, and digital transformation.
5. Investment Perspective
From an investment standpoint, both developed and emerging markets present distinct risk-reward profiles.
Developed Market Investments
Investing in developed economies offers stability, transparency, and lower risk. Their stock markets are highly liquid and regulated, making them ideal for long-term investors seeking steady returns. However, growth opportunities may be limited because of market maturity and slower GDP expansion.
Common investment vehicles include:
Blue-chip equities (e.g., Apple, Microsoft, Nestlé)
Government bonds (e.g., U.S. Treasuries)
Index funds tracking major benchmarks (e.g., S&P 500, FTSE 100)
Emerging Market Investments
Emerging markets provide higher growth potential but also higher volatility. Investors are attracted to the potential for strong returns from sectors like infrastructure, consumer goods, and technology. However, risks include political instability, currency depreciation, and weaker governance.
Investment opportunities include:
Local equities and bonds
Exchange-traded funds (ETFs) tracking emerging indices (e.g., MSCI Emerging Markets Index)
Direct investment in infrastructure or start-ups
Diversifying portfolios across both markets helps balance stability and growth potential.
6. Challenges Faced by Each Market Type
Challenges in Developed Markets
Slow Growth:
Mature economies experience limited GDP expansion due to market saturation and aging populations.
High Debt Levels:
Many developed nations carry large public debts, creating fiscal pressures.
Technological Disruption:
Automation and AI may lead to job displacement and inequality.
Geopolitical Risks:
Trade disputes and policy shifts (e.g., Brexit, U.S.–China tensions) can affect global stability.
Challenges in Emerging Markets
Political Instability:
Government changes and weak institutions can disrupt economic policy.
Inflation and Currency Risk:
Volatile exchange rates can deter foreign investment.
Dependence on Commodities:
Many emerging economies rely heavily on exports like oil or minerals, making them vulnerable to price swings.
Infrastructure Deficits:
Inadequate roads, power supply, and communication networks limit industrial efficiency.
Capital Flight:
When global interest rates rise, investors often withdraw funds from riskier emerging markets.
7. Interdependence Between Developed and Emerging Markets
Globalization has woven developed and emerging markets into a mutually dependent economic fabric. Developed nations invest heavily in emerging markets for higher returns and resource access, while emerging markets rely on developed economies for technology, capital, and demand.
For example:
U.S. and European companies outsource manufacturing to Asia to reduce costs.
China and India import advanced machinery and software from developed countries.
Financial crises or interest rate changes in the U.S. can ripple across emerging economies.
Thus, while they differ in structure and stability, both market types are interlinked in global trade, investment, and policy networks.
8. The Future Outlook
The future of global growth is expected to be driven increasingly by emerging markets. By 2050, countries like China, India, and Indonesia are projected to become the world’s largest economies in purchasing power parity (PPP) terms. Their rising consumer bases, technological adoption, and urbanization will reshape global demand patterns.
However, developed markets will continue to dominate in innovation, finance, and governance standards. They will serve as models of economic stability and sustainability, influencing the global economic architecture through institutions such as the IMF, World Bank, and G7.
The key to a balanced global economy lies in cooperation between developed and emerging markets, focusing on trade fairness, technology transfer, and sustainable development.
Conclusion
Developed and emerging markets represent two distinct yet complementary pillars of the global economic system. Developed markets embody stability, efficiency, and innovation, while emerging markets offer dynamism, growth, and transformation. Together, they shape the rhythm of global finance, trade, and investment.
For investors and policymakers alike, understanding the interplay between these markets is crucial. Developed economies provide safe, predictable environments for steady returns, whereas emerging markets offer the promise of high growth with commensurate risks. As globalization deepens and digital technologies blur traditional boundaries, the collaboration and balance between these two market categories will define the future of global prosperity.
QQQ : Stay heavy on positionsQQQ : Stay heavy on positions (QLD, TQQQ)
Entering a risk-on, high-volatility zone.
In stay light on positions zones, I hold QQQ and reduce exposure.
In stay heavy on positions zones, I increase allocation using a mix of QLD and TQQQ.
** This analysis is based solely on the quantification of crowd psychology.
It does not incorporate price action, trading volume, or macroeconomic indicators.

QQQ (24 October)QQQ is at the top of its 20d ±3 % envelope, a “momentum, but stretched” setup
Expect minor cooling or sideways action early next week, then potential continuation toward $625-$628 once the moving average catches up
20d MA ~$605 is upward-sloping which confirms a healthy intermediate uptrend
Envelope width is about 36 points (~6%), normal for a trending QQQ environment
Price hugging the upper envelope means momentum is strong, but stretched
In past rallies, when QQQ closed near or slightly above the +3 % band, it tended to consolidate or pull back toward the MA within 3-6 sessions, or trade sideways until the moving average "catches up"
Since May, you can see about 4-5 touches of the upper band
Each touch was followed by a 1-2 % fade lasting a few sessions
The moving average acted as dynamic support; deeper corrections only came after the slope flattened
That rhythm is still intact so this looks like another case where bulls may pause, but not reverse
$618-$620
Upper envelope resistance/overbought
55% chance of stall or mild fade
$610-$612
First support (mean reversion)
30 % chance of retest
$600-$605
20d MA & lower-band base
15 % chance unless news shock
Bias is still bullish; trend intact above the 20d MA, but short-term is slightly overbought so expect digestion rather than acceleration
Taking partial profits or tightening stops near +3% band often pays better than chasing new highs
Theta decay accelerates if price chops sideways here, so shorter-dated calls can flatten out quickly
Waiting for a dip toward $610-$612 offers a higher-reward entry aligned with the 20d MA
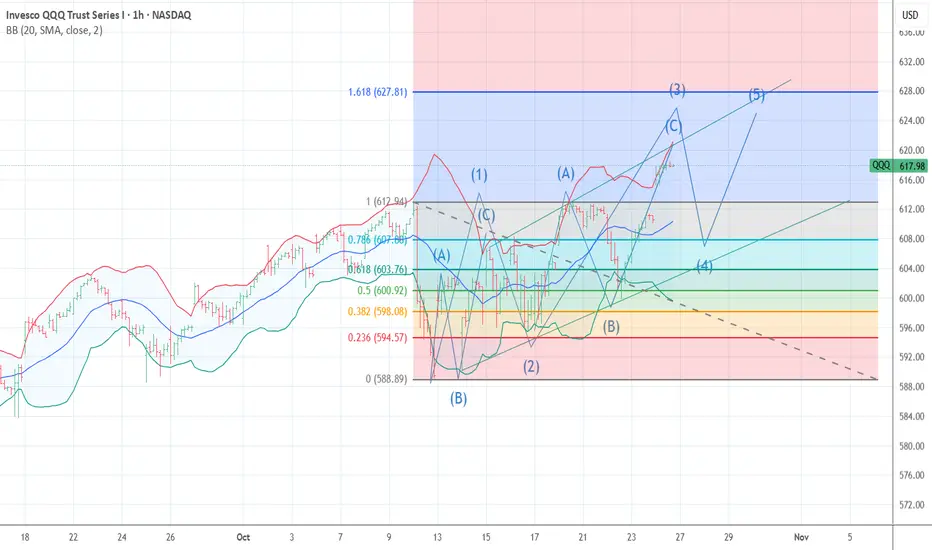
QQQ My view of the ending Diagonal 5the wave forming The chart posted below is my top QQQ count .I see us forming wave c of 3 up We should now see a down and up to new highs next week to end the 5 wave up to then see another decline to begin .Have a great weekend Best of trades WAVETIMER
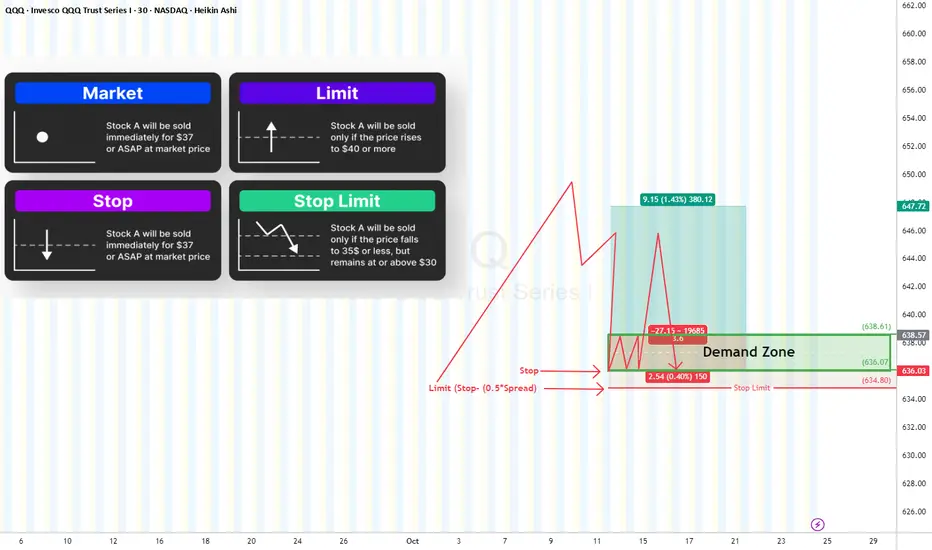
Why My Stop Loss Didn’t Trigger?”🛑 “Why My Stop Loss Didn’t Trigger?”
Let’s talk about Stop Orders, Stop Limits, Spreads, and the Outside-RTH trap.
Before we blame the broker, it’s crucial to understand how each order type actually works:
🔹 Market Order
Executes immediately at the best available price.
✅ Guarantees execution
⚠️ Doesn’t guarantee price (can slip during volatility).
🔹 Limit Order
Executes only at your specified price or better.
✅ Price control
⚠️ Might never fill if market doesn’t reach your limit or gap down.
🔹 Stop Order (Is a Stop “Market” Order)
Activates when price hits your stop level, then converts into a market order.
✅ Great for stop-loss protection
⚠️ May fill at much lower price than your stop due to slippage.
🔹 Stop Limit Order
Activates at the stop trigger, then becomes a limit order — meaning it only executes if the market trades at your limit price or better.
✅ Full control over fill price
⚠️ Risk of not executing at all if price moves away quickly.
Regular Trading Hours (RTH):
Market orders are supported → Stop Market
Outside RTH (Pre/Post-market):
Market orders are not supported therefore, only Stop Limit works.
Now, Why Your Stop Might Not Trigger?
1- You used a Stop-Limit (not Stop Market)
If the market gaps beyond your limit, there’s no fill (Buyer) at this price.
Price “touched” your stop — but never traded through your limit price.
2- You traded Outside RTH
During pre-market or after-hours, If you didn’t enable “Outside RTH” trading, your stop simply didn’t activate.
3- Thin Liquidity
Low volume = fewer buyers/sellers near your stop → delayed or partial fills.
This is especially true Outside RTH, where spreads widen and depth disappears. Or you are trading an equity or ETFs with slim volume (check the volume first before trading any asset)
✅ Recommendation:
Use Stop-Limit + “Allow Outside RTH+GTC” and make your limit “marketable” to ensure execution.
Offset guide for Stop-Limits (Δ):
• At least 0.5× spread
• Or ¼ to ½ ATR(5) for your timeframe
Example for a long position:
• You bought at $100, want to exit if it breaks $99.80.
• Pre-market spread = $0.12
• Set: Stop = 99.80, Limit = 99.68 (≈0.12 below stop)
→ Gives room for spread expansion and slippage so the stop fills quickly.
How to Set a Reliable Stop-Limit
Market Order Type Settings Notes
Equities & ETFS (RTH) Stop Market Standard stop Fastest execution
Equities & ETFS (Outside RTH) Stop Limit + GTC Limit offset = Spread Needed for after-hours fills
Futures / FX / Crypto Stop Market 24h trading Market fills OK
The Best Setup
✅ Inside RTH → Stop Market (guaranteed execution)
✅ Outside RTH → Stop Limit + GTC enabled with marketable offset
✅ Always give buffer beyond supply/demand levels (0.1–0.3%)
✅ Watch spread and volume before placing stops
Final Takeaway
Your stop loss isn’t just a line on the chart — it’s an engineered safety net.
Use the right order type for the session, give it breathing room, and understand how spread, liquidity, and RTH rules impact execution.
Because a stop loss that doesn’t trigger… isn’t a stop loss at all. 🛑
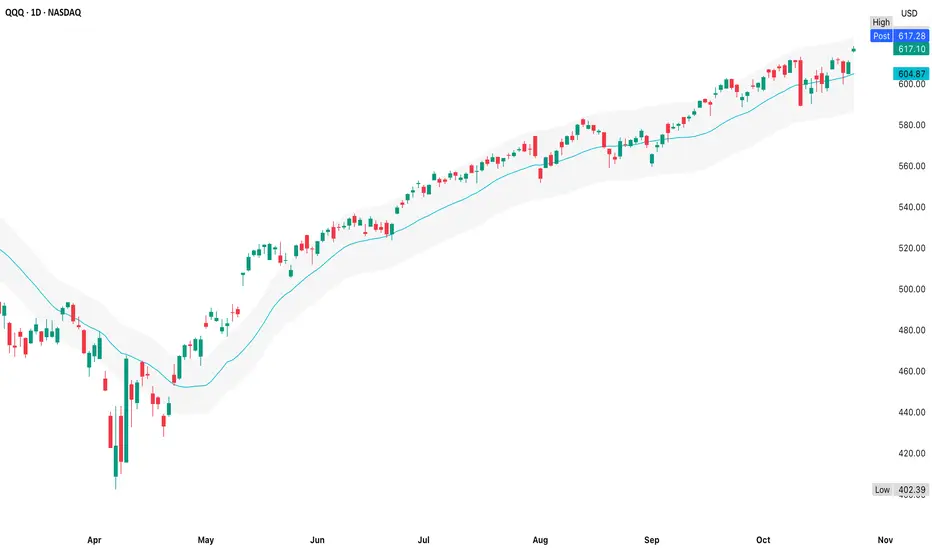
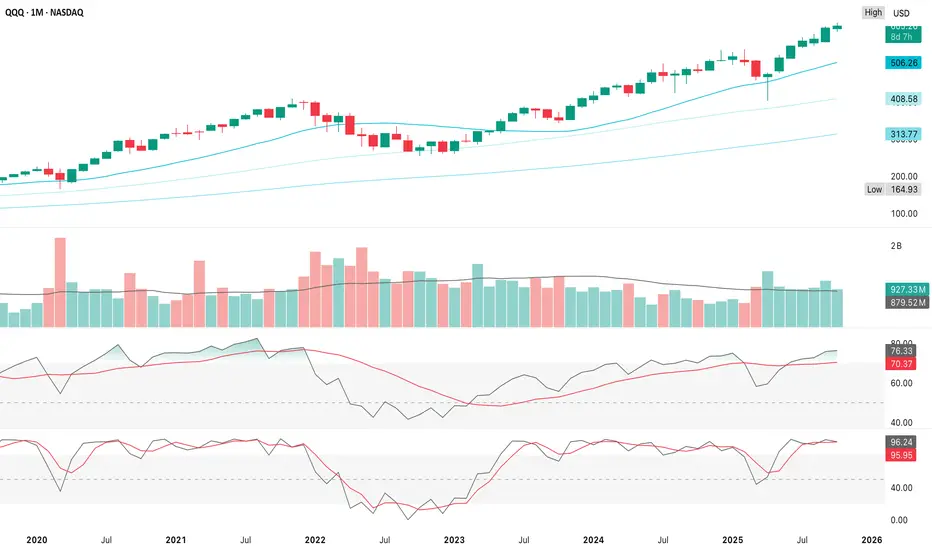
QQQ Cooling PhaseThe monthly candles show a secular uptrend
Price remains well above the 20, 50 & 100 month moving averages
Even with the short-term volatility we’ve seen around $603-$613, that’s just noise inside a steep upward channel
Big-picture momentum is still firmly bullish
Intraday price range are temporary mean-reversions inside an ongoing trend
The long-term “fuel” is still there, but risk-reward for new longer-term entries is thinning, so a multi-month consolidation or modest correction wouldn’t be unusual
RSI ≈ 76 is solidly overbought, but not diverging yet - typical of strong late-cycle trends
When RSI stays above 70 for months, it signals strength, not necessarily exhaustion
Stochastic ≈ 96 is extremely stretched which is often where monthly pullbacks (5–10%) - it can stay pinned for months before reversing
Volume has drifted lower since 2022, which hints that participation has narrowed to the mega-caps
That aligns with what we’re seeing day-to-day with QQQE (equal-weight) lagging, concentrated leadership from the largest names
1. Continued grind higher
If earnings/CPI stay supportive, QQQ could extend toward $630-$640 before serious resistance - hold above $600
2. Healthy correction
A 5-8% dip to $570-$580 would reset momentum without breaking trend
Support at 20 month MA (~$505) if deeper
3. Trend failure
Only a sustained break below $500-$505 would turn the monthly chart bearish
100 month MA near $314 = long-term floor
The monthly chart shows QQQ in a mature but intact bull trend with momentum hot, volume thinning, room for a 5-10% reset without real technical damage
For day-to-day trading, expect more mean-reversion around $600-$620 until volatility events pass
Long bias remains justified while price is above the 20 month MA
Intraday fades & pullbacks are tactical only - they’re counter-trend, not trend reversals
Watch IV + macro catalysts since spikes in implied volatility (earnings/CPI) often create those short-term pullbacks without changing the monthly structure
Feb-Mar 2020
RSI > 75
Stoch > 95
–12 %
1 month COVID crash (black-swan, outsized)
Nov 2021-Jan 2022
RSI ≈ 77
Stoch ≈ 96
–10 %
2 months
Rate-hike scare, peak valuation
Aug 2023-Oct 2023
RSI ≈ 74
Stoch ≈ 94
–7 %
2 months
Bond-yield spike/earnings reset
Apr 2024-May 2024
RSI ≈ 76
Stoch ≈ 97
–6 %
1 month
Macro pause, then continuation
-5% to -8% lasting 1-2 months while the long-term uptrend stays intact
Current price ≈ $604
–5 % ≈ $573
Minor swing-low support (Aug 2024 area)
–7 % ≈ $562
Volume-weighted support/10 month MA
–10 % ≈ $543
2024 high retest, deeper but still trend-safe
That $560-$575 area would relieve monthly overbought conditions without threatening the secular trend
1. RSI divergence on the weekly chart (lower high while price makes a higher high)
Weekly close below $600 confirms cooling momentum
VXN (Nasdaq Volatility Index) >20 shows volatility expansion accompanying the fade
Volume expansion on red candles after CPI/Fed events
2. RSI falls back toward 60-65 on the monthly
Price stabilizes near the 20 week or 50d MA (roughly $575-$585)
IV compresses again in a new accumulation phase/continuation toward prior highs
🧭 Summary
Historical overbought phases in QQQ resolve with a –5% to –8% dip over 1-2 months,
usually bottoming around $560-$575, then resuming the larger bull trend
Anything beyond –10 % would signal a regime change rather than a standard reset
QQQ Ready to CollapseReasons the stock market could fall today:
Government shutdown fears creating uncertainty and GDP drag
White House instability after East Wing destruction shaking political confidence
Rising China tensions and supply chain disruption fears
New or expanded tariffs increasing costs and squeezing margins
Inflation pressures staying elevated despite weak growth
Stagflation worries combining slow growth with high prices
Investor sentiment turning risk-off amid multiple uncertainties
Corporate earnings at risk from weaker demand and higher input costs
Global contagion from China or Europe worsening growth outlook
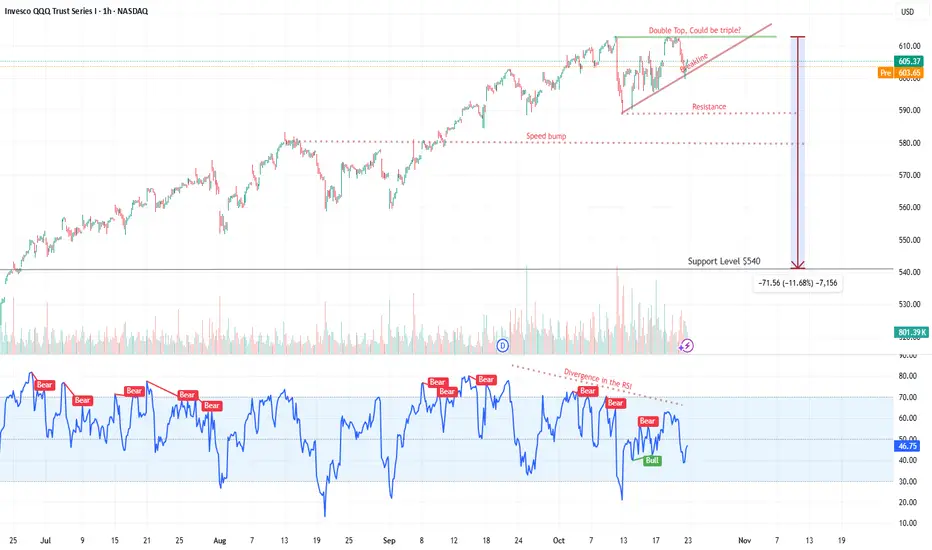
Bull Losing Strength after Six Months of GainsWe may have a double or triple top before breaking down and having a 10% correction. Prior resistance post-election was $540 and the market blew through that level since April without stopping. Should be a support level.
