Global Financial Markets and Their StructureIntroduction
The global financial market represents the interconnected network of institutions, systems, and instruments through which money and capital flow across borders. It forms the backbone of the world economy, enabling governments, corporations, and individuals to raise capital, invest, trade currencies, and manage risks. With globalization, technological innovation, and liberalization, financial markets have become increasingly integrated, influencing economic growth, monetary policy, and international relations. Understanding the structure of global financial markets is essential to grasp how capital is allocated worldwide and how financial stability is maintained.
1. Concept of Global Financial Markets
A financial market is a platform where buyers and sellers engage in the trade of financial assets such as equities, bonds, currencies, and derivatives. When these markets operate across countries and connect multiple economies, they form what is known as the global financial market.
In essence, the global financial market:
Facilitates the flow of funds from surplus units (savers) to deficit units (borrowers).
Provides a mechanism for price discovery and risk management.
Enhances liquidity, enabling participants to easily buy and sell assets.
Plays a crucial role in economic growth, investment, and stability.
The global market is not a single entity but a network of interconnected markets functioning through institutions such as banks, stock exchanges, hedge funds, insurance companies, and central banks. Modern communication technology, digital trading platforms, and financial integration have turned it into a real-time, 24-hour global system.
2. Structure of the Global Financial Market
The structure of the global financial market can be broadly categorized into several interrelated segments:
Money Market
Capital Market
Foreign Exchange Market
Derivative Market
Commodity Market
Insurance and Pension Market
Each segment serves a distinct purpose, yet all are interlinked and essential to the smooth functioning of the global economy.
3. The Money Market
The money market deals with short-term funds and financial instruments with high liquidity and short maturities, typically less than one year. It provides a means for governments, financial institutions, and corporations to manage short-term funding needs and liquidity.
Key Instruments
Treasury Bills (T-Bills)
Certificates of Deposit (CDs)
Commercial Papers (CPs)
Repurchase Agreements (Repos)
Bankers’ Acceptances
Major Participants
Central Banks (e.g., Federal Reserve, European Central Bank, Reserve Bank of India)
Commercial Banks
Financial Institutions
Corporations
Money Market Mutual Funds
Role in the Economy
The money market stabilizes short-term interest rates, supports monetary policy operations, and ensures liquidity in the financial system. It acts as the link between the banking system and capital markets, influencing credit flow and investment activity.
4. The Capital Market
The capital market is where long-term securities, such as stocks and bonds, are issued and traded. It enables corporations and governments to raise long-term funds for development and expansion.
Subdivisions
Primary Market: Where new securities are issued (Initial Public Offerings or IPOs).
Secondary Market: Where existing securities are traded (Stock Exchanges like NYSE, NASDAQ, LSE, BSE, NSE).
Key Instruments
Equity Shares
Corporate Bonds
Government Securities
Debentures
Mutual Funds
Exchange-Traded Funds (ETFs)
Major Participants
Institutional Investors (pension funds, insurance companies)
Retail Investors
Investment Banks
Stock Exchanges
Regulators (like SEC in the U.S. or SEBI in India)
Importance
The capital market promotes economic development by mobilizing long-term savings into productive investments. It ensures efficient capital allocation, wealth creation, and corporate governance through market discipline.
5. The Foreign Exchange (Forex) Market
The foreign exchange market is the largest financial market in the world, with daily transactions exceeding $7 trillion. It facilitates the exchange of one currency for another, supporting international trade, investment, and tourism.
Structure
Spot Market: Immediate currency transactions.
Forward Market: Agreements to exchange currencies at a future date.
Swap Market: Simultaneous purchase and sale of currencies for different maturities.
Major Participants
Central Banks
Commercial Banks
Multinational Corporations
Hedge Funds
Currency Traders and Brokers
Functions
Enables global trade and investment by providing currency convertibility.
Determines exchange rates through supply and demand.
Facilitates hedging against currency risk.
The forex market operates 24 hours a day due to overlapping time zones, making it a truly global and decentralized market.
6. The Derivative Market
The derivatives market deals with financial instruments whose value derives from underlying assets such as stocks, bonds, currencies, interest rates, or commodities.
Common Derivative Instruments
Futures
Options
Swaps
Forwards
Purpose
Derivatives allow investors and corporations to hedge against risks such as fluctuations in interest rates, exchange rates, and commodity prices. They also provide opportunities for speculative gains and portfolio diversification.
Examples
Interest Rate Swaps (used by banks)
Currency Options (used by exporters/importers)
Stock Index Futures (used by institutional investors)
The derivative market is an essential part of the global financial system, enhancing liquidity and risk management, though excessive speculation can contribute to systemic risk—as seen in the 2008 global financial crisis.
7. The Commodity Market
The commodity market facilitates trade in raw materials and primary products. It includes both physical trading and derivative contracts based on commodity prices.
Types of Commodities
Hard Commodities: Metals, oil, natural gas.
Soft Commodities: Agricultural products like wheat, coffee, and cotton.
Major Commodity Exchanges
Chicago Mercantile Exchange (CME)
London Metal Exchange (LME)
Multi Commodity Exchange (MCX, India)
New York Mercantile Exchange (NYMEX)
Role
Commodity markets allow producers and consumers to hedge against price fluctuations, promote transparency in pricing, and support global trade and industrial production.
8. Insurance and Pension Market
The insurance and pension market plays a stabilizing role in the global financial system by pooling and redistributing risks. Insurance companies and pension funds are major institutional investors in capital and bond markets.
Functions
Provide financial protection against unforeseen losses.
Accumulate long-term savings for retirement.
Channel funds into productive investments through capital markets.
Importance
These markets support long-term financial stability, complementing government welfare systems and reducing the economic impact of uncertainties.
9. Key Global Financial Institutions
The functioning and regulation of global financial markets rely heavily on international and national institutions.
Major Global Institutions
International Monetary Fund (IMF): Ensures global monetary stability, offers financial assistance to countries in crisis.
World Bank: Provides long-term loans and support for economic development.
Bank for International Settlements (BIS): Coordinates among central banks and promotes financial stability.
Financial Stability Board (FSB): Monitors and makes recommendations for global financial regulation.
Regional Development Banks: Such as the Asian Development Bank (ADB) and African Development Bank (AfDB).
National Regulators
U.S.: Securities and Exchange Commission (SEC)
U.K.: Financial Conduct Authority (FCA)
India: Securities and Exchange Board of India (SEBI)
Japan: Financial Services Agency (FSA)
These institutions promote transparency, protect investors, and maintain confidence in the financial system.
10. Global Financial Integration
Over the last few decades, financial globalization has deepened the interconnections between markets. Capital moves freely across borders, driven by liberalization policies, technology, and innovation.
Benefits of Integration
Greater access to capital for developing economies.
Efficient resource allocation.
Risk diversification for investors.
Lower cost of borrowing.
Risks
Contagion effect of financial crises.
Increased volatility and speculative capital flows.
Exposure to global shocks (e.g., 2008 crisis, COVID-19 market crash).
Therefore, effective global coordination and regulatory oversight are essential to balance the benefits of financial integration with the risks of instability.
11. Technological Transformation of Financial Markets
Technological innovation has revolutionized global financial markets:
Algorithmic Trading enables high-speed, automated trading.
Blockchain Technology enhances transparency and reduces transaction costs.
Fintech companies offer digital banking, peer-to-peer lending, and robo-advisory services.
Cryptocurrencies like Bitcoin have introduced decentralized finance (DeFi), challenging traditional systems.
These developments have made markets more accessible and efficient but also raised concerns about cybersecurity, regulatory gaps, and market manipulation.
12. Challenges in Global Financial Markets
Despite progress, the global financial system faces several challenges:
Systemic Risk: Interconnectedness can amplify crises.
Regulatory Arbitrage: Differences in national regulations create loopholes.
Market Volatility: Geopolitical tensions and policy shifts cause price instability.
Climate Finance: Need for green investments to support sustainable growth.
Digital Disruption: Balancing innovation with investor protection.
Addressing these challenges requires coordinated global governance and adaptive policy frameworks.
13. The Role of Emerging Markets
Emerging economies like India, China, Brazil, and Indonesia play a growing role in the global financial system. They attract foreign capital, develop strong financial institutions, and influence commodity and currency markets.
Their inclusion in global indices and financial reforms has diversified global portfolios and increased market depth. However, they remain vulnerable to capital flight, exchange rate shocks, and global interest rate changes.
Conclusion
The global financial market is a dynamic, complex system that channels capital across borders, drives economic growth, and fosters innovation. Its structure—comprising money, capital, forex, derivative, commodity, and insurance markets—forms a cohesive yet intricate network of interdependent segments. Financial institutions, both domestic and international, ensure the system’s stability and transparency.
While globalization and technology have enhanced efficiency and accessibility, they have also introduced new risks that demand vigilant regulation and international cooperation. In the 21st century, the resilience and adaptability of the global financial market will determine not only the prosperity of nations but also the stability of the global economy itself.
Trade ideas
$QQQ Tomorrow's Trading Range for 10.22.25
What are we thinking here? ATH's were clearly a resistance after mondays gap up, and we consolidated back to the 35EMA. That upgap from monday is looking like a good target.

$QQQ Tomorrow’s Trading Range 10.21.25 NASDAQ:QQQ Tomorrow’s Trading Range 10.21.25
Alway’s know where your 35EMA is. It is underneath the implied move right now, which means tomorrow has a high probability of being flat or down. ATH’s are in tomorrow’s range above us, and 35EMA underneath us with that 30min 200 and also the bull gap from open as well… let’s go…
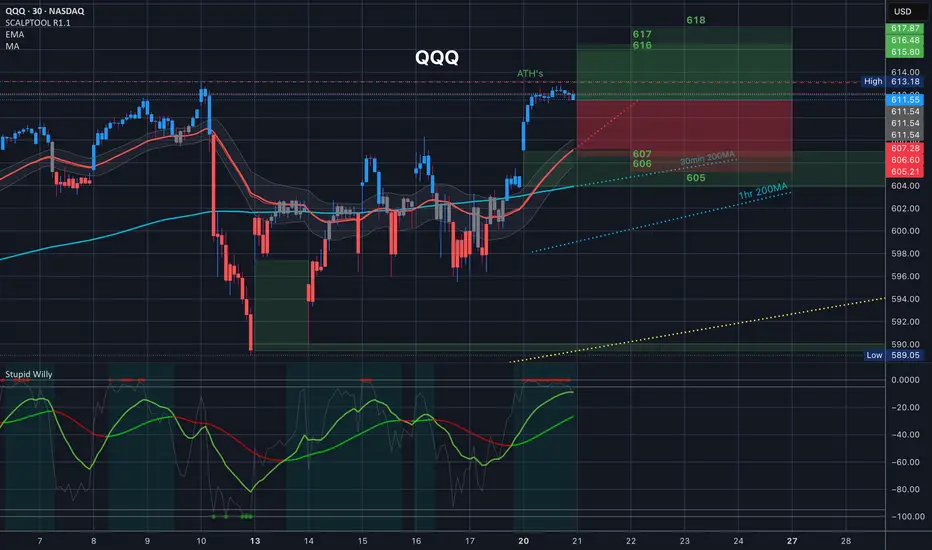
QQQ Weekly Outlook (Oct 21–25): Bulls Defend the Channel Testing the $616 Resistance Wall 🚀
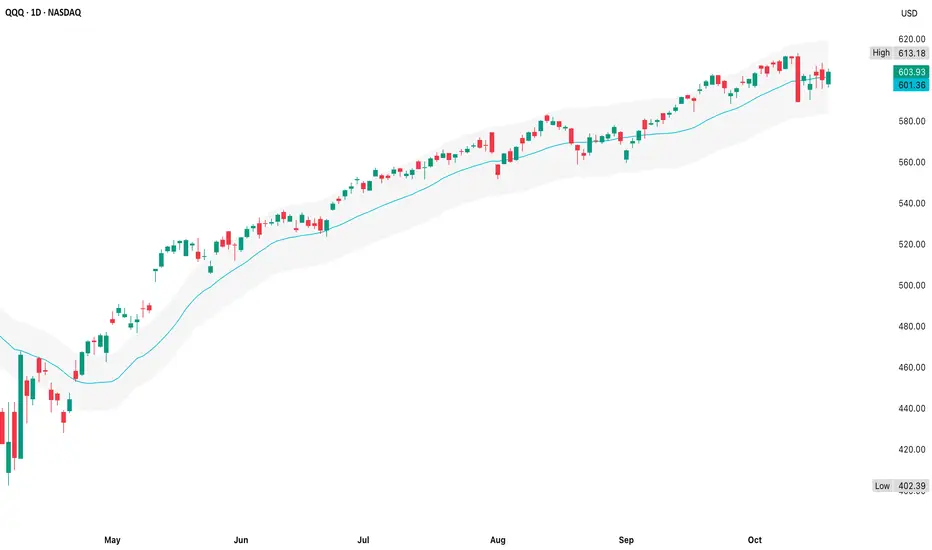
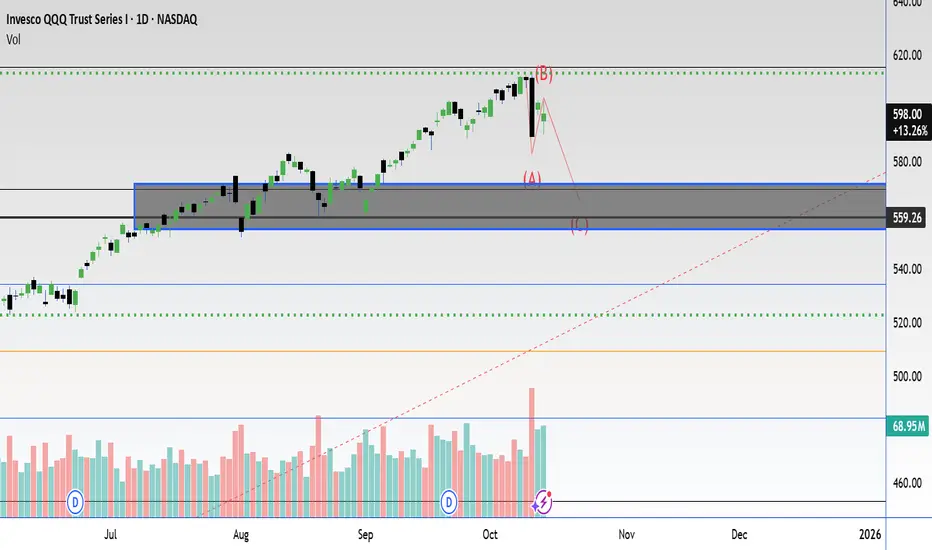
📆 Daily Chart — Macro Structure and Market Context
Market Structure:
The NASDAQ ETF (QQQ) continues to ride a steady ascending channel since March, maintaining a higher-low structure. The recent CHoCH at $583 was followed by a rebound and BOS (Break of Structure) above $600, confirming that the pullback phase has likely completed.
Price is now pressing into the upper channel resistance near $611–$616, which coincides with heavy liquidity and prior supply zones. Despite the overhead resistance, the broader structure remains bullish, with price action consolidating in the upper half of the channel — a typical mid-trend continuation behavior.
Supply & Demand / Order Blocks:
* Demand Zone: $583–$590 (key defended base from last CHoCH).
* Mid-Demand Zone: $558–$560 (38% fib + historical OB).
* Supply Zone: $611–$616 (upper channel cap and recent BOS level).
Indicator Confluence:
* 9 EMA > 21 EMA: bullish alignment with widening slope.
* MACD: Momentum recovering from midline, histogram expanding positively.
* Stoch RSI: Mid-range reset around 43 — plenty of room to rise.
* Volume: Rising on breakout days, confirming accumulation.
The daily chart suggests a continuation setup with bullish pressure intact. As long as QQQ holds above $600, bulls control the trend toward $616–$620.
⏱️ 1-Hour Chart — Near-Term Trend and Swing Setup
Market Structure:
The 1-hour view highlights a strong recovery leg after multiple CHoCH → BOS sequences. Price broke out of a descending wedge and reclaimed the $608–$610 level, a crucial pivot area aligned with gamma resistance.
Currently, QQQ is consolidating beneath the $612–$616 resistance wall. A clean breakout with volume could trigger a test of the upper trendline near $620.
Supply & Demand / OB Zones:
* Demand Zone: $605–$608 (retest area for dip buyers).
* Supply Zone: $612–$616 (active resistance zone).
Indicator Confluence:
* 9 EMA > 21 EMA: bull control intact.
* MACD: still strong, histogram shows gradual expansion.
* Stoch RSI: hovering near overbought but showing no divergence yet.
Trade Scenarios:
* Bullish Setup: Buy dips near $606–$608 → Target $616 / $620 → Stop $601.
* Bearish Setup: Short rejection at $616 → Target $605 / $600 → Stop $618.
A close above $616 opens the door for momentum continuation toward $622–$625, while losing $605 would likely trigger a retest of $590 demand.
🕒 15-Minute Chart — Intraday Scalping Structure
Market Structure:
The 15-min chart reveals QQQ’s short-term compression after a morning rally. Price remains within a rising micro-channel but is stalling near resistance at $612–$614. Several BOS patterns confirm trend continuation, while the latest CHoCH at $611.3 marks minor cooling.
This looks like a controlled pullback rather than a reversal, with liquidity building around $610.
Supply & Demand / OB Levels:
* Demand Zone: $608–$610 (intraday support and EMA confluence).
* Supply Zone: $614–$616 (scalp resistance).
Indicator Confluence:
* 9 EMA vs 21 EMA: still trending upward but flattening slightly.
* MACD: weakening histogram — possible short-term cooldown.
* Stoch RSI: cycling down from overbought, indicating temporary pause.
Scalp Plan:
* Bullish Bias: Buy near $609–$610 → Target $614 → Stop $607.
* Bearish Bias: Short rejection from $614–$615 → Target $609 → Stop $616.
Expect small consolidation before breakout. Trend remains bullish until $608 breaks decisively.
📊 GEX (Gamma Exposure) & Options Sentiment
The GEX structure shows heavy call positioning at $612–$616, with a clear gamma ceiling near $616 — currently acting as resistance. Below $604 lies the highest liquidity void (HVL) where dealers might provide support.
Key GEX Levels:
* Highest Positive GEX / Call Wall: $616 (major gamma resistance).
* 2nd Call Wall: $613.
* Put Wall / Support: $604 and $593 (dealer hedging floors).
* IVR: 22.9 — low, suggesting compression and potential volatility pop.
* Put/Call Ratio: 48.5% puts — slightly bearish skew but stabilizing.
Dealers are in neutral gamma territory, meaning price may grind within $604–$616 until a breakout forces delta hedging momentum in either direction.
🎯 Closing Outlook
The broader QQQ structure remains bullish inside an uptrend channel, supported by strong demand zones and recovering momentum indicators. The short-term price action is coiling for a potential breakout above $616 — a key level to watch for momentum confirmation.
As long as QQQ holds above $605, the trend bias stays bullish toward $620–$625.
If $604 breaks, expect a deeper pullback to $590 before buyers re-engage.
Disclaimer:
This analysis is for educational purposes only and not financial advice. Always perform your own due diligence and manage your risk carefully.
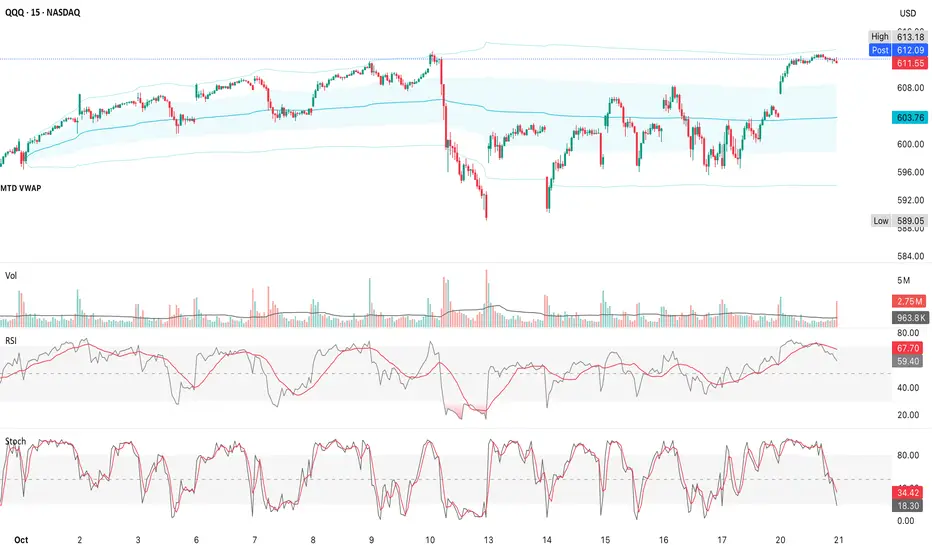
QQQ Early Topping BehaviorShort-term momentum is stretched so watch for a potential pullback to $608 then $603 if selling follows through
1. Price vs MTD VWAP
MTD VWAP ≈ $603.7, with +1σ ≈ $611 & +2σ ≈ $613
QQQ is pressing the upper (+2σ) edge of the VWAP envelope & that’s statistically extended
Historically, price rarely sustains above this zone without cooling off toward +1σ ($608-$609) or the VWAP itself ($603-$604)
Overbought short-term; risk of mean reversion if momentum fades
2. Volume Profile
Volume into the close rose sharply, but without broad range expansion
That kind of volume spike after an extended move often means distribution (profit-taking at highs) rather than fresh breakout energy
The closing volume spike without strong follow-through suggests distribution (smart money selling into strength)
That’s also characteristic of the transition from Wave 5 to wave a (meaning the first corrective down-leg may already be starting)
Likely aiming for $588-$590 first & potentially $532 over the next 4-6 weeks if the full correction unfolds
3. RSI (15m)
RSI ≈ 68 & curling lower from overbought
A bearish cross of RSI below its signal line after sitting near 70 is a classic short-term momentum-loss trigger
Supports the idea of a pullback or consolidation within 1-2 sessions
4. Stochastic Oscillator
Fast %K & %D have both rolled over sharply (≈ 34 & 18)
Coming off multiple overbought resets above 80, this steep drop signals short-term exhaustion with traders locking gains
5. Intraday Structure
You can see bearish divergence forming where price neared ATHs (~$613.18) while RSI & Stoch made lower highs
That divergence plus rejection at +2σ VWAP = early topping behavior on the 15m timeframe
Start of wave a
Post $613 tag
Pullback to $608–$609
+1σ VWAP support
Mid-wave a acceleration
Next 1-2 sessions
Sharp dip to $603-$604
MTD VWAP mean
End of wave a
Within ~3-5 days
$588-$590
Prior breakout base
Wave b "bounce"
Late this or next week
Rebound to $595-$600
Lower high under prior peak
Wave c
Following weeks
Down to $540-$532
61.8% daily retracement
October 20 - 24 2025
1. Macro
Due to the government shutdown inflation-indexed bond data is delayed, however what we are seeing based on data from Thursday (as shown on the white vertical line) suggests that forward inflation expectations $(US10Y+US03MY)/2-DFII10 may be reverting back to the mean, which is supported by TVC:US10Y rising slightly. The long term vs short term yield spread TVC:US10Y -US03MY has tightened and is very close to inverting, which was driven by long term yields plunging last week - a rush to safety. Another long-term bond rally could invert the yield curve, often a risk-off signal if it remains inverted and widens. The dollar is finding support near its average and gold is sitting at all time highs (more on gold later).
On the commodity side, Oil NYMEX:CL1! continues to slide, aided by fragile stability in the middle east. My ag/industrial gauge $(COPPER1!+ZC1!)/2/DXY is still elevated but lacks momentum. Nothing interesting to glean here other than the fact that higher commodity prices are not significantly affecting forward inflation expectations (for now). Oil’s continued downtrend is certainly playing a factor, however the pause in Fed data could also make any potential inflationary impact more delayed than usual.
When it comes to bonds, watch closely and proceed with caution.
2. FX
The dollar index is still well below other currency indices for the year but I have all of the charts on this layout indexed to 100 to show recent relative activity. The dollar TVC:DXY has recently seen stronger performance compared to other currencies, though the others have been on the uptick in recent days .
The important takeaway here can be seen on the 10Y yield comparison chart. Since the beginning of October, aside from Japan, buyers have pushed 10Y yields in the US, Eurozone and Britain down. This may suggest a rush to safety due to economic fears beyond just the US.
3. Risk
On the top left chart, you can see that the corporate bond option-adjusted spread average (high-yield & investment-grade) could have either peaked or is on the uptick. Since this data is only available at the end of the day, it’s best to proceed with caution.
Next, I want to highlight something I recently noticed when comparing the TVC:GOLD chart to its volatility index CBOE:GVZ . Last week while Gold was reaching all time highs, there was heavy buying of AMEX:GLD puts (GVZ was up over +20% on Thursday), which has pushed Gold down on the $GOLD/GVZ spread recently. I have included Gold on the bottom chart and marked the points where the ratio fell far below the standard deviation of (1) as shown via the Keltner Channel indicator on all of the charts. Looking at the previous three points where this extremity occurred, there seems to be some alignment with severe underperformance of S&P 500 Futures vs gold and stock market bottoms.
Since asset prices are currently seen as elevated and Gold is close to crossing above the CME_MINI:ES1! return since January 2020, the message this sends to me is that the gold rally is fear-driven rather than fundamentally-driven. Investors are aware that gold may be overstretched and are buying insurance. Fear without fundamentals can quickly become a buying opportunity for equities, especially when continued rate cuts (which in theory should help both Gold and Equities) are taken into consideration. If nothing fundamentally changes, and investors decide to start dumping gold, it would be expected to see equities catch a bid.
I’m also continuing to watch $SPY/RSP (SPY vs equal-weight ETF) and $NQ1!/YM1! to assess risk-on vs defensive bias. Right now the momentum towards risk is flat but the Russell TVC:RUT has slid more compared to the other indices recently, suggesting a rotation out of small caps, which supports the bias that both spreads could continue higher in favor of Risk, however that is just an assumption.
When looking at specific sectors, despite Consumer Staples ( AMEX:XLP ) finding support, I’m not yet seeing signs that the market is abandoning tech. All of this shows that recent volatility has not changed the market’s sector positioning in a significant way, however keeping an eye on XLP for now will be very important, as it could signal a risk-off day if $XLP/XLK rises strongly.
4. Bias ( CME_MINI:NQ1! )
I have changed my approach to trading to be more short-term, so I will not try to draw any weekly conclusions via this chart, however from Friday’s volatility action (lefthand side), it appears we may have seen a peak in near-term volatility last week. I would expect to se some volatility mean reversion on Monday ( TVC:VIX and CBOE:VVIX -VIX may open higher). If the volatility is absorbed by buyers (price is relatively flat or volatility is quickly absorbed by buyers), I think dealers will sell volatility (puts) and buy futures to raise the price of AMEX:SPY .
On the other hand, when more bearish factors (as described above) are considered, I can’t help but wonder when looking at the CME_MINI:ES1! chart if futures are forming a top. I would not have a problem playing the bull side if volatility activity suggests dealers are short puts, however if it shows indecision or short call positioning it may be best to sit out or wait for confirmation.
-+-+-+-+-+-+-+-+-+-+-+-+-+-+-+-+-+-+-
Conclusion:
Put simply - I am cautiously bullish on stocks.
I think the gold volatility is still mostly implied, so it will take a few more sessions before we find out if it will be realized or provide liquidity for more Gold buying. The extreme put buying has me fairly confident that the gold rally will stall out or pull back from around the 4,200 level.
Aside from news-related volatility, the only major threat I’m seeing to stocks is that institutions may start to rotate out of tech mega caps AMEX:XLK , communications AMEX:XLC , and consumer discretionary AMEX:XLY into safer sectors like consumer staples AMEX:XLP and healthcare AMEX:XLV . This can be tracked intraday so I will be watching it this week for early clues. $XLK/XLP will be an important gauge to watch, as well as $NQ1!/YM1! and $SPY/RSP for confirmation.
I’m not too worried about treasuries either. The lack of data will likely keep yields close to the average, and as I’ve said before, if the TVC:US10Y -US03MY curve inverts because 10Y declines while 3M is flat, it’s the less concerning way it could occur. Corporate bond spreads will be important to watch for a potential risk-off continuation, however that data will only be available once per day.
Most importantly, if volatility seems to have peaked (at least in the short term) it will solidify the bullish case. As I hope I’ve explained, I think the market is in a confused and defensive state, even if the situation doesn’t necessarily call for it. US economic data is still on hold so dealers are firmly in control of the narrative. Since dealers prefer to be short gamma on puts, that is the only reason why my bias is slightly bullish. On the contrary, if there is a sudden rush into puts that creates a significant Implied/Historical volatility imbalance, I will not hesitate to take the short side.

QQQ (17 October)The probability skew remains to the downside over the next 1-2 wks
±3% envelope = $622/$587
Expect mean reversion near $601
Technical confluence + implied vol suggest any break of $595 confirms a run toward the lower envelope (~$586-$590)
±3% Envelope from Current Price ($603.93)
1. +3% ≈ $622
Top edge of the prior uptrend channel; retests the failed breakout zone from early October ($613-$620)
Strong resistance cluster; unlikely to break unless mega-cap earnings crush expectations
2. -3% ≈ $586.80
Perfect alignment with the measured-move support from the head & shoulders (~$585-$590)
This is the “bear completion” area where shorts often take partial profits
The daily chart shows QQQ trapped around its mean, with weakening upside participation - ideal environment for short-term bearish option plays (1-3 week window), but not yet a crash setup
If you close below $600 on volume, this likely triggers momentum algos for a retest of $592
If you close above $607 with breadth confirmation, you’ll get a squeeze, but probably short-lived without macro support
The mean line around $601-$602 is acting as the pivot for now & price keeps oscillating right around it
You’ve got 2 failed highs in early & mid-October, that’s consistent with a rolling top
The candle bodies are hugging the lower half of the volatility band rather than the upper which is a subtle shift in momentum
RSI (4H view) is still under 55 with no true momentum reclaim
So despite the bounce Friday, it’s technically still corrective inside an uptrend, not fresh bullish
This kind of daily structure with a slow drift near the mean with room to test lower band usually plays out over 1½-2 weeks before a directional break
That again points to 10 to 21d options as the sweet spot since it's enough time for confirmation, short enough to keep theta manageable
QQQ No Man's LandRising wedge pattern clearly broke to the downside
The price is consolidating just below the MTD VWAP, which now acts as resistance (~$600-$601)
The lower bound of the wedge (~$596) is being tested; breaking that increases odds of a retest of $589-$590 (prior support from 11 October)
RSI (47) is just under neutral, leaning bearish with no strong oversold bounce signal yet
Stochastic (≈58) is curling higher, but still mid-range, implying a weak rebound attempt
Volume is rising slightly into the close, suggesting distribution, not accumulation
The intraday structure is bearish, as long as QQQ stays below $601-$602
Any close above VWAP would invalidate the short-term down bias
If $596 breaks, expect acceleration toward $592, then $589 (bottom Bollinger band)
If $595 holds & RSI rebounds, you could see a short squeeze back toward $602 before sellers reload
The 15m chart shows a rising wedge breakdown, confirming sellers in control short-term
The 4H trend remains intact but fragile, with the 50d MA around $599.5-$600
Momentum compression (RSI mid-40s, Stoch flattening) implies a volatile swing into Friday with an expected 1d move ±1.0% (≈$6 range)
Implies QQQ could trade between ~$588 & $610 short-term
Bearish Path (favored 60%)
Fails at VWAP (≈$600-$602)
RSI rolls under 40 on 15m chart
Next leg to $595 to $590 test
Acceleration possible into close Friday
Bullish Path (40%)
Defends $596, closes >$602 with volume
Short squeeze to $606-$608, but likely capped below $610
Still a countertrend rally unless above $610

Global Market Risks and Rewards1. Introduction to the Global Market Landscape
The global market functions as a single ecosystem that links economies, corporations, and investors worldwide. With technology, globalization, and liberalized trade policies, even small and medium-sized enterprises (SMEs) can participate in international trade. However, the very interdependence that fuels growth also magnifies vulnerabilities — such as financial crises, geopolitical tensions, and supply chain disruptions.
Therefore, participation in global markets is a balance of risk and reward, shaped by economic cycles, political decisions, innovation, and global events.
2. Major Rewards of Participating in Global Markets
a. Economic Growth and Expansion Opportunities
One of the most significant rewards of global market participation is access to new consumer bases. Companies can move beyond saturated domestic markets to tap into emerging economies with growing middle-class populations. For instance, Indian IT companies like Infosys and TCS expanded globally, gaining large revenue shares from clients in North America and Europe.
Global exposure allows companies to scale production, diversify demand, and strengthen their brand presence. Investors also gain from exposure to fast-growing regions and sectors unavailable in their home markets.
b. Diversification of Investments and Risk Spreading
For investors, the global market offers a chance to diversify portfolios. By investing in multiple countries and asset classes, they can reduce exposure to country-specific risks such as inflation, political instability, or currency depreciation. For example, when one economy slows down, another may be in a growth phase — creating a natural hedge.
This diversification principle works across equities, commodities, bonds, and even digital assets, spreading risks while increasing long-term stability.
c. Innovation, Technology Transfer, and Knowledge Sharing
Globalization promotes cross-border innovation. Companies operating in international markets often adopt advanced technologies and management practices from developed economies. Likewise, emerging economies benefit from foreign direct investment (FDI) and partnerships that bring expertise, modern infrastructure, and new skills.
For instance, the automobile industry in India and Mexico has grown significantly due to joint ventures with global players who introduced efficient production technologies and quality control standards.
d. Competitive Advantage and Cost Efficiency
Operating in a global marketplace encourages firms to become more efficient and competitive. They must innovate continuously, optimize costs, and maintain high product standards to survive. This process improves overall productivity and quality in both domestic and international markets.
For example, multinational corporations (MNCs) strategically set up production units in countries with lower labor and operational costs, such as Vietnam or Bangladesh, enabling them to reduce costs while maintaining global quality standards.
e. Access to Capital and Financial Markets
Global markets open access to international funding sources. Companies can issue bonds or stocks in foreign markets to attract investors and raise capital at lower interest rates. Developing countries also gain from global financial flows through FDI, portfolio investments, and sovereign funds.
For instance, many Asian startups receive venture capital from the U.S. and Europe, boosting innovation and entrepreneurship.
3. Key Risks of Global Market Participation
While rewards are significant, global markets also carry systemic risks that can impact profits, stability, and long-term growth.
a. Political and Geopolitical Risks
Politics plays a vital role in shaping trade and investment decisions. Sudden changes in government policies, taxation, trade restrictions, or sanctions can disrupt business operations. Geopolitical conflicts — such as tensions in the Middle East or U.S.–China trade wars — can destabilize global supply chains and affect commodity prices.
For instance, the Russia–Ukraine war in 2022 led to energy supply shocks, surging oil and gas prices, and inflation across Europe, showing how one regional conflict can ripple through the global economy.
b. Exchange Rate and Currency Risks
Currency fluctuations directly affect international trade and investments. A company exporting goods to another country may face losses if the foreign currency weakens against its home currency. Similarly, investors holding assets in multiple currencies may face returns volatility due to exchange rate shifts.
For example, if the U.S. dollar strengthens sharply, emerging market currencies often fall, increasing the debt burden of countries or companies that borrowed in dollars.
c. Economic and Financial Market Risks
Global financial markets are deeply interconnected — which means crises spread rapidly. The 2008 global financial crisis began in the U.S. housing market but soon spread worldwide, affecting banks, investors, and governments globally.
Similarly, inflation, interest rate hikes, or recessions in major economies like the U.S., China, or the Eurozone can influence investment flows, commodity prices, and capital markets globally.
d. Supply Chain and Logistics Risks
The COVID-19 pandemic revealed how fragile global supply chains can be. Lockdowns, port delays, and labor shortages disrupted production and trade across sectors. Overdependence on a single supplier or region (e.g., China for electronics manufacturing) can create vulnerabilities.
Companies are now diversifying supply chains — a concept called “China + 1” strategy — to reduce geographic concentration risk.
e. Legal and Regulatory Risks
Each country has its own laws on taxation, labor, environment, and intellectual property. Multinational companies must comply with multiple legal frameworks, which can be complex and costly. Sudden changes in trade policies, tariffs, or environmental standards can affect profitability.
For instance, stricter data protection laws in Europe (GDPR) forced global tech firms to revamp their data-handling systems, adding compliance costs.
f. Environmental and Climate Risks
Climate change has become a major factor in global business and trade. Extreme weather, resource scarcity, and environmental regulations affect production and logistics. Companies with high carbon footprints face increasing pressure from both regulators and investors to transition toward sustainable models.
Environmental disruptions — such as floods in Southeast Asia or droughts in Africa — can also lead to supply shortages and price spikes in food and commodities.
g. Cybersecurity and Technological Risks
As trade and finance shift to digital platforms, cybersecurity risks have multiplied. Hacking, ransomware, and data breaches can cause severe financial and reputational damage. Financial markets, logistics systems, and digital payments depend on secure IT infrastructure — making cybersecurity a top priority for global firms.
h. Cultural and Operational Risks
Differences in language, culture, and business practices can lead to misunderstandings and inefficiencies. A product successful in one country might fail in another due to different consumer preferences or cultural sensitivities.
For example, Western fast-food chains initially struggled in Asian markets until they localized menus and marketing strategies.
4. Balancing Risk and Reward: Strategic Approaches
To succeed in global markets, businesses and investors must balance risks with potential rewards through strategic planning and diversification.
a. Risk Management and Hedging
Companies use hedging instruments like futures, options, and forward contracts to protect against exchange rate and commodity price fluctuations. Insurance policies can mitigate risks from political instability or natural disasters.
For example, exporters hedge currency exposure to lock in future exchange rates and stabilize revenues.
b. Geographic and Sectoral Diversification
Expanding into multiple countries or sectors helps spread risk. A company heavily dependent on one market may face losses during local downturns, while a diversified firm can offset that with growth elsewhere.
For investors, holding a mix of assets — stocks, bonds, commodities, and foreign equities — reduces portfolio volatility.
c. Sustainable and Responsible Business Practices
Modern global markets increasingly reward companies that adopt Environmental, Social, and Governance (ESG) principles. Sustainable businesses attract long-term investors, gain regulatory advantages, and reduce exposure to environmental or ethical risks.
Green investments, renewable energy projects, and responsible sourcing are not only good for the planet but also create competitive advantages.
d. Technological Adaptation and Innovation
Digital transformation, automation, and AI-driven analytics help firms manage operations efficiently and respond to global challenges. Technology enables real-time monitoring of logistics, market trends, and customer needs, improving adaptability and profitability.
e. Strategic Alliances and Partnerships
Collaboration with local partners, joint ventures, or regional alliances helps global firms understand local markets, comply with regulations, and build trust. Such partnerships reduce entry risks while leveraging local expertise.
5. Emerging Trends Influencing Global Risks and Rewards
The dynamics of global markets are constantly evolving. Several emerging trends are reshaping the risk-reward balance.
a. Shift Toward Emerging Economies
Asia, Africa, and Latin America are expected to drive most global growth in the next decades. Investors and corporations see significant opportunities in these fast-growing markets — though they often come with higher political and currency risks.
b. Rise of Digital and Decentralized Finance
Cryptocurrencies, blockchain, and digital payment systems are transforming how international transactions occur. They offer efficiency and lower costs but also introduce regulatory uncertainty and cyber risks.
c. Reshoring and Supply Chain Realignment
Post-pandemic, many countries are encouraging domestic manufacturing and reducing dependence on foreign supply chains. This reshoring trend reduces vulnerability but may increase costs in the short term.
d. Focus on Green and Inclusive Growth
Governments and investors are aligning with climate goals, encouraging low-carbon industries, and penalizing polluting sectors. Green energy, electric vehicles, and carbon trading markets are creating new global investment opportunities.
6. Conclusion: The Dual Nature of Global Markets
The global market is a double-edged sword — offering unprecedented rewards while exposing participants to complex risks. Economic interdependence ensures that prosperity in one region can fuel global growth, but crises can just as easily spread across borders.
Success in the global arena requires strategic risk management, adaptability, and continuous innovation. Companies and investors who understand these dynamics — and balance opportunity with caution — can not only survive but thrive in this interconnected world.
In essence, the global market is not just about trade and investment; it is about understanding the rhythm of global change — where risk and reward coexist as inseparable partners in the journey toward progress and prosperity.

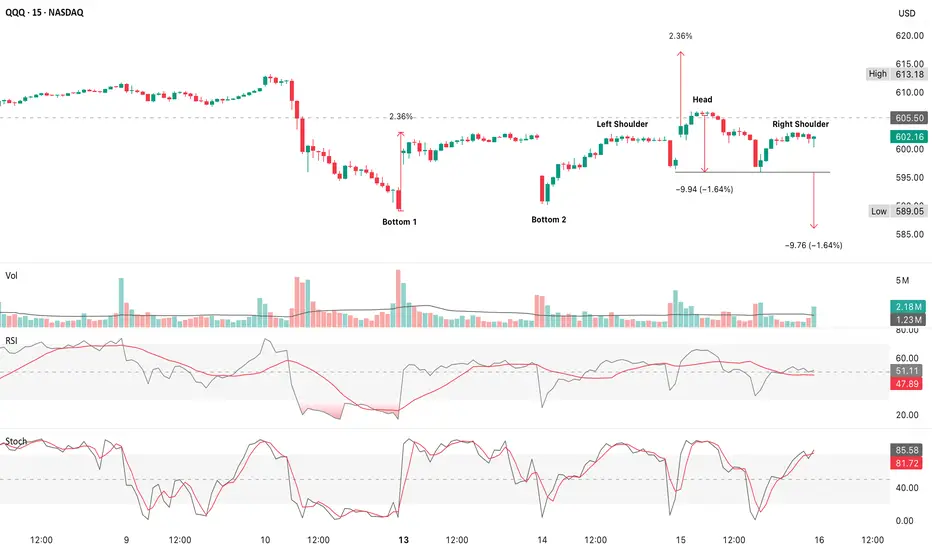
QQQ Compression CoilThe bulls trying to extend the prior double-bottom rally while bears defend the neckline of a new head & shoulders
Volume contraction is key as it means bears haven’t confirmed their pattern yet
RSI ≈ 51 is perfectly neutral; momentum flat, but not diverging yet
Stoch ≈ 82 is in showing short-term overbought, which often precedes a minor pullback; unless, volume expands upward
Volume is declining through right-shoulder formation which suggests indecision, not conviction selling
Double-bottom support vs emerging head & shoulders resistance
Until $595 or $606 decisively breaks on volume, expect sideways consolidation
The edge slightly favors bulls because the neckline hasn’t been challenged with volume
RSI & structure still lean constructive
1. Continuation of relief rally; neckline retest from above (55%)
Break above $606-$610
2. Rejection & neckline (35%)
Test ($595)
3. Controlled fade; could create a larger base (10%)
Clean neckline breach
Would target $585–$586 quickly; momentum flush
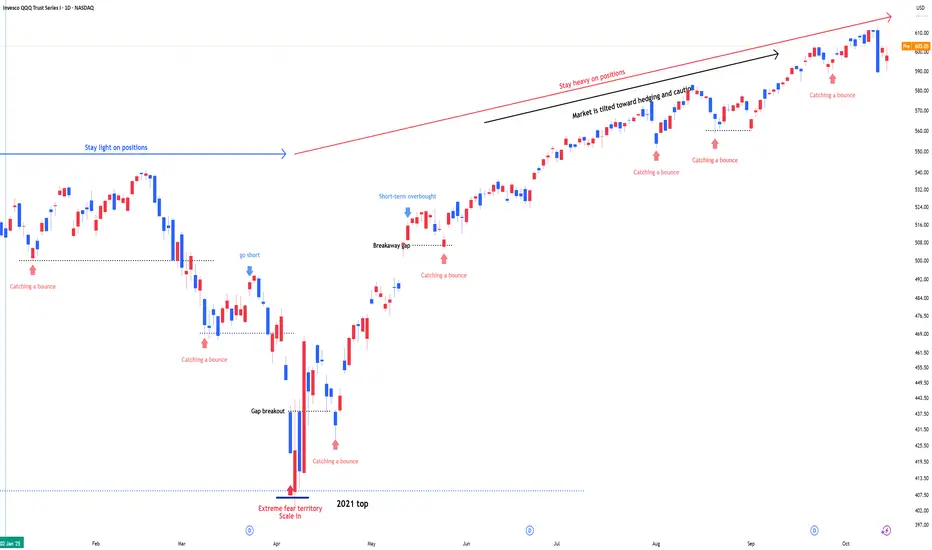
QQQ : Stay heavy on positionsQQQ : Stay heavy on positions (QLD, TQQQ)
Entering a risk-on, high-volatility zone.
In stay light on positions zones, I hold QQQ and reduce exposure.
In stay heavy on positions zones, I increase allocation using a mix of QLD and TQQQ.
** This analysis is based solely on the quantification of crowd psychology.
It does not incorporate price action, trading volume, or macroeconomic indicators.
Impact of Geopolitical Tensions on Supply Chains1. Introduction to Geopolitical Tensions and Supply Chains
Geopolitical tensions refer to conflicts, disputes, or strained relations between countries, often involving political, economic, or military dimensions. These tensions can disrupt international trade and global supply chains, which rely on the smooth movement of goods, services, and information across borders. Supply chains are interconnected networks of suppliers, manufacturers, logistics providers, and distributors. When geopolitical crises arise—such as wars, sanctions, or territorial disputes—they can cause delays, increase costs, and force companies to seek alternative routes or suppliers. In an era of globalization, even a localized conflict can have far-reaching effects on industries worldwide.
2. Trade Restrictions and Sanctions
One of the most immediate effects of geopolitical tensions is the imposition of trade restrictions, tariffs, and sanctions. Countries may restrict exports or imports of critical goods like oil, technology, or raw materials to exert political pressure. For example, sanctions on Russia following the Ukraine conflict disrupted the supply of natural gas and rare earth metals, causing ripple effects in energy-intensive industries and electronics manufacturing. Companies dependent on sanctioned countries face compliance risks, legal penalties, and the need to find alternative suppliers, often at higher costs.
3. Disruption of Transportation and Logistics
Geopolitical tensions often create unsafe or restricted transport routes, impacting maritime, air, and land logistics. Shipping lanes, like the Strait of Hormuz or the South China Sea, can become contested zones, raising insurance costs and causing shipping delays. Similarly, airspace restrictions force rerouting of cargo flights, increasing fuel consumption and delivery times. Ports in conflict zones may halt operations entirely, forcing supply chains to seek distant ports and increasing lead times. These disruptions not only delay deliveries but also create bottlenecks that affect the entire global distribution network.
4. Volatility in Commodity Prices
Geopolitical crises often trigger sharp fluctuations in commodity prices, particularly oil, gas, and metals. These price swings directly affect transportation costs and manufacturing expenses. For instance, during periods of Middle East instability, crude oil prices can spike, increasing the cost of shipping and production for industries reliant on fuel. Similarly, conflict in rare earth-producing regions can disrupt electronics and automotive industries, as these minerals are critical in high-tech manufacturing. Companies must adapt to these volatile conditions, often by hedging prices or maintaining strategic reserves of essential materials.
5. Supply Chain Diversification and Resilience Challenges
Geopolitical tensions highlight the vulnerability of single-source or regionally concentrated supply chains. Companies may face pressure to diversify suppliers and manufacturing locations to reduce risk. However, diversification comes with challenges such as higher operational costs, longer lead times, and complex coordination across multiple countries. For example, firms heavily reliant on Chinese manufacturing for electronics faced difficulties during U.S.-China trade disputes, prompting efforts to establish alternative production hubs in Southeast Asia or India. While diversification improves resilience, it also increases the complexity of global supply chain management.
6. Impact on Workforce and Production
Conflict or political instability can disrupt the availability of labor in affected regions. Strikes, protests, or military conscription reduce workforce productivity, while migration crises can strain labor markets in neighboring countries. Factories in politically unstable regions may face temporary closures, production slowdowns, or workforce shortages. For multinational companies, this unpredictability can delay production schedules and contractual obligations, ultimately affecting revenue and customer trust. In addition, geopolitical tensions can lead to restrictions on skilled labor movement, limiting access to essential technical expertise in global supply chains.
7. Cybersecurity Threats and Industrial Espionage
Geopolitical tensions often escalate cyber threats targeting supply chains. Nation-state actors may attempt to disrupt industrial operations, steal intellectual property, or sabotage logistics networks. Critical sectors such as defense, energy, and pharmaceuticals are particularly vulnerable. Cyberattacks can halt production, corrupt shipment data, or compromise financial transactions. Companies must invest in robust cybersecurity measures and contingency planning to protect their supply chain from these emerging risks. The integration of digital technologies in supply chains increases efficiency but also amplifies vulnerability to politically motivated cyber threats.
8. Financial and Insurance Implications
Geopolitical instability increases the financial risk of supply chains. Higher insurance premiums, cost of hedging against currency fluctuations, and increased interest rates for trade financing are common consequences. Companies may face liquidity challenges if payments are delayed due to banking restrictions in sanctioned countries. Financial risk management becomes critical to maintaining continuity in global operations. Firms may also have to maintain emergency funds or negotiate flexible credit terms with suppliers and logistics providers to cushion against sudden disruptions caused by geopolitical events.
9. Regulatory Compliance and Legal Challenges
Operating across regions with tense political relations requires strict adherence to international regulations, export controls, and sanctions. Violating these regulations, even unintentionally, can result in severe penalties, reputational damage, and operational restrictions. Companies must constantly monitor changes in laws across countries, ensure compliance, and train personnel accordingly. For instance, restrictions on dual-use technologies, military-grade materials, or certain chemicals may force supply chain redesigns. Legal complexities add operational overhead and require robust compliance management systems.
10. Strategic Shifts and Long-Term Supply Chain Transformation
Persistent geopolitical tensions push companies to rethink long-term strategies. This includes reshoring or nearshoring production, building strategic reserves, investing in automation, and leveraging local suppliers to reduce dependency on high-risk regions. Supply chain digitization and predictive analytics are increasingly used to anticipate disruptions and optimize logistics routes. Furthermore, geopolitical awareness is becoming a core part of corporate strategy, influencing investment decisions, market entry, and partnerships. Companies that proactively adapt to geopolitical realities can build competitive advantages through resilient, flexible, and agile supply chains.
Conclusion
Geopolitical tensions have a profound impact on global supply chains, affecting trade flows, transportation, commodity prices, workforce availability, cybersecurity, financial stability, and regulatory compliance. While these disruptions present challenges, they also create opportunities for companies to enhance supply chain resilience through diversification, technology adoption, and strategic planning. In an interconnected global economy, understanding and mitigating geopolitical risks is no longer optional—it is critical for maintaining operational continuity and competitive advantage.
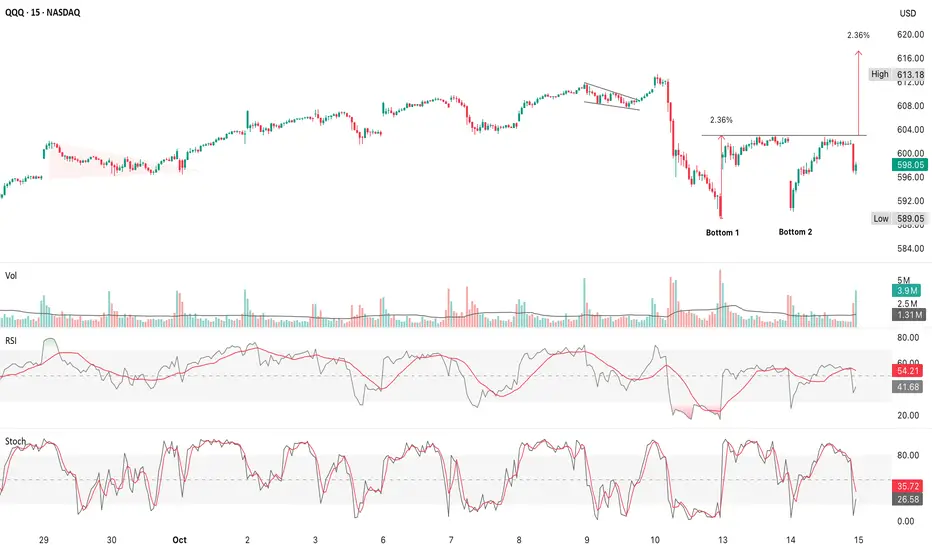
QQQ Momentum TakeawayQQQ is carving out a constructive double-bottom reversal base
Needs a confirmed breakout above $604 to unlock $613–$619 upside
Structure supports the idea that the market is beginning to self-correct after the tariff-shock overreaction
Bullish divergence confirmed; momentum rising while price tests resistance
The highest volume occurred during the first bottom (panic flush) & volume at the second bottom was lower (classic exhaustion signal)
The right-side rally back to $600 printed increasing volume, suggesting dip buyers are active
If QQQ closes above $604 on elevated volume, measured move becomes active with short-term bullish bias toward $613–$618
Panic becomes opportunity once price stability returns
QQQ UpdateI think QQQ is in a 3 wave Correction! I also belive november and December we break all time highs!
Universal Trading Psychology: The Patience Paradox PlaybookUniversal Trading Psychology: The Patience Paradox Playbook
A general discipline lesson you can apply to any liquid market and any timeframe
Most trading pain is not caused by a bad system. It is caused by impatience. The edge appears when you plan inactivity, watch with intent, wait for confirmation, and only act when setup quality is high. Cash is a position.
1. Why patience beats impulse in every market
Impatience sneaks in as early entries, overtrading, revenge trading, and random scaling. These habits feel productive because you are clicking and chasing motion. In reality they transfer capital from your future self to the present urge. Patience does the opposite. It gives your method time to read structure, it allows volatility and volume to normalize, and it keeps your energy for the right moment. The effect is universal. It does not matter if you trade indices, commodities, crypto, stocks, or forex. It does not matter if you trade on the one minute, the fifteen minute, or the daily. The core link is simple. Better timing raises the probability of an idea and lowers drawdown. Fewer attempts with higher quality improve expectancy and improve return divided by drawdown. That is the language that every account understands.
2. The Patience Paradox in plain language
The paradox says you can win more by doing less. You plan windows where you watch the market without touching the buy or sell buttons. You promise to yourself that you will let a timer run and you will only act after a confirmation event. Inactive minutes feel like a cost at first. In practice they are an investment. They reduce noise, they teach you the current regime, and they keep you calm enough to apply your edge. The paradox holds across sessions. The first minutes after a session begins often have high noise and emotional bait. The middle of the session can go quiet and trick you into forcing trades. The last minutes can be erratic. A patient trader respects this rhythm and keeps a written plan of when to observe and when to allow action.
3. Observation windows that fit any market
Observation windows are simple. Pick a time block. Start a timer. During the block you do not place orders. You watch the tape, the order of bars, the response to levels, and the size of swings. You collect awareness. You write one or two sentences about regime and structure. Then the timer ends. Only then do you look for a trade.
Observation windows you can adopt today
Pre session scan for fifteen minutes. You prepare levels and watch the first hints of tempo. Inactive only.
Session open observation for fifteen minutes. You let the first box form. No orders until a bar closes beyond this box and the next bar respects that information.
Mid session read for thirty minutes. You classify regime as active or quiet using simple filters and you decide trend, range, or inactivity.
Pre secondary session observation for fifteen minutes. If your market has two major sessions, you repeat the open observation idea.
Post trade cooldown for ten to twenty minutes. You break the dopamine loop, you write a short review, and you reset your attention.
How to make it practical
Place a small physical timer on your desk. A phone timer also works. Print a one page card with your windows and durations. When the window starts, say out loud that you are in observation and you will sit on hands until the timer ends. This small ritual builds identity. It tells your brain that watching is part of trading and not a waste of time.
4. Confirmation that cuts false signals
Impatience usually shows up as early entry without confirmation. The most portable rule is also the simplest. Wait for the close. A signal bar that looks perfect in the middle of its life can close with a wick, a rejection, or a full flip. If you still want earlier entry mechanics, use delay one bar. You let a signal print. You enter on the next bar only if price remains valid. Both rules reduce false positives and reduce the total number of attempts. That is a feature, not a bug. The quality of attempts goes up. The mood in your head calms down. Your journal becomes cleaner to read and your expectancy calculation becomes more stable.
A universal confirmation checklist
The setup is valid by your written plan.
Close confirms beyond structure or a retest holds and closes in your direction.
Regime filters are supportive. You see participation that matches the idea.
Risk and position size are defined. The exit is clear before you click.
5. Regime filters that travel well
Regime is the background condition that decides if your strategy is likely to read the market correctly. You can estimate regime with two simple filters. One measures volatility. One measures participation. These two are available on any platform.
Volatility filter
Use average true range with a long enough length to be stable. A common choice is length fifty. Express ATR as a percent of price so you can compare across timeframes and symbols. Compare the current reading to a baseline such as the daily median over the last few weeks. Above the baseline means active regime. Below means quiet regime.
Participation filter
Use a session volume baseline. A simple moving average of session volume works. When current volume is below the baseline, you demand more patience or you switch to range tactics. When current volume is above the baseline, you keep confirmation strict and you avoid random scalps.
Session filter
Every market has time of day effects. The first minutes can be noisy. Lunchtime or the middle band can be flat. The last minutes can snap. You plan a response. Observe at the open. Reduce attempts in the lull. Keep the end of session simple.
6. Cooldown, loss streak lockout, and daily loss limit
Cooldown is the fastest lever you can pull to stop impulsive streaks. After any loss you start a ten to twenty minute cooldown. You leave the chart zoom alone. You write a short paragraph with what the market did and what you did. This break cuts the urge circuit and lets you reset. A lockout is a stronger version. Two losses in a row at full risk trigger a lockout until the next session. Three small losses also trigger a lockout. A win does not cancel a lockout if you broke plan discipline during the win. A daily loss limit protects the account from a bad day. Pick a fraction of your weekly drawdown budget. When you hit it, you stop for the day. These three guardrails build survivorship and keep your mind from spiraling.
7. Expectancy and return divided by drawdown
Expectancy is the average outcome per trade. Write it as average win multiplied by win probability minus average loss multiplied by loss probability. It is a small number in units of R. That is fine. The power of expectancy is repetition. The second metric to watch is return divided by drawdown. This tells you how efficiently you compound given the cost of the worst pullback. Patience improves both. Cutting early attempts raises win probability and often raises average win because you pick cleaner structure. Removing impulsive losses reduces drawdown. Together they stabilize equity and make your process less emotional.
A quick way to measure
Log ten to twenty trades under the patience protocol. Record average win in R, average loss in R, win rate, and worst drawdown in R. Compute expectancy and return divided by drawdown. Then compare to your prior logs where you did not respect observation or confirmation. The difference shows you why patience pays.
8. A portable pre market checklist
Checklists prevent decision fatigue. Use one page. Keep the language simple.
Trade plan
Plan is visible. Strategy is defined.
Entry, exit, and position size rules are clear and written.
Journal template is open.
Market regime
ATR as percent of price labeled active or quiet.
Session volume labeled below baseline or above baseline.
Prior session open, high, low, close marked.
Observation windows for the first minutes drawn on the chart.
Session timing
Pre session observation timer set.
Open observation window scheduled.
Lunchtime lull noted.
Post session review time booked.
Watchlist and setup quality
Three to five names maximum.
One sentence setup description for each name.
Score the idea from one to five on quality.
Act only on four or five.
Confirmation and patience
Delay one bar or close based confirmation selected.
Inside bar means wait. No exceptions.
If FOMO appears, start a five minute micro timer and breathe.
Say out loud that doing nothing is a valid decision.
Risk and position control
Risk per trade set as a fixed percent of equity.
Stop never widened after entry.
No adds unless the plan explicitly allows scaling.
Daily loss limit and lockout rules visible.
Exit plan
Exit condition defined before entry.
Partial exits use confirmation if the system supports it.
If a volatility spike hits, reduce risk or exit per plan.
Journal the reason for the exit.
9. A simple setup quality score
A score makes permission to trade objective. Use five factors. Each is zero to two.
Factors
Regime. Market aligned with the strategy using the filters.
Structure. Setup is clean with room to target.
Timing. Observation respected and confirmation present.
Risk. Position size correct and stop placed where logic breaks.
Mindset. Patient attention present and FOMO absent.
Eight or more means permission. Seven or less means wait. This one rule saves careers.
10. A day in the life under the Patience Paradox
You begin fifteen minutes before your active session with an observation. You mark levels and write a short line about tempo. No orders. When the session begins you let the first box print. A breakout looks tempting inside the window, but you stay inactive. The next bar fails to close beyond the box. You extend the delay. Later participation rises above the baseline and volatility reaches the active zone. Your strategy calls for a trend pullback entry. You wait for a bar to close back in the direction of trend. Then you take a single position with one percent risk. The trade reaches target. You record the result and start a short cooldown. Near the second session open you repeat the observation idea. A clean setup appears but your score is only six. You pass and write one sentence to honor the decision. You end the day with a review and update your metrics. Equity is stable. Attention is calm. The process feels repeatable.
11. Overtrading prevention that actually works
Limit attempts per session. Use micro breaks whenever fatigue appears. If the journal shows a loss streak, apply the lockout. If volatility is too low, accept inactivity. If noise is heavy near the open, extend the observation. If you break any rule, record the event and reduce size on the next attempt. Prevention is cheaper than recovery. You will never regret a trade you did not take. You will often regret the one you forced.
12. Mindfulness and urge surf for traders
Mindfulness is not about long meditation. It is about a one minute reset. Watch the breath for one minute. Name the urge silently. Start a two minute timer and surf the wave. When it passes, you return to the plan. This tiny protocol moves you from reaction to response. Over time it raises your discipline score and lowers your cost of error.
13. Frequently asked behavior questions
What if the first clean setup appears during the first minutes of the day
You still respect the observation. The first confirmation bar after the window often gives better probability and a calmer entry.
What if volume stays below average all day
Reduce attempts. Focus on one name or stay inactive. Quality beats quantity. You are paid for selectivity, not activity.
What if I miss a win after a long wait
Missing is normal. Write it in the journal and keep the schedule. The market never runs out of opportunities. Your attention does.
How do I measure improvement
Track three numbers. Expectancy. Return divided by drawdown. Discipline score. If the first two rise and the third stays above four, the process is working.
14. Install the Paradox in one week
Day one. Print the checklist and the windows. Place a timer on the desk. Commit to half the usual number of attempts.
Day two. Run all observation windows. Log only confirmed ideas.
Day three. Add the cooldown after any loss. Review your writing at the end of the day.
Day four. Apply the loss streak lockout if needed. Protect the account.
Day five. Score every idea with the five factor grid. Only trade eight or more.
Day six. Compute expectancy and return divided by drawdown from the week.
Day seven. Read your notes. Keep the parts that made you calm and effective. Remove what was noise.
15. Comparator versus a passive baseline
You want to see that patience improves efficiency. Pick a baseline that matches your market. If there is a natural session, use buy at session open and exit at session close. If there is no natural session, use an always in market baseline. Then run the Patience Paradox protocol next to it.
How to compare in three steps
Compute baseline results across your window. Record attempts, average result per session, and worst drawdown in R.
Compute Paradox results with observation windows, confirmation, and guardrails. Record attempts, expectancy, and worst drawdown in R.
Compute return divided by drawdown for both. When the protocol is respected, this ratio usually improves even if total trades drop. Your account and your sleep benefit from that.
16. A journal template you can use today
Before entry
Setup name and one sentence description.
Regime notes on volatility and participation.
Quality score and reason for each point.
Risk in R and exit plan.
After exit
Result in R and whether the logic held.
What you felt and how you responded.
What you would repeat and what you would remove.
One sentence lesson for the board.
17. Advanced patience drills for professionals
The inside bar extension
When a bar prints inside the prior range you extend the observation by one more bar. This drill stops you from guessing breakouts and creates a natural delay.
The half size probation
After a loss you allow the next confirmed idea at half size. You return to full size only after a clean win that followed plan. This keeps you from trying to win it back.
The one pass rule
You allow yourself one pass on a marginal idea each week. You write the reason and the outcome. This rule prevents a cascade of rationalizations.
18. Closing perspective
Patience is not passive. It is active observation guided by rules. A professional monitors regime, respects timers, demands confirmation, and protects the account with cooldowns and lockouts. The paradox is simple. Inactivity at the right time raises probability, keeps drawdown shallow, and makes expectancy stable. Traders who internalize this find that the market stops feeling like a battle and starts feeling like a process. You do less. You see more. You let the best ideas come to you.
Education and analytics only. Not investment advice.
Thank you all for reading this article.
If you have any type of requests, drop a comment below.

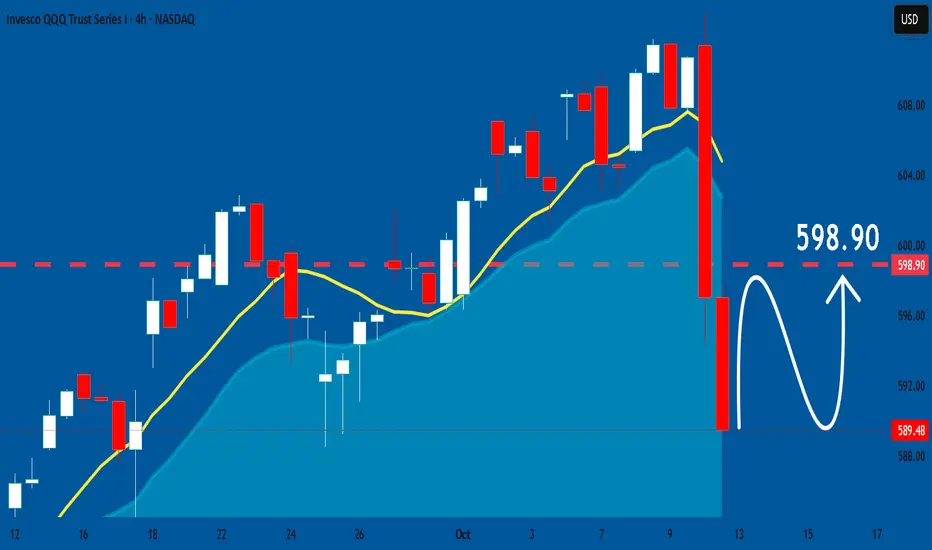
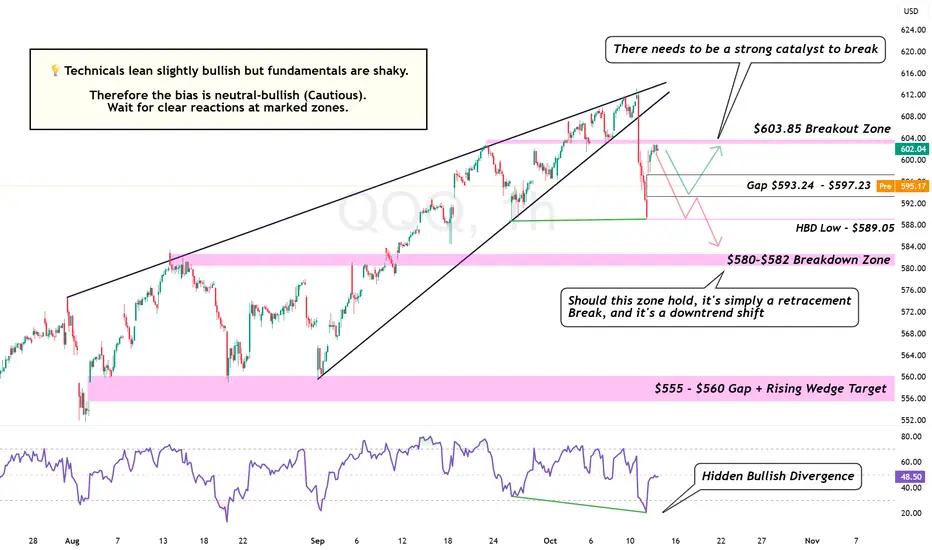
QQQ: Bull Trap or Bounce Time? The $593 Line in the SandQQQ is gapping down right into a massive technical test: the $593 Gap Support.
This is not a regular drop. Our chart is showing a rare conflict:
Bullish Setup: A Hidden Bullish Divergence (HBD) is screaming for a bounce.
Bearish Risk: A loss of the low could trigger a rapid descent to the $580 Zone.
The bias right now is neutral-bullish — cautious optimism.
If bulls hold the gap, expect a short-term rebound toward $603–$605 where sellers will likely re-emerge.
But if $593 gives way, this turns into a full-on correction targeting $582 → $560, completing the wedge breakdown target.
This is the moment of truth.
Bulls need to defend $593 or risk a complete sentiment shift.
Key Levels:
$603.85 — Breakout Zone
$593.24–$597.23 — Gap Support
$589.05 — Structural Floor
$580–$582 — Breakdown Zone
$555–$560 — Rising Wedge Target
Bias: 🟡 Neutral-Bullish (Cautious)
Timeframe: 1H
Indicators: RSI Hidden Bullish Divergence, Rising Wedge Breakdown
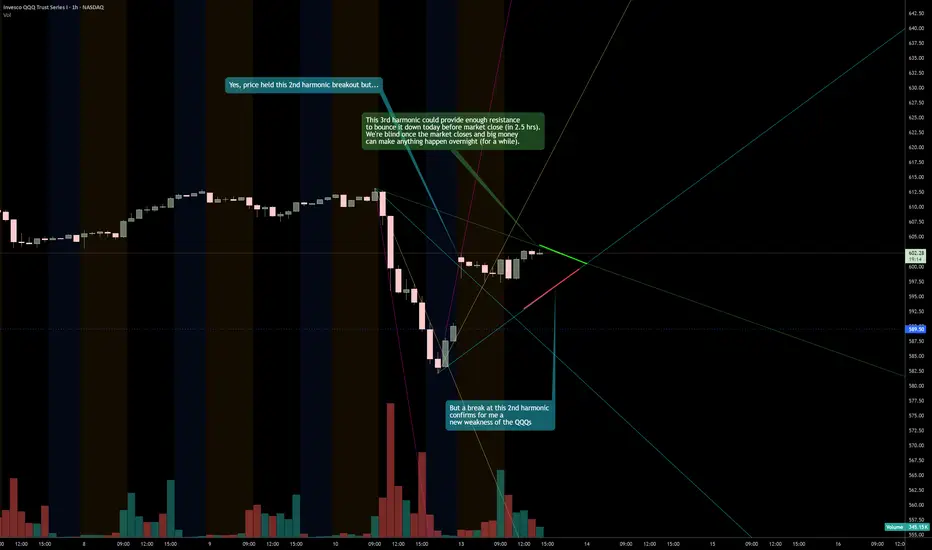
QQQ has bounced, but is it enough?Unfortunately, I think whatever happens might take place after market close today. We'll see if the QQQs continue to weaken and break down out of this fib fan wedge.
QQQ Set To Grow! BUY
My dear friends,
QQQ looks like it will make a good move, and here are the details:
The market is trading on 569.48 pivot level.
Bias - Bullish
Technical Indicators: Supper Trend generates a clear long signal while Pivot Point HL is currently determining the overall Bullish trend of the market.
Goal - 597.36
About Used Indicators:
Pivot points are a great way to identify areas of support and resistance, but they work best when combined with other kinds of technical analysis
Disclosure: I am part of Trade Nation's Influencer program and receive a monthly fee for using their TradingView charts in my analysis.
———————————
WISH YOU ALL LUCK
Don't count the bulls out just yetSPX and VIX are both hinting that Friday was a low and not necessarily the start of a crash.

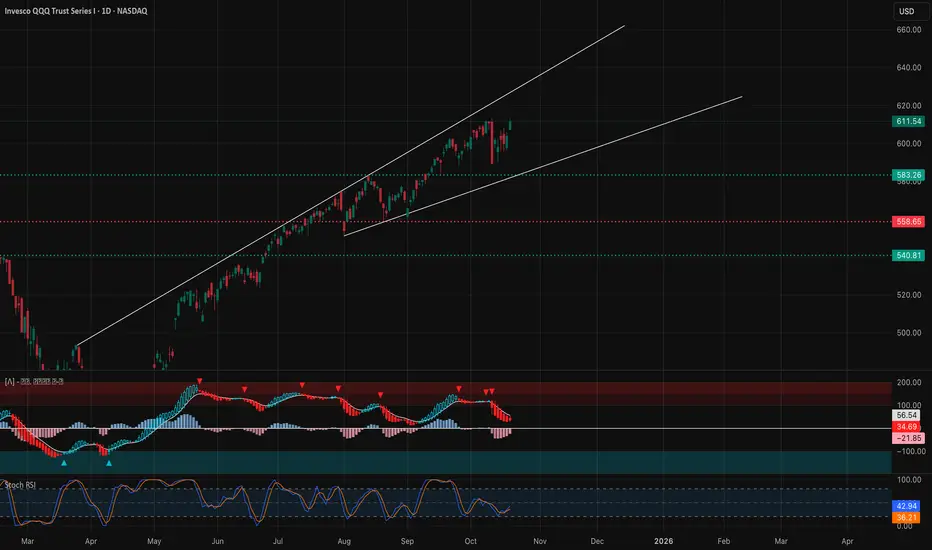
QqqBeen awhile since I went over Tech..
Let's start off with a bigger picture
Zooming out you can see that we've tagged our long term resistance since sept
Zooming in but staying on the weekly
You'll notice the reversal weekly bearish engulfing and also the volume..
The candle alone is is nasty, but that volume is a bad. The most volume we've seen since april rebound and it's bearish..
So with that being I think are headed back to 558 minimum. And also I think this moves happens before November 1st.
Nov to late Dec normally isn't to kind to bears and also we would be in the middle of tech earnings so I don't like to short the market during bullish Seasonality + earnings season.
So
Let me show you my steps one by one how I come up with my tech homework/trades
Step one Identify where your
Moving averages
Price action
Fib levels are
Start on daily time frame
I like to use my 20/50ma
The 20ma resistance will be 599-600
The 50ma support will be 582
Next I add the fib levels on my chart starting from all time high and going back lower to that launch pad at 558.. some people go back further and lower than 558 but those levels aren't ACTIONABLE for day trading or swinging weeklies. I need to know where proce can go for the next 3 sessions or next 3%
So fib levels confirm the moving average levels
As you can see 601 .786 fib level will match up closely with the 599 20sma Resistance
The 579 .382 will match nicely with the 50sma
When I say match , what I mean is let's say I short Qqq on a rebound at 599, I would be will to add another put all the way up to its next resistance at 601 if needed and then I could place a 20% loss behind 601.
Similar to if I was to buy calls at 582 50sma for a nice bounce, I would be willing to add more calls all the down to 579 gap close or .382 fib with a 20% stop below that..
This method of positioning gives you a back up plan and prevents paper hand trading.
Lastly let's look at just price action and trend lines..
For that we'll have to go down the hourly time frame (2hour chart)
Some people would argue upon seeing this trendline retest that it's a great buy area, and I would agree short term it may bounce but being up at the weekly trendline I think this summer uptrend gives way this week or next.
1hour chart
This is where I just look at price action and volume. I look for areas with a lot of traffic and heavy volume
.
Going into next week you can see its alot of support at 588 and I circled in green the previous volume that came into that area.
Overhead resistance will be the 200sma at 592 and support at 588.. over 593 and 596 comes but I expect Choppy early on between 588-592.
For a short I would only look for it below 586.00 , I know 588 is support but this is why fib levels are important for me.
586 is fib support so unless it breaks that then you may get a bear trap dip to 587 then launch back up.. only bearish below 586!!!!!!!
What I think will happen this week is a bounce back to 596 minimum and 600 max before we head lower, so unless we gap down below 586 then the move is likely to be upwards early on. If the market gaps up early Monday then wait for a pullback or fizzle out to by calls for a Tues or Wed pop higher.
I think we could see a H&S play out if price pushes back to 600
But first we need a pop, in terms of day trading you never want to open short when you see the indexes hourly RSI and Bollingerband oversold.
With the exception off thee Qqq idea .. the other trade I like is
NASDAQ:NVDA calls for a pop back to 190
Pullback to retest rectangle breakout here at 184.00.
I like calls above 185, target 190.
Over 190 and 194 comes but have a tight stop over 189 incase it can't go higher.
Entry
Above 185
Stop loss
Below 183.50
Target 190
Catch you all later , my apologies if I'm not too responsive or active lately; I've been busy.
In this post I tried to show you how I come up with my idea/ conviction. I use this method on every stock I chart and it actually only takes me 10mins max to chart something and come up with a Tradeable strategy.
You have to come up with a method/strategy in trading and charting, then apply this method every day.. you should be charting atleast 3 stocks a day with this method because that's the only way you will become proficient enough to make it. And staring at a chart because you are in a trade doesn't count. This trading and charting thing is more about repetitive discipline than intelligence. If you can't find 30mins a day to fine tune your charting craft then it will be difficult staying in this game
QQQ Snapback Rally?This chart layers in the Fibonacci pivot structure (R1, R2, S1, etc), the trend channel & the measured move from the recent high
QQQ is down roughly –5.5% from its 2025 high near $613.18, sitting at $589.50, which is directly in line with the pivot level of $587.59
This aligns with the lower edge of the prior channel & 50d MA, meaning QQQ is currently testing its equilibrium point after a strong run
The 38d up leg from August to October is typical of QQQ’s swing rhythm; retracements of 5–6% after 35–40 days of trending are very common
Statistically, a rebound to R1 ($604) is more probable than a further slide below S1 - provided QQQ holds $585 early in the week, so in the next 1-2 weeks,
R3 $630.93 is the stretch rebound target (upper Bollinger + prior high)
R2 $614.37 is the gap-fill + retest of broken wedge
R1 $604.15 is the mean-reversion target (20d MA)
P (Pivot) $587.59 is the current balance point/trendline
S1 $571.04 is the extension of a breakdown if the 50d MA fails
S2 $560.81 is a major Fib support/panic low
S3 $544.26 is the 200d MA
This selloff looks more like a “reset” within a bullish trend than a structural reversal
Volume spiked to 97M, the highest since April suggests capitulation behavior, not sustained distribution
The channel from May’s breakout remains intact; price has simply returned to the lower bound
1. Rebound Case (Preferred/60% probability)
QQQ stabilizes above $585–$587, then reclaims $595–$600
Once $600 clears, momentum accelerates to R1 ($604) & possibly R2 ($614)
The full reversion move could take 5–10 trading days
2. Continuation Case (30% probability)
Failure to hold $585 with a retest S1 ($571) within 2-4 sessions
That would fulfill the entire measured move (–6.5%–7%), after which a base forms into late October
Historically, after wedge breaks of this size, QQQ reclaims half to two-thirds of the drop

Stock Market Forecast | TSLA NVDA AAPL AMZN META MSFTStock Market Forecast | CME_MINI:NQ1! CME_MINI:ES1! SP:SPX NASDAQ:NDX
Mag 7 | TSLA NVDA AAPL AMZN META MSFT GOOGL

QQQ: Growth & Bullish Continuation
It is essential that we apply multitimeframe technical analysis and there is no better example of why that is the case than the current QQQ chart which, if analyzed properly, clearly points in the upward direction.
Disclosure: I am part of Trade Nation's Influencer program and receive a monthly fee for using their TradingView charts in my analysis.
❤️ Please, support our work with like & comment! ❤️