BCE - Bear flag, taking profits before earningsSetting up as a typical bear flag pattern on the daily chart. Earnings will likely dictate the direction moving forward - stay tuned.....
BCE.PR.J trade ideas

BCE enter LONGGood entry point for Bell telecommunications, Long term hold here. Currently trending to the upside, Pays significant dividend. Price target of $62 last seen and rejected during the week of Mon 01 May 2023.

BCE - BULLISH TO $43ish OFF THE DOUBLE BOTTOM - DAILYDaily chart shows a clear double bottom on BCE. With a high paying DIVI and Elliotts showing it in wave 4 of 5, I expect it to consolidate between the 100sma and 200sma on the daily, before breaking out or down.

BCE - Similar SituationsSimilar situations along the dotted white lines
First situation resulted in a break out
The current situation is comparable just lacking the break out phase

$BCE with a Neutral outlook following its earnings #Stocks The PEAD projected a Neutral outlook for $BCE after a Positive over reaction following its earnings release placing the stock in drift B with an expected accuracy of 77.78%.

WATCH $BCEBearish
Fundamental
- Negative PEG
- Funds distributing
- Negative earnings
TA
- Broke upward trend line with volume
- Momentum theory negative

BCE Bullish TradeOpened Position on BCE Yesterday. Not much movement. Target and stop loss on the chart

BCE Is taking off againBCE has shown moderate growth, but recently price has broken out of this large bullflag that has formed
Growth is about to increase a lot, this is a great entry point
The 200MA is always just roughly below price when it shoots up


BCE - BCE Inc - Wyckoff MethodWe are see a Wyckoff Accumulation unfolding in the BCE. We think a big swing up is coming as Phase E takes shape.
RSI is in an upward trend and sitting at a 65. We are watching RSI closely as it comes to a peak.
Price target near the resistance level of $65.00, we will look to close out the position at that price.

BCE forming an ascending triangle?BCE seems to be forming an ascending triangle. Also has tested resistance levels recently. Any ideas on where this is going?

BCE, Shorts covering - stock goes up10,7 days to cover, stock expected to rally more, first target on chart

daily analysis BCEHi friends
the daily analysis of this market shows that we must wait for the breakout of resistance at the level 54.04 after positioning ourselves as much as the buyer the next objective is 51.99


BCE View Hey people, BCE is in a bullish continuity with high volume of purchase executed, but to slow down at the end as we can see it with the shadow and it will directly turn around to start again on the rise. ECB can breakout its stabilization zone with a big possibility of reaching the new zone to fill the bullish gap.
Arriving on the last previous low point which corresponds to the catching up of losses caused previously.
Please LIKE & FOLLOW, thank you!

BCE bounce off of 200 SMA after 2x jump up and corridor downHello Traders!
The price of BCE Inc has moved in fast bullish jumps and slow bearish corridors for two times in a row now. The 200 SMA has already acted as a resistance in June and it is reasonable to believe it will act this way for the next jump as well, which is just about to happen. The first goal for a short position is the 41.83 support/resistance and the second one is 40.29. The RSI 14 is dead-centered but the MACD looks like it is about to cross under the 9 EMA, but at some point in the very near future, the price will definitely bounce off of the 200 SMA.
VF Investment cannot be held responsible for any financial damages suffered from following our well-funded but personal opinions and trading ideas.
Please, maintain proper position sizing and risk management!

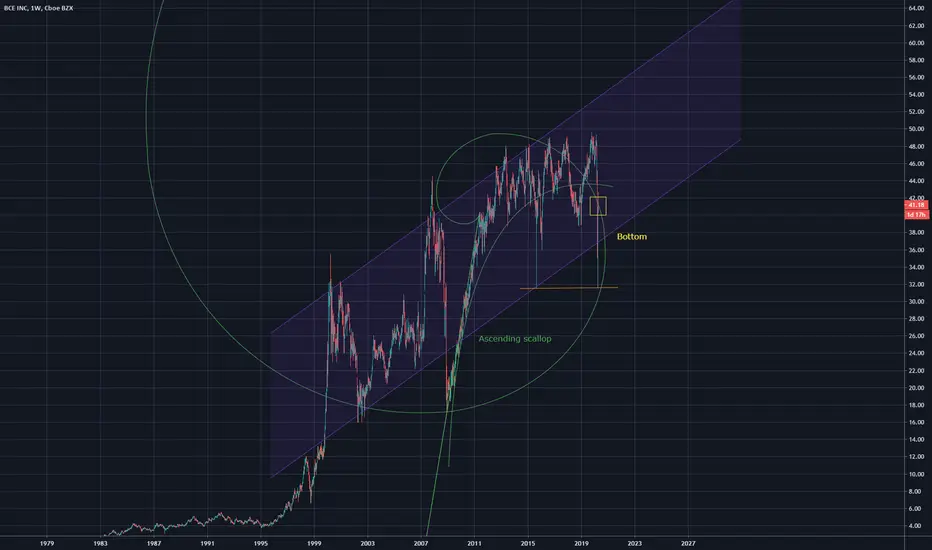
BCE PotentialPotential buy on BCE, Ascending scallop can be seen which is has a sharp bullish reversal component, if this follows through and the bottom is on the Fibonacci line, this could produce some nice results.
BCE SHORT TRADEBCE is at a strong resistance area and i expect a lot of sellers to short the stock in this area, and with the RSI being overbought i think this could be a good short trade
SL above the previous high at 49.64
