NIFTY50.....Wait for a final sell-off, part 2!Hello Traders,
as I wrote at my latest analyze: „The upside potential is limited!“
So it happened.
The NIFTY50 has declined to 25175 on a closing basis, intraday low was @24932! But I guess that it was not the final sell-off I am waiting for!
Ranging from 24736 to 24554 we see a huge „Order-blog, an
Nifty 50 Index
No trades
About Nifty 50 Index
NIFTY 50 is the main index for the National Stock Exchange of India (NSE). It tracks the performance of the top 50 stocks by market capitalization from 13 sectors of the Indian economy. With such a relatively small number of companies within the index it still represents over 60% of the free float market capitalization of the stocks listed on NSE, and serves as a benchmark for fund portfolios and index funds. The list of the NIFTY 50 Index constituents is rescheduled every 6 month.
Related indices
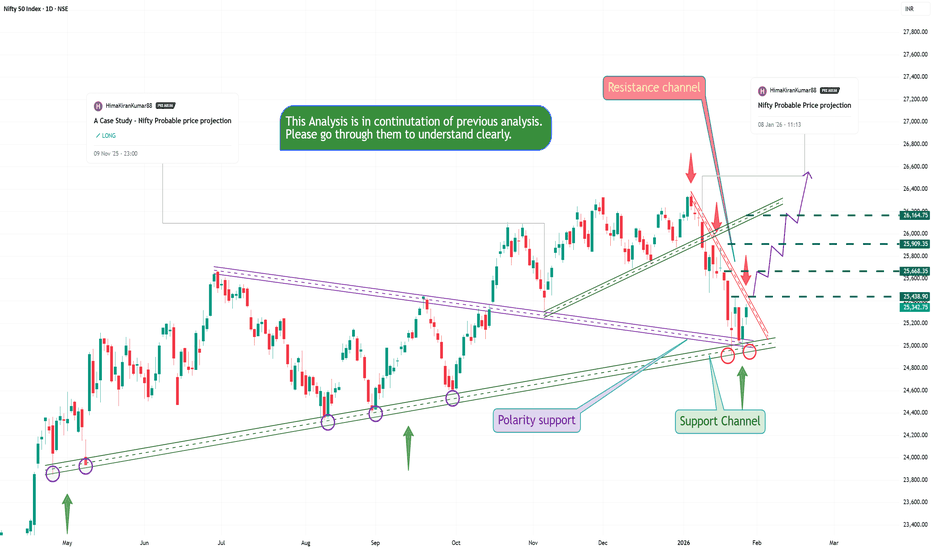
Nifty Probable price projection with levelsChart is self explanatory
Current price level is nearer to resistance channel
case 1: if price breaks may push the price higher
Since the price has taken support from strong support channel there is high probability of price going up
case 2: if price takes resistance may halt at the channel and
NIFTY Daily: Possible Reversal From Depth of CorrectionNIFTY has completed a complex corrective phase, followed by a five-wave impulsive rally. Price recently formed an EDT near all-time highs, which has now broken to the downside.
This confirms that a corrective phase has started. However, price is approaching a high-probability demand zone (depth of
Nifty 50: Bullish "Inner Trend" Breakout Setup (RR 1:4)Market Analysis
While the Nifty 50 remains compressed within a large-scale Symmetrical Triangle, a critical shift is occurring on the 15-minute timeframe. Inside this "squeeze," we observe a clear short-term uptrend characterized by consistent Higher Lows (the blue arrow path).
The "Trend Within a
NIFTY Daily + Weekly Auction Outlook | Value Migration, Decision Higher Timeframe (Weekly Auction Context)
Last week, NIFTY experienced initiative selling from higher value, resulting in a clear downward migration of weekly value. This was not panic-driven price action, but a structured auction where sellers successfully forced acceptance at lower prices.
At
NIFTY50.....Recovery possible!
Hello Traders,
the NIFTY50 is moving sideways, as before, within a range of nearly ~540 points.
This is not a good sign.
Still, we see a divergence between price and RSI (7) with the latest low on January 21th and 27th!
Momentum also is still climbing and coming back into the market.
Probably, the
Nifty 50: Dual SMC Setups for Union Budget Special Session Market Analysis
The Nifty 50 ended January 30th at 25,315 after a volatile session that saw intraday lows of 25,213.65. We are currently coiling within a major Symmetrical Triangle. While the broad trend remains corrective, the 15-minute timeframe shows an internal ascending support (the "inner tren
NF Pre-Budget Structure: Repriced Lower, Waiting for AcceptanceNIFTY | Pre-Budget Reality Check
Union Budget in 2 days. Expectations? Sky high.
But let’s pause the excitement and look at what the market has actually done, not what it hopes to do.
1. Previous month value sat higher.
2. Market failed to hold it.
3. Current month value shifted lower.
4. Accept
Waiting Without Losing Focus !Long periods of waiting in trading do not dissolve our focus; instead, they sharpen it. Patience keeps us alert and disciplined, ready to act the moment the trade presents itself. Waiting is not inactivity—it is preparation. When the trade finally comes, a focused mind recognizes it without hesitati
See all ideas
Summarizing what the indicators are suggesting.
Oscillators
Neutral
SellBuy
Strong sellStrong buy
Strong sellSellNeutralBuyStrong buy
Oscillators
Neutral
SellBuy
Strong sellStrong buy
Strong sellSellNeutralBuyStrong buy
Summary
Neutral
SellBuy
Strong sellStrong buy
Strong sellSellNeutralBuyStrong buy
Summary
Neutral
SellBuy
Strong sellStrong buy
Strong sellSellNeutralBuyStrong buy
Summary
Neutral
SellBuy
Strong sellStrong buy
Strong sellSellNeutralBuyStrong buy
Moving Averages
Neutral
SellBuy
Strong sellStrong buy
Strong sellSellNeutralBuyStrong buy
Moving Averages
Neutral
SellBuy
Strong sellStrong buy
Strong sellSellNeutralBuyStrong buy
Displays a symbol's value movements over previous years to identify recurring trends.
Frequently Asked Questions
The current value of Nifty 50 Index is 24,825.45 INR — it has fallen by −1.96% in the past 24 hours. Track the index more closely on the Nifty 50 Index chart.
Nifty 50 Index reached its highest quote on Jan 5, 2026 — 26,373.20 INR. See more data on the Nifty 50 Index chart.
The lowest ever quote of Nifty 50 Index is 279.00 INR. It was reached on Jul 3, 1990. See more data on the Nifty 50 Index chart.
Nifty 50 Index value has decreased by −2.05% in the past week, since last month it has shown a −5.08% decrease, and over the year it's increased by 5.51%. Keep track of all changes on the Nifty 50 Index chart.
The top companies of Nifty 50 Index are NSE:RELIANCE, NSE:HDFCBANK, and NSE:TCS — they can boast market cap of 205.71 B INR, 155.72 B INR, and 123.13 B INR accordingly.
The highest-priced instruments on Nifty 50 Index are NSE:MARUTI, NSE:ULTRACEMCO, and NSE:BAJAJ_AUTO — they'll cost you 14,199.00 INR, 12,284.00 INR, and 9,499.50 INR accordingly.
The champion of Nifty 50 Index is NSE:SHRIRAMFIN — it's gained 82.08% over the year.
The weakest component of Nifty 50 Index is NSE:TRENT — it's lost −35.48% over the year.
Nifty 50 Index is just a number that lets you track performance of the instruments comprising the index, so you can't invest in it directly. But you can buy Nifty 50 Index futures or funds or invest in its components.
The Nifty 50 Index is comprised of 50 instruments including NSE:RELIANCE, NSE:HDFCBANK, NSE:TCS and others. See the full list of Nifty 50 Index components to find more opportunities.


