Nifty Analysis for Oct 31, 2025Wrap-up:
Nifty has completed its internal wave 1 of major wave 3 @25845 and heading towards internal wave 2 of major wave 3 for a retracement.
What I’m Watching for Oct 31, 2025 🔍
I’ll be watching for the market to retrace upto min. 38% level i.e. 25941 and thereafter if sustain below 25904 atle
About Nifty 50 Index
NIFTY 50 is the main index for the National Stock Exchange of India (NSE). It tracks the performance of the top 50 stocks by market capitalization from 13 sectors of the Indian economy. With such a relatively small number of companies within the index it still represents over 60% of the free float market capitalization of the stocks listed on NSE, and serves as a benchmark for fund portfolios and index funds. The list of the NIFTY 50 Index constituents is rescheduled every 6 month.
Related indices

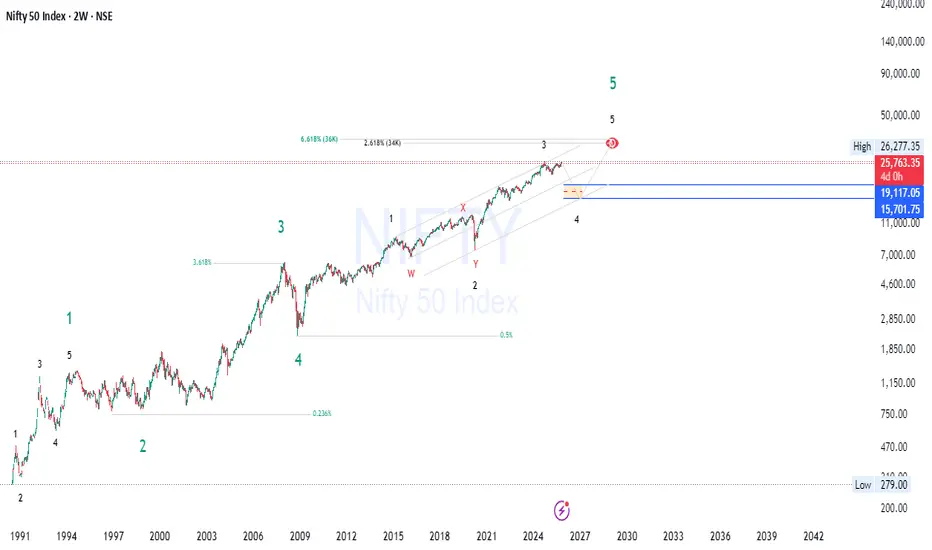
NIFTY Wave 3 Exhausted? — Wave 4 Short Setup Loading🔥 NIFTY 50 – Supercycle Wave 5 Exhaustion! Short Setup Loading ⚠️📉 🔥
Hey traders 👋 — NIFTY looks like it’s entering the most critical phase of its multi-decade Elliott Wave structure . The chart is screaming exhaustion — and all the technical confluences are lining up for a macro short setup
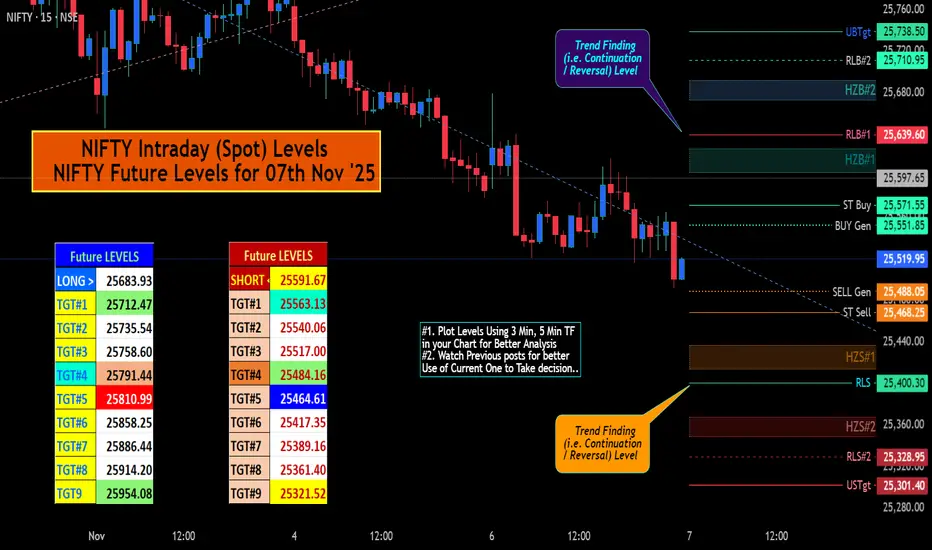
NIFTY IntraSwing (Spot) & Future Levels for 07th Nov '25✍🏼️ "Future IntraSwing Levels" mentioned in BOX format.
✍🏼️ "WEEKLY Levels" follow Sunday / Saturday's Post.
L#1: If the candle crossed & stays above the “Buy Gen”, it is treated / considered as Bullish bias.
L#2: Possibility / Probability of REVERSAL near RLB#1 & UBTgt
L#3: If the candle stays
Nifty Short term (06.11.2025 to 11.11.2025/14.11.2025) viewNifty has completed its internal wave b of major wave B @25520 and heading towards internal wave c of major wave B.
I’ll be watching for the market to sustain above 25741 atleast 15 min. for a target of 25877-25924 with a SL of 25520 (SL on 15 min. candle close).
Disclaimer: Sharing my personal m

DIAGONAL FORM HAS BEEN ESTABLISHED & HENCE THE BELOW OBSERVATThe study is based on Diagonal Pattern and as well as SMC Concepts ...
I expect that the Market will Turn around Wave-C meeting Equality Criteria... viz., Depth of Wave-C Equals, Wave-A

Nifty Analysis for Nov 06, 2025Wrap-up:
Nifty has completed its wave b of internal wave 4 @25578.
Note:- Internal wave 3 is not extended. Therefore, internal wave 5 becomes extended wave.
What I’m Watching for Nov 06, 2025 🔍
I’ll be watching for the market to retrace upto 25694-25722 for completion of internal wave 4 of maj

NIFTY50.....Two lower low's to come?Hello Traders,
the NIFTY50 is in corrective setup.
The week's high so far was @ 26104. Look, how perfect this high hits the middle line of the Order-blog and rebounded that day! It declined to 25718, what was the 0.382 Fibo of the advance, and start a second try to make higher high's, but failed!
As

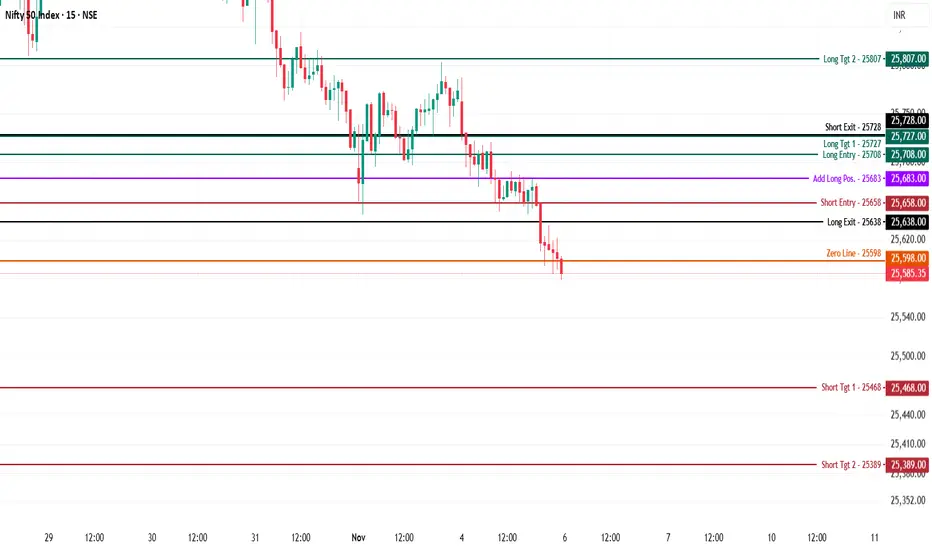
Nifty 50 Index - Intraday Technical Chart Analysis - 5th Nov.NSE:NIFTY
Nifty is under pressure, trading at 25,585 after a consistent intraday slide, breaking down below the zero line at 25,598. Momentum remains weak as price continues to create lower lows, putting the short side in clear focus for today's session.
Bearish Structure:
Short bias is active b
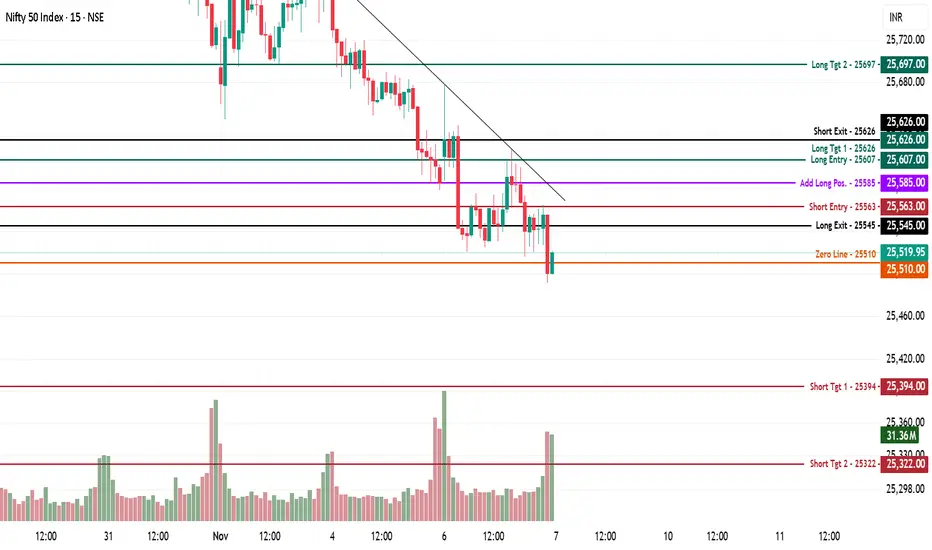
Nifty50 Index - Intraday Technical Analysis for 7th Nov., 2025NSE:NIFTY 50 Index — Chart Pathik Insights | 7-Nov-25
Nifty 50 is trading at 25,519 after another volatile open, with price sitting just above the zero line (25,510) and failing to sustain rallies into upper pivots. Downside pressure remains dominant, but intraday traders can capitalize on both qu
Nifty 50 Index – Indicates Structural Bullish ContinuationNifty 50 Index – Cup and Handle Breakout Indicates Structural Bullish Continuation
By Chart Pathik | 2 November 2025
Market Overview
The Nifty 50 has completed a long-term Cup and Handle formation, signaling the potential beginning of a new primary uptrend phase. This pattern has developed over s

See all ideas
Summarizing what the indicators are suggesting.
Oscillators
Neutral
SellBuy
Strong sellStrong buy
Strong sellSellNeutralBuyStrong buy
Oscillators
Neutral
SellBuy
Strong sellStrong buy
Strong sellSellNeutralBuyStrong buy
Summary
Neutral
SellBuy
Strong sellStrong buy
Strong sellSellNeutralBuyStrong buy
Summary
Neutral
SellBuy
Strong sellStrong buy
Strong sellSellNeutralBuyStrong buy
Summary
Neutral
SellBuy
Strong sellStrong buy
Strong sellSellNeutralBuyStrong buy
Moving Averages
Neutral
SellBuy
Strong sellStrong buy
Strong sellSellNeutralBuyStrong buy
Moving Averages
Neutral
SellBuy
Strong sellStrong buy
Strong sellSellNeutralBuyStrong buy
Displays a symbol's price movements over previous years to identify recurring trends.
Frequently Asked Questions
The current value of Nifty 50 Index is 25,492.30 INR — it has fallen by −0.07% in the past 24 hours. Track the index more closely on the Nifty 50 Index chart.
Nifty 50 Index reached its highest quote on Sep 27, 2024 — 26,277.35 INR. See more data on the Nifty 50 Index chart.
The lowest ever quote of Nifty 50 Index is 279.00 INR. It was reached on Jul 3, 1990. See more data on the Nifty 50 Index chart.
Nifty 50 Index value has decreased by −1.44% in the past week, since last month it has shown a 1.64% increase, and over the year it's increased by 4.09%. Keep track of all changes on the Nifty 50 Index chart.
The top companies of Nifty 50 Index are NSE:RELIANCE, NSE:HDFCBANK, and NSE:BHARTIARTL — they can boast market cap of 228.22 B INR, 170.68 B INR, and 134.59 B INR accordingly.
The highest-priced instruments on Nifty 50 Index are NSE:MARUTI, NSE:ULTRACEMCO, and NSE:BAJAJ_AUTO — they'll cost you 15,479.00 INR, 11,849.00 INR, and 8,721.50 INR accordingly.
The champion of Nifty 50 Index is NSE:BAJFINANCE — it's gained 52.24% over the year.
The weakest component of Nifty 50 Index is NSE:TRENT — it's lost −33.89% over the year.
Nifty 50 Index is just a number that lets you track performance of the instruments comprising the index, so you can't invest in it directly. But you can buy Nifty 50 Index futures or funds or invest in its components.
The Nifty 50 Index is comprised of 50 instruments including NSE:RELIANCE, NSE:HDFCBANK, NSE:BHARTIARTL and others. See the full list of Nifty 50 Index components to find more opportunities.