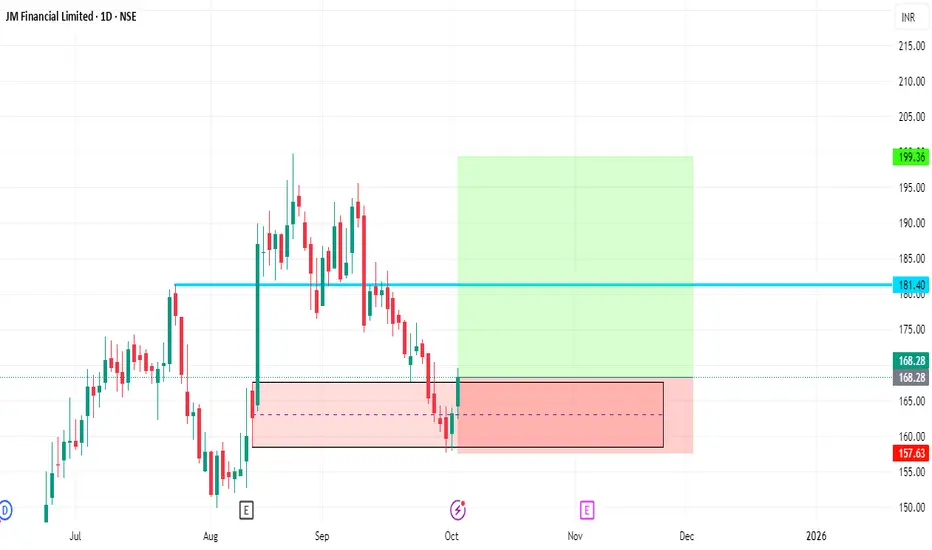
JM Financial Bullish Reversal SetupSharing a fresh daily chart setup for JM Financial Limited (NSE:JMFINANCIL). The price has recently bounced from a strong support zone in the ₹162–₹168 range, showing signs of strength after a prolonged decline. Increased volume at this level indicates renewed buyer interest.
Trade Plan
Entry Zone:
Next report date
—
Report period
—
EPS estimate
—
Revenue estimate
—
11.55 INR
8.21 B INR
42.54 B INR
508.43 M
About JM Financial Limited
Sector
Industry
Website
Headquarters
Mumbai
Founded
1973
ISIN
INE780C01023
FIGI
BBG000CTKWL6
JM Financial Ltd. operates as an investment holding company, which engages in the provision of financial services. It operates through the following segments: Investment Bank, Mortgage Lending, Alternative and Distressed Credit, and Asset Management, Wealth Management, and Securities Business (Platform AWS). The Investment Bank segment includes investment banking, institutional equities and research, private equity funds, fixed income, syndication, and finance. The Mortgage Lending segment is composed of wholesale mortgage, which includes commercial real estate lending to real estate developers, and retail mortgage including housing finance business and secured micro, small, and medium enterprises (MSME) lending. The Alternative and Distressed Credit consists of asset reconstruction business and alternative credit funds. The Asset Management, Wealth Management, and Securities Business (Platform AWS) offers investment platform for individual clients, retail wealth management business, broking, and mutual fund business. The company was founded by Nimesh Nagindas Kampani in 1973 and is headquartered in Mumbai, India.
Related stocks
JMFINANCILJMFINANCIL has given multiyear breakout, after breakout is sustaining above near breakout. its a good stock which can rewards us a lot. review this and plan according to your risk management.

JM FINANCIAL LTD S/RSupport and Resistance Levels:
Support Levels: These are price points (green line/shade) where a downward trend may be halted due to a concentration of buying interest. Imagine them as a safety net where buyers step in, preventing further decline.
Resistance Levels: Conversely, resistance levels (re

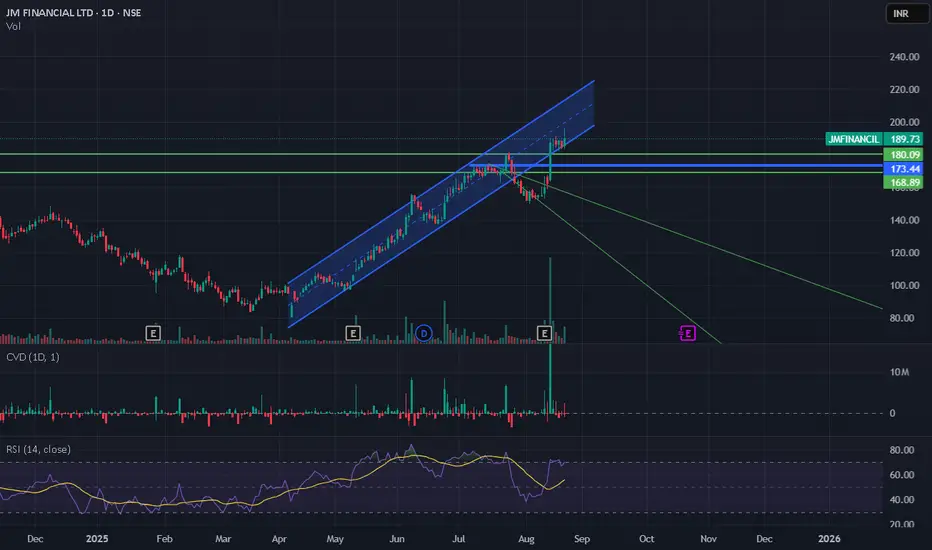
JM FINANCIAL - A PURE BUSINESS TURNAROUND STORYThis is a Pure Techno funda pick. The rational behind picking this support is the stock is on a rising channel on a daily time frame, as indicated in the chart. Secondly, Results were outstanding which came few days back, someone may argue why now, because stock is already doubled from march lows, h

JM Financial Limited
JM Financial Limited is an integrated and diversified financial services company in India, primarily involved in mortgage lending, distressed credit, asset management, investment banking, and private equity management.
Latest Share Price & Performance (as of August 14, 2025)
Current Price: ₹185.8

JMFINANCIL | Buy @180 | SL below 145 | Target 280Disclaimer:
This is not financial advice. Please do your own research or consult with a financial advisor before making any investment decisions. Investments in stocks can be risky and may result in loss of capital.
Clear breakout Clear trendline breakout and good to go long. Check volume and do your own analysis too. This is only for educational purposes.

JM FINANCIL Long consolidation BOLooks like a big cup & handle but not accurate.
The stock gave a long consolidation breakout, and volumes are also shooting up.

See all ideas
Summarizing what the indicators are suggesting.
Oscillators
Neutral
SellBuy
Strong sellStrong buy
Strong sellSellNeutralBuyStrong buy
Oscillators
Neutral
SellBuy
Strong sellStrong buy
Strong sellSellNeutralBuyStrong buy
Summary
Neutral
SellBuy
Strong sellStrong buy
Strong sellSellNeutralBuyStrong buy
Summary
Neutral
SellBuy
Strong sellStrong buy
Strong sellSellNeutralBuyStrong buy
Summary
Neutral
SellBuy
Strong sellStrong buy
Strong sellSellNeutralBuyStrong buy
Moving Averages
Neutral
SellBuy
Strong sellStrong buy
Strong sellSellNeutralBuyStrong buy
Moving Averages
Neutral
SellBuy
Strong sellStrong buy
Strong sellSellNeutralBuyStrong buy
Displays a symbol's price movements over previous years to identify recurring trends.
820JMFPL26
JM Financial Products Limited 8.2% 07-OCT-2026Yield to maturity
10.99%
Maturity date
Oct 7, 2026
957JFPL30
JM Financial Products Limited 9.57% 16-MAR-2030Yield to maturity
9.29%
Maturity date
Mar 16, 2030
934JMFCS28
JM Financial Credit Solutions Ltd. 9.34% 07-JUN-2028Yield to maturity
9.04%
Maturity date
Jun 7, 2028
981JMFCS28
JM Financial Credit Solutions Ltd. 9.81% 13-DEC-2028Yield to maturity
8.90%
Maturity date
Dec 13, 2028
875JFHLL26
JM Financial Home Loans Limited 8.75% 28-JUN-2026Yield to maturity
8.75%
Maturity date
Jun 28, 2026
10JFPL30
JM Financial Products Limited 10.0% 16-MAR-2030Yield to maturity
8.74%
Maturity date
Mar 16, 2030
791JMFPL26
JM Financial Products Limited 7.91% 07-OCT-2026Yield to maturity
8.44%
Maturity date
Oct 7, 2026
830JMFPL30
JM Financial Products Limited 8.3% 07-FEB-2030Yield to maturity
8.25%
Maturity date
Feb 7, 2030
975JMFCS28
JM Financial Credit Solutions Ltd. 9.75% 07-JUN-2028Yield to maturity
7.62%
Maturity date
Jun 7, 2028
1025JFCS28
JM Financial Credit Solutions Ltd. 10.25% 13-DEC-2028Yield to maturity
7.32%
Maturity date
Dec 13, 2028
85JMFCSL31
JM Financial Credit Solutions Ltd. 8.5% 18-JUL-2031Yield to maturity
6.56%
Maturity date
Jul 18, 2031
See all JMFINANCIL bonds
MOSMALL250
Motilal Oswal Nifty Smallcap 250 ETF Units Exchange Traded FundWeight
0.38%
Market value
53.19 K
USD
Explore more ETFs
Frequently Asked Questions
The current price of JMFINANCIL is 172.87 INR — it has decreased by −0.86% in the past 24 hours. Watch JM Financial Limited stock price performance more closely on the chart.
Depending on the exchange, the stock ticker may vary. For instance, on NSE exchange JM Financial Limited stocks are traded under the ticker JMFINANCIL.
JMFINANCIL stock has risen by 0.49% compared to the previous week, the month change is a −2.72% fall, over the last year JM Financial Limited has showed a 11.89% increase.
JMFINANCIL reached its all-time high on Aug 22, 2025 with the price of 199.80 INR, and its all-time low was 11.35 INR and was reached on May 31, 2012. View more price dynamics on JMFINANCIL chart.
See other stocks reaching their highest and lowest prices.
See other stocks reaching their highest and lowest prices.
JMFINANCIL stock is 4.06% volatile and has beta coefficient of 2.44. Track JM Financial Limited stock price on the chart and check out the list of the most volatile stocks — is JM Financial Limited there?
Today JM Financial Limited has the market capitalization of 169.78 B, it has increased by 10.21% over the last week.
Yes, you can track JM Financial Limited financials in yearly and quarterly reports right on TradingView.
JM Financial Limited is going to release the next earnings report on Nov 6, 2025. Keep track of upcoming events with our Earnings Calendar.
JMFINANCIL net income for the last quarter is 4.54 B INR, while the quarter before that showed 2.10 B INR of net income which accounts for 116.58% change. Track more JM Financial Limited financial stats to get the full picture.
Yes, JMFINANCIL dividends are paid annually. The last dividend per share was 2.70 INR. As of today, Dividend Yield (TTM)% is 1.52%. Tracking JM Financial Limited dividends might help you take more informed decisions.
JM Financial Limited dividend yield was 2.81% in 2024, and payout ratio reached 31.42%. The year before the numbers were 2.68% and 46.61% correspondingly. See high-dividend stocks and find more opportunities for your portfolio.
As of Oct 14, 2025, the company has 4.68 K employees. See our rating of the largest employees — is JM Financial Limited on this list?
EBITDA measures a company's operating performance, its growth signifies an improvement in the efficiency of a company. JM Financial Limited EBITDA is 15.56 B INR, and current EBITDA margin is 64.08%. See more stats in JM Financial Limited financial statements.
Like other stocks, JMFINANCIL shares are traded on stock exchanges, e.g. Nasdaq, Nyse, Euronext, and the easiest way to buy them is through an online stock broker. To do this, you need to open an account and follow a broker's procedures, then start trading. You can trade JM Financial Limited stock right from TradingView charts — choose your broker and connect to your account.
Investing in stocks requires a comprehensive research: you should carefully study all the available data, e.g. company's financials, related news, and its technical analysis. So JM Financial Limited technincal analysis shows the buy rating today, and its 1 week rating is buy. Since market conditions are prone to changes, it's worth looking a bit further into the future — according to the 1 month rating JM Financial Limited stock shows the buy signal. See more of JM Financial Limited technicals for a more comprehensive analysis.
If you're still not sure, try looking for inspiration in our curated watchlists.
If you're still not sure, try looking for inspiration in our curated watchlists.