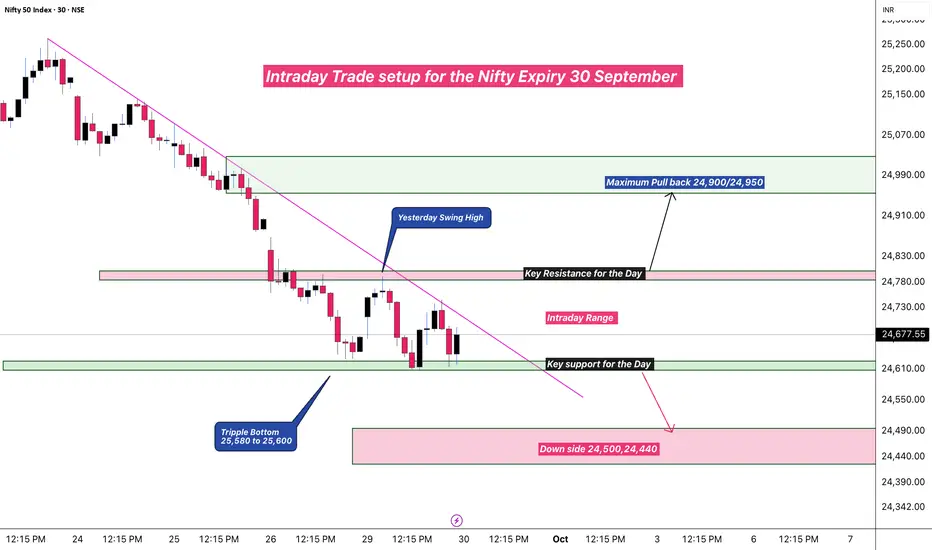
Expiry Trade Setup : 30 September 📊 Nifty Expiry Day Analysis
I’ve prepared a detailed trade setup for today’s Nifty expiry session. The key resistance zone is placed around 24,800, while 24,600 acts as a crucial lower boundary.
It’s advisable to avoid trading within the 24,600–24,800 range, as the market may remain choppy and dire
About Nifty 50 Index
NIFTY 50 is the main index for the National Stock Exchange of India (NSE). It tracks the performance of the top 50 stocks by market capitalization from 13 sectors of the Indian economy. With such a relatively small number of companies within the index it still represents over 60% of the free float market capitalization of the stocks listed on NSE, and serves as a benchmark for fund portfolios and index funds. The list of the NIFTY 50 Index constituents is rescheduled every 6 month.
Related indices
Ready for Bull run NIFTY 50Guys be ready for Bull Run coming back on Nifty 50 from tomorrow onwards. Enjoy profit

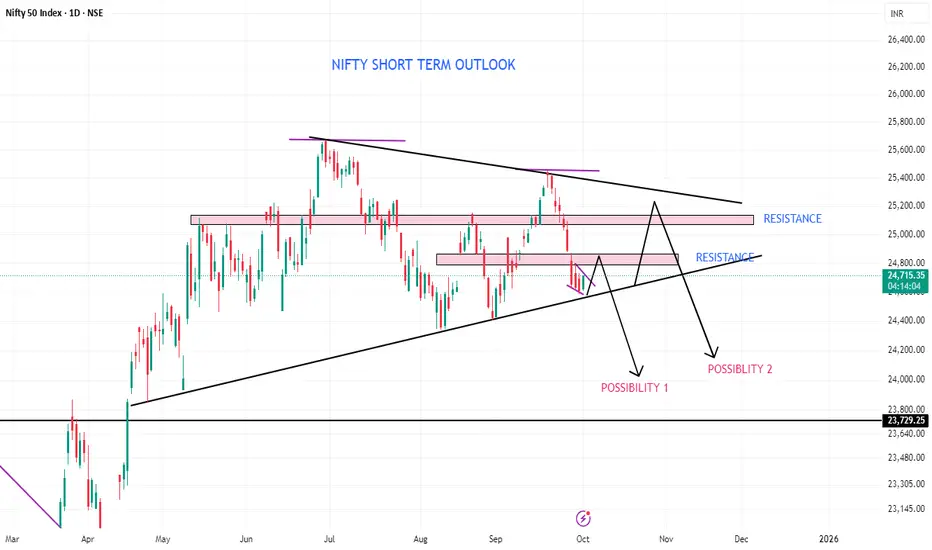
NIFTY SHORT TERM OUTLOOK Nifty at present facing resistance around 25200-25350...last year nifty fallen in September by making H&S pattern. Both shoulders creating strong resistance at 25200-25350 zone... In short term now nifty making symmetrical triangle in addition to H&S .. Nifty has strong resistance around 24850.. So
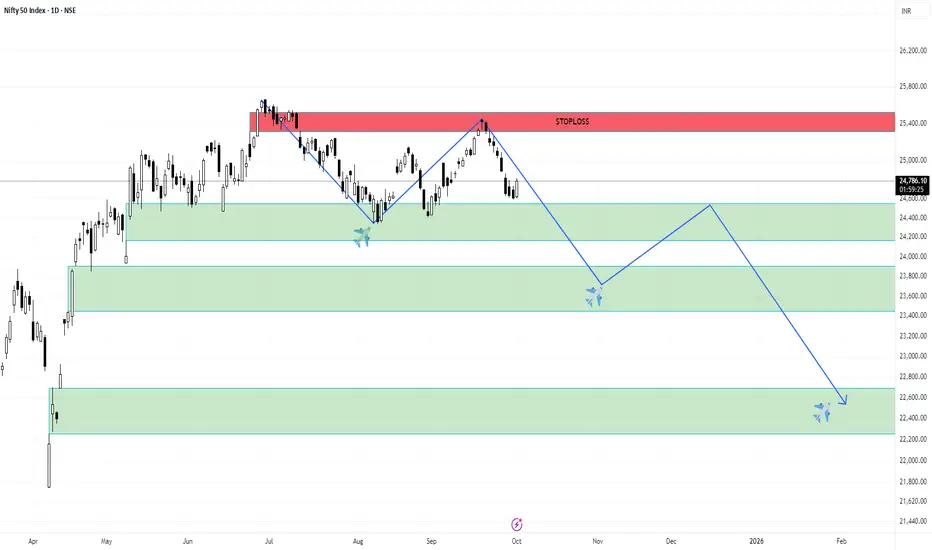
NIFTY DAILY CANDLE VIEWAfter long time analysing nifty daily candle. Market gives many opportunity to enter in this market but not only for profit or loss. They can check your discipline and many more.
We can plan our trade with risk and reward only. wait for your level and calculate your risk than enter in trade.
nifty50 Analysis | be careful from trapMarket Outlook
Support Zone: 24,550 – 24,400
Resistance Levels: 24,750 – 24,790 and 24,960 – 24,990
A falling wedge pattern is currently forming just above the support zone. The key level to watch is 24,590, as a sweep of this low appears likely. However, before a potential breakdown, price may f

NIFTY50.....Sideways trading range!Hello Traders,
the NIFTY50 rose 239 points or 0.97% for the week.
It opened with a gap to the upside, but closed it immediately! Overall, the N50 is trading within a sideways range, from 25449 to 242587.
Chart analysis:
If the N50 extends its short-term gains, the target range is around 25449 and ab

Strong Base Formed ! Nifty Positioned for Explosive Move This is the daily timeframe chart of Nifty 50.
Nifty 50 is sustaining above the LOP support zone around 24,400–24,500. The index has formed an ascending broadening wedge pattern at this support and appears to be completing the last leg of the structure.
Support Zone: 24,500–24,550
Resistance Zone:

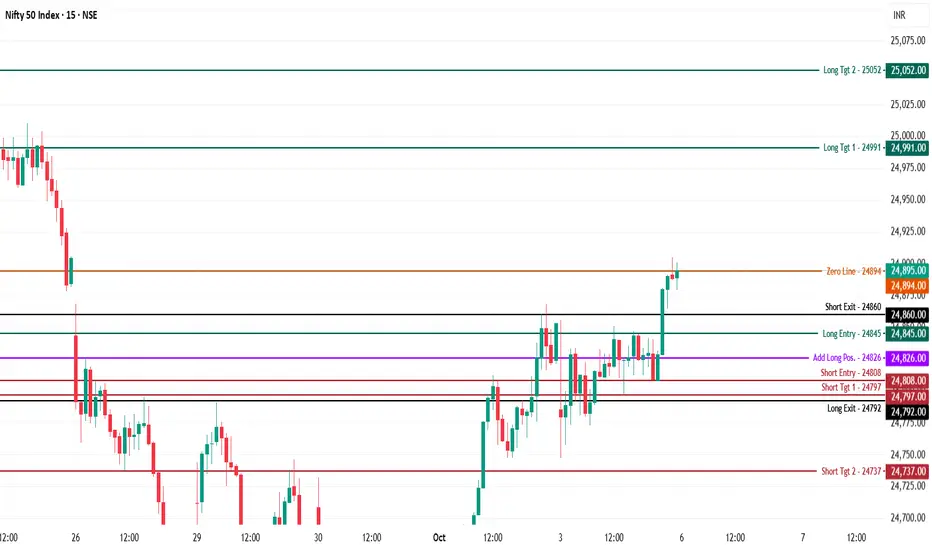
Nifty 50 Index – Intraday Analysis - 6th of Oct., 2025NSE:NIFTY
Nifty is trading at 24,895, and has just tested the zero line after a strong upward momentum surge, consolidating near key resistance after a breakout move.
Bullish (Long) Setup
Long Entry (24,845):
Fresh longs can be initiated above 24,845 as bullish momentum takes charge after recla
Nifty Levels for Monday October 6th 2025Nifty levels to trade are 25000 to 24900 if you find any rejection short here to targets below 24800,24750,24650,24600 and 24500.
Look for price sustaining above 25k for 1st hour after market open if price sustains above 25k long for the targets of 25100,25200,25250,25300 and 25400 above.
Market

Nifty 50: Genuine Rally or Selloff Setup?The Nifty 50 Index went up, but this upward move was likely just a temporary correction, not the start of a new, long-term rise.
Bottom (Wave W): The index first hit a low around 24,377
Bounce (Wave X): It then went up to a high near 25,448. This rise was a clear, three-part corrective move (lik

See all ideas
Summarizing what the indicators are suggesting.
Oscillators
Neutral
SellBuy
Strong sellStrong buy
Strong sellSellNeutralBuyStrong buy
Oscillators
Neutral
SellBuy
Strong sellStrong buy
Strong sellSellNeutralBuyStrong buy
Summary
Neutral
SellBuy
Strong sellStrong buy
Strong sellSellNeutralBuyStrong buy
Summary
Neutral
SellBuy
Strong sellStrong buy
Strong sellSellNeutralBuyStrong buy
Summary
Neutral
SellBuy
Strong sellStrong buy
Strong sellSellNeutralBuyStrong buy
Moving Averages
Neutral
SellBuy
Strong sellStrong buy
Strong sellSellNeutralBuyStrong buy
Moving Averages
Neutral
SellBuy
Strong sellStrong buy
Strong sellSellNeutralBuyStrong buy
Displays a symbol's price movements over previous years to identify recurring trends.
Frequently Asked Questions
The current value of Nifty 50 Index is 25,077.65 INR — it has risen by 0.74% in the past 24 hours. Track the index more closely on the Nifty 50 Index chart.
Nifty 50 Index reached its highest quote on Sep 27, 2024 — 26,277.35 INR. See more data on the Nifty 50 Index chart.
The lowest ever quote of Nifty 50 Index is 279.00 INR. It was reached on Jul 3, 1990. See more data on the Nifty 50 Index chart.
Nifty 50 Index value has increased by 1.41% in the past week, since last month it has shown a 1.04% increase, and over the year it's decreased by −0.41%. Keep track of all changes on the Nifty 50 Index chart.
The top companies of Nifty 50 Index are NSE:RELIANCE, NSE:HDFCBANK, and NSE:BHARTIARTL — they can boast market cap of 207.87 B INR, 166.95 B INR, and 121.70 B INR accordingly.
The highest-priced instruments on Nifty 50 Index are NSE:MARUTI, NSE:ULTRACEMCO, and NSE:BAJAJ_AUTO — they'll cost you 15,998.00 INR, 12,055.00 INR, and 8,792.00 INR accordingly.
The champion of Nifty 50 Index is NSE:BEL — it's gained 48.28% over the year.
The weakest component of Nifty 50 Index is NSE:TRENT — it's lost −35.80% over the year.
Nifty 50 Index is just a number that lets you track performance of the instruments comprising the index, so you can't invest in it directly. But you can buy Nifty 50 Index futures or funds or invest in its components.
The Nifty 50 Index is comprised of 50 instruments including NSE:RELIANCE, NSE:HDFCBANK, NSE:BHARTIARTL and others. See the full list of Nifty 50 Index components to find more opportunities.