NIFTY50.....Two lower low's to come?Hello Traders,
the NIFTY50 is in corrective setup.
The week's high so far was @ 26104. Look, how perfect this high hits the middle line of the Order-blog and rebounded that day! It declined to 25718, what was the 0.382 Fibo of the advance, and start a second try to make higher high's, but failed!
As
About Nifty 50 Index
NIFTY 50 is the main index for the National Stock Exchange of India (NSE). It tracks the performance of the top 50 stocks by market capitalization from 13 sectors of the Indian economy. With such a relatively small number of companies within the index it still represents over 60% of the free float market capitalization of the stocks listed on NSE, and serves as a benchmark for fund portfolios and index funds. The list of the NIFTY 50 Index constituents is rescheduled every 6 month.
Related indices

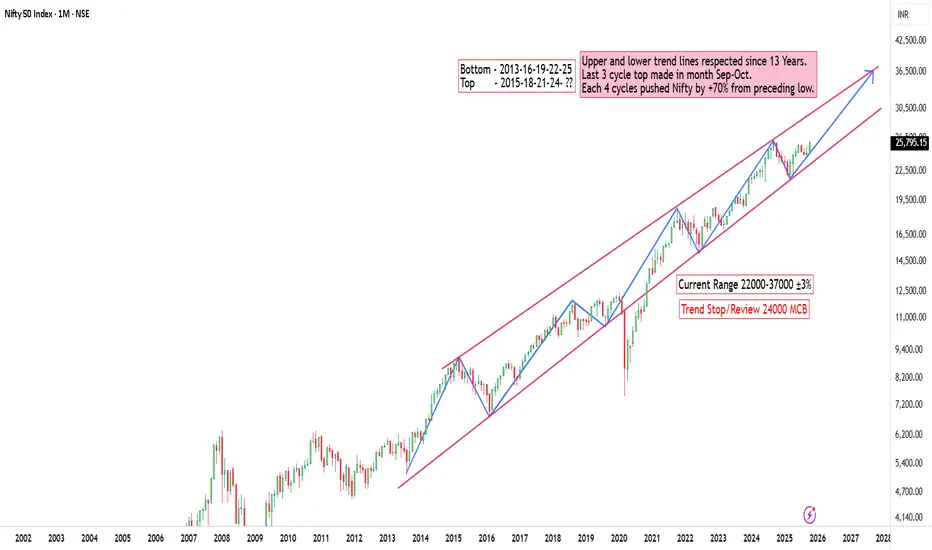
Nifty50 next 2 Years Overview based on last 13 years trendNifty50 next 2 Years Overview based last last 13 years trend
Nifty Analysis for Oct 31, 2025Wrap-up:
Nifty has completed its internal wave 1 of major wave 3 @25845 and heading towards internal wave 2 of major wave 3 for a retracement.
What I’m Watching for Oct 31, 2025 🔍
I’ll be watching for the market to retrace upto min. 38% level i.e. 25941 and thereafter if sustain below 25904 atle

NIFTY50.....Touched my target range! And now?Hello Traders,
Thank you to everyone sent me get-well wishes.
The NIFTY50 has touched my target range @26104 and after, it reversed.
The week closed @25795. It has left a candle with a long wick and a small red body, indicating that the most trading occurred in that area!
Chart analysis:
First; th

Will Nifty Continue the Momentum After Today’s Sideways Move?The Chart Talk – What Market Told Us Today By M Dhanushkumar
Nifty opened with a strong gap-up and managed to close above the 15-minute resistance zone, showing early strength in the market.
However, after the initial move, price stayed sideways throughout the day, indicating consolidation near the

Can Nifty Turn Bullish After Today’s Sideways Breakdown?Today, the market broke the sideways range on the upside but soon faced rejection at resistance.
After that, it reversed sharply and broke the same sideways zone on the downside, showing clear intraday weakness.
Now, the key question is — was today’s move just a trap or a genuine shift in sentiment

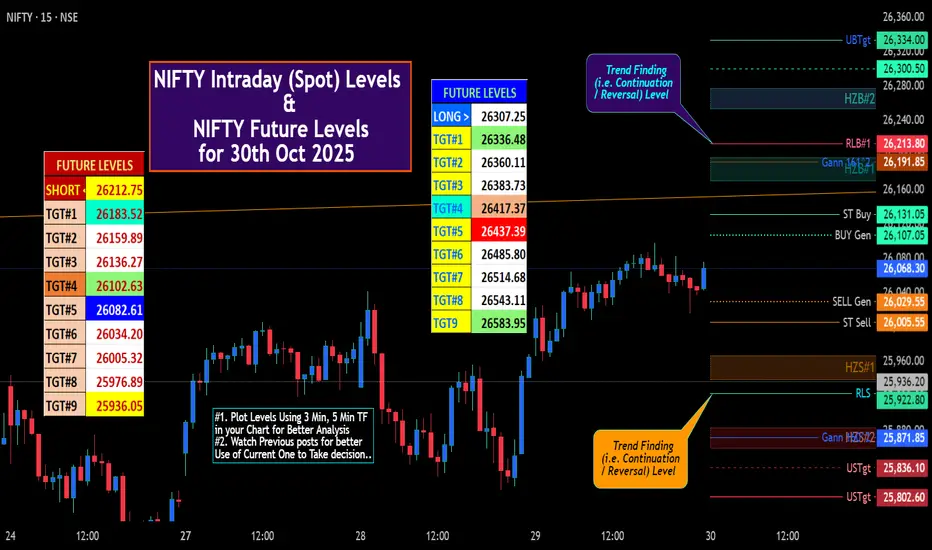
NIFTY IntraSwing (Spot) Levels & Future Levels for 30th Oct '25🚀 "NIFTY Future Levels for 30th Oct 2025" mentioned in BOX format.
🌡️Plot Levels Using 3 Min, 5 Min Time frame in your Chart for Better Analysis
L#1: If the candle crossed & stays above the “Buy Gen”, it is treated / considered as Bullish bias.
L#2: Possibility / Probability of REVERSAL near R
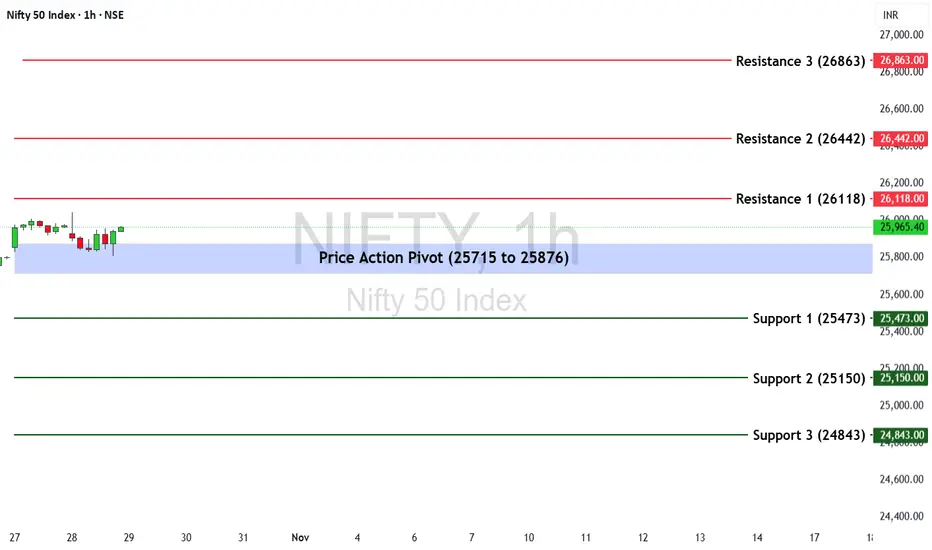
Nifty 50 Weekly Outlook (27th Oct – 31st Oct 2025)The Nifty 50 Index last week ended at 25,795.15, posting a +0.33% gain. The index continues to consolidate near recent highs, signaling a potential directional move in the upcoming week.
🔹 Key Levels for the Upcoming Week
📌 Price Action Pivot Zone:
25,715 to 25,876 – This blue-shaded zone represe
Nifty Hits the 26K Wall—Market Awaits the Spark for a Big LeapAfter six consecutive gains, the Indian benchmark Nifty paused on Friday and slipped slightly from its recent highs, mainly due to profit booking.
Despite the mild correction, the index still ended the week in green, registering modest gains — a sign that the broader market sentiment remains upbeat

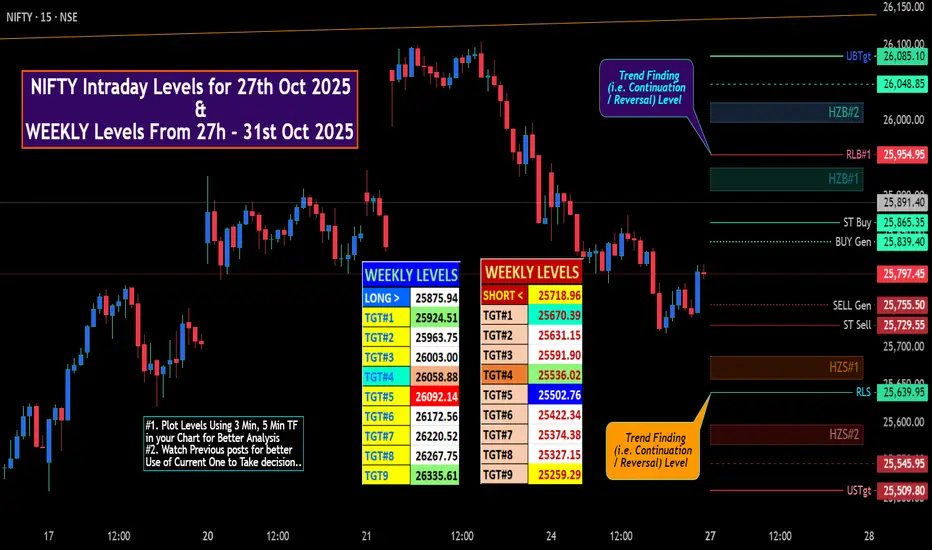
NIFTY Intraday & Swing Levels for 27th Oct 2025🚀 "WEEKLY Levels" mentioned in BOX format.
🌡️Plot Levels Using 3 Min, 5 Min Time frame in your Chart for Better Analysis
L#1: If the candle crossed & stays above the “Buy Gen”, it is treated / considered as Bullish bias.
L#2: Possibility / Probability of REVERSAL near RLB#1 & UBTgt
L#3: If the
See all ideas
Summarizing what the indicators are suggesting.
Oscillators
Neutral
SellBuy
Strong sellStrong buy
Strong sellSellNeutralBuyStrong buy
Oscillators
Neutral
SellBuy
Strong sellStrong buy
Strong sellSellNeutralBuyStrong buy
Summary
Neutral
SellBuy
Strong sellStrong buy
Strong sellSellNeutralBuyStrong buy
Summary
Neutral
SellBuy
Strong sellStrong buy
Strong sellSellNeutralBuyStrong buy
Summary
Neutral
SellBuy
Strong sellStrong buy
Strong sellSellNeutralBuyStrong buy
Moving Averages
Neutral
SellBuy
Strong sellStrong buy
Strong sellSellNeutralBuyStrong buy
Moving Averages
Neutral
SellBuy
Strong sellStrong buy
Strong sellSellNeutralBuyStrong buy
Displays a symbol's price movements over previous years to identify recurring trends.
Frequently Asked Questions
The current value of Nifty 50 Index is 25,722.10 INR — it has fallen by −0.60% in the past 24 hours. Track the index more closely on the Nifty 50 Index chart.
Nifty 50 Index reached its highest quote on Sep 27, 2024 — 26,277.35 INR. See more data on the Nifty 50 Index chart.
The lowest ever quote of Nifty 50 Index is 279.00 INR. It was reached on Jul 3, 1990. See more data on the Nifty 50 Index chart.
Nifty 50 Index value has decreased by −0.82% in the past week, since last month it has shown a 4.47% increase, and over the year it's increased by 5.64%. Keep track of all changes on the Nifty 50 Index chart.
The top companies of Nifty 50 Index are NSE:RELIANCE, NSE:HDFCBANK, and NSE:BHARTIARTL — they can boast market cap of 227.35 B INR, 173.08 B INR, and 132.90 B INR accordingly.
The highest-priced instruments on Nifty 50 Index are NSE:MARUTI, NSE:ULTRACEMCO, and NSE:BAJAJ_AUTO — they'll cost you 16,186.00 INR, 11,947.00 INR, and 8,892.50 INR accordingly.
The champion of Nifty 50 Index is NSE:BAJFINANCE — it's gained 50.06% over the year.
The weakest component of Nifty 50 Index is NSE:TRENT — it's lost −35.33% over the year.
Nifty 50 Index is just a number that lets you track performance of the instruments comprising the index, so you can't invest in it directly. But you can buy Nifty 50 Index futures or funds or invest in its components.
The Nifty 50 Index is comprised of 50 instruments including NSE:RELIANCE, NSE:HDFCBANK, NSE:BHARTIARTL and others. See the full list of Nifty 50 Index components to find more opportunities.