CRUDE OILPreferably suitable for scalping and accurate as long as you watch carefully the price action with the drawn areas.
With your likes and comments, you give me enough energy to provide the best analysis on an ongoing basis.
And if you needed any analysis that was not on the page, you can ask me with a comment or a personal message.
Enjoy Trading ;)
Trade ideas

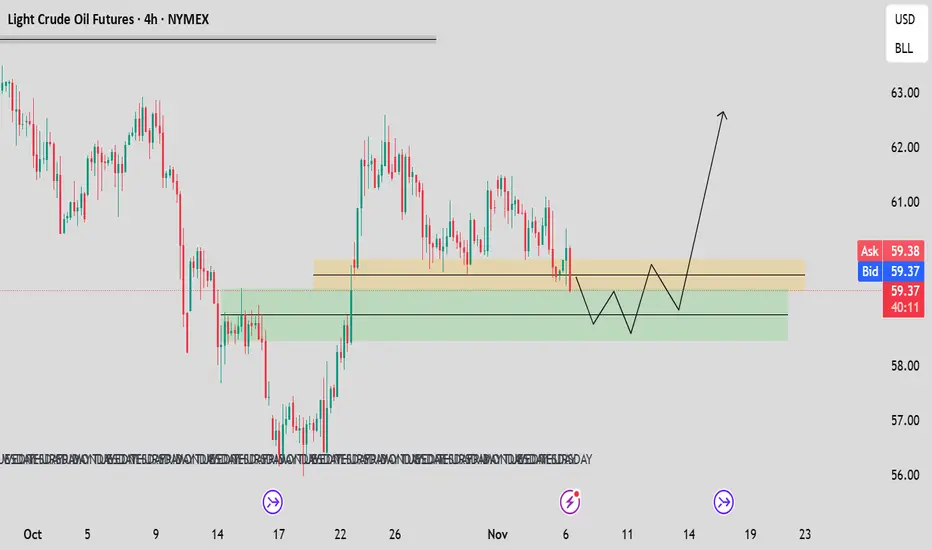
crude oil probable price movement1. price looks strong may go up
2. if price doesnt sustain higher levels may go down

CRUDE OILPreferably suitable for scalping and accurate as long as you watch carefully the price action with the drawn areas.
With your likes and comments, you give me enough energy to provide the best analysis on an ongoing basis.
And if you needed any analysis that was not on the page, you can ask me with a comment or a personal message.
Enjoy Trading ;)

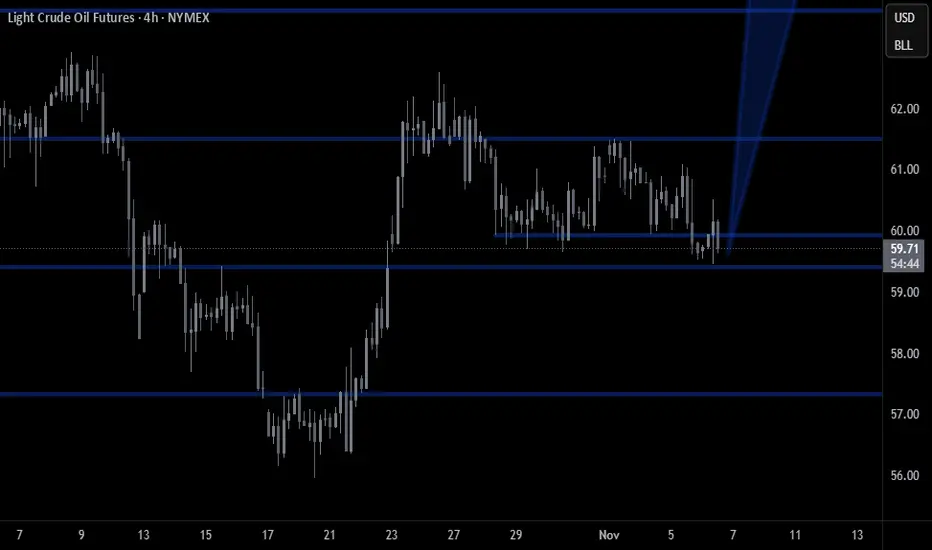
WTI Crud Oil Holds Above $60Crude oil closed higher for a third day on Friday and is showing signs of stability above $60. This suggests the retracement from 62.59 is complete and momentum is preparing to realign itself with the rally from the 55.96 low.
While resistance is nearby - from the 200-day EMA and October's high-volume node (HVN), I suspect prices will eventually break above them. Bulls could consider dips towards last week's low to increase the potential reward to risk ratio, on the assumption of a retest of the 62.59 high and potential break above it.
Matt Simpson, Market Analyst at City Index

Crude oil waiting for longsCrude oil weekly chart.
After taking lower high weekly candle, price run $+61 for that dealing range I was looking for price retrace to fibo 50% level, we are almost there, I will look for lower t market structure break for confirmation, after that will long oil

CRUDE OILPreferably suitable for scalping and accurate as long as you watch carefully the price action with the drawn areas.
With your likes and comments, you give me enough energy to provide the best analysis on an ongoing basis.
And if you needed any analysis that was not on the page, you can ask me with a comment or a personal message.
Enjoy Trading ;)
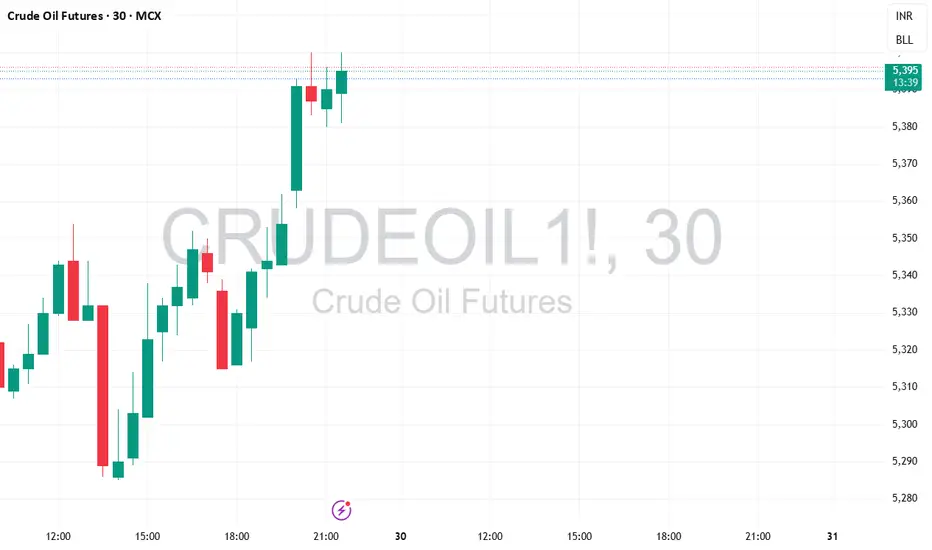
Crude Oil November Contract Breakdown Setup – 5450 PE in PlayMCX Crude Oil – November Contract
CMP: ₹5398
Bearish view
Holding 5450 Put Option (Expiry: 17 Nov 2025)
Avg Price: ₹251.50
Target: ₹320 to ₹325
Target valid till 14 Nov 2025
Tracking price action closely. Will reassess if momentum fades or structure breaks.
#CrudeOilOptions #MCX #OptionsTrading #TradeSetup #PriceAction #TradingViewIndia #DerivativeStrategy #PutOption
Potential Downside Risk in Crude Oil Crude oil futures have been limping for more than a year, and some traders could think they’re ready to falter.
The first pattern on today’s chart is the series of lower highs since June. The 50-day simple moving average (SMA) has also remained below the 200-day SMA. Those signals may be consistent with a longer-term downtrend.
Second, you have another series of lower highs since October 24. CL1! has stayed above the October 23 low of $59.64 in that time, resulting in a potentially bearish descending triangle.
Third, traders may eye the April 9 low of 55.12 if the triangle breaks.
Finally, stochastics recently hit an overbought condition and are now turning lower.
TradeStation has, for decades, advanced the trading industry, providing access to stocks, options and futures. If you're born to trade, we could be for you. See our Overview for more.
Past performance, whether actual or indicated by historical tests of strategies, is no guarantee of future performance or success. There is a possibility that you may sustain a loss equal to or greater than your entire investment regardless of which asset class you trade (equities, options or futures); therefore, you should not invest or risk money that you cannot afford to lose. Online trading is not suitable for all investors. View the document titled Characteristics and Risks of Standardized Options at www.TradeStation.com . Before trading any asset class, customers must read the relevant risk disclosure statements on www.TradeStation.com . System access and trade placement and execution may be delayed or fail due to market volatility and volume, quote delays, system and software errors, Internet traffic, outages and other factors.
Securities and futures trading is offered to self-directed customers by TradeStation Securities, Inc., a broker-dealer registered with the Securities and Exchange Commission and a futures commission merchant licensed with the Commodity Futures Trading Commission). TradeStation Securities is a member of the Financial Industry Regulatory Authority, the National Futures Association, and a number of exchanges.
TradeStation Securities, Inc. and TradeStation Technologies, Inc. are each wholly owned subsidiaries of TradeStation Group, Inc., both operating, and providing products and services, under the TradeStation brand and trademark. When applying for, or purchasing, accounts, subscriptions, products and services, it is important that you know which company you will be dealing with. Visit www.TradeStation.com for further important information explaining what this means.

Crude Oil is InflationOne of the best ways to gauge where inflation is heading is by tracking the relationship between crude oil prices and the U.S. Consumer Price Index (CPI).
If we take a moment to observe their movement from the 1980s to today, we can see that they have generally moved in tandem. The year of their peaks and troughs are in synchronization.
So, who is leading whom?
Is it the inflation data that drive crude oil prices higher or lower — or is it crude oil prices that influence the inflation trend?
WTI Crude Oil Futures & Options
Ticker: MCL
Minimum fluctuation:
0.01 per barrel = $1.00
Disclaimer:
• What presented here is not a recommendation, please consult your licensed broker.
• Our mission is to create lateral thinking skills for every investor and trader, knowing when to take a calculated risk with market uncertainty and a bolder risk when opportunity arises.
CME Real-time Market Data help identify trading set-ups in real-time and express my market views. If you have futures in your trading portfolio, you can check out on CME Group data plans available that suit your trading needs www.tradingview.com

Sell crude oil around 62.00, with a target of 60.00-58.00Crude Oil Market Analysis:
Crude oil has been trending downwards with fluctuations recently. Our strategy remains to sell at higher prices; any rebound is an opportunity to sell. Today, watch for opportunities to sell around 62.00. Currently, the interest rate cut appears to be having an effective impact on crude oil. Our strategy remains unchanged: if it breaks below 60.00, consider selling on any small rebound.
Fundamental Analysis:
The Federal Reserve cut interest rates by 25 basis points as expected. The Fed lowered its benchmark interest rate by 25 basis points to 3.75%-4.00%, marking the second consecutive rate cut at its meeting, in line with market expectations...
Trading Recommendation:
Sell crude oil around 62.00, with a target of 60.00-58.00.

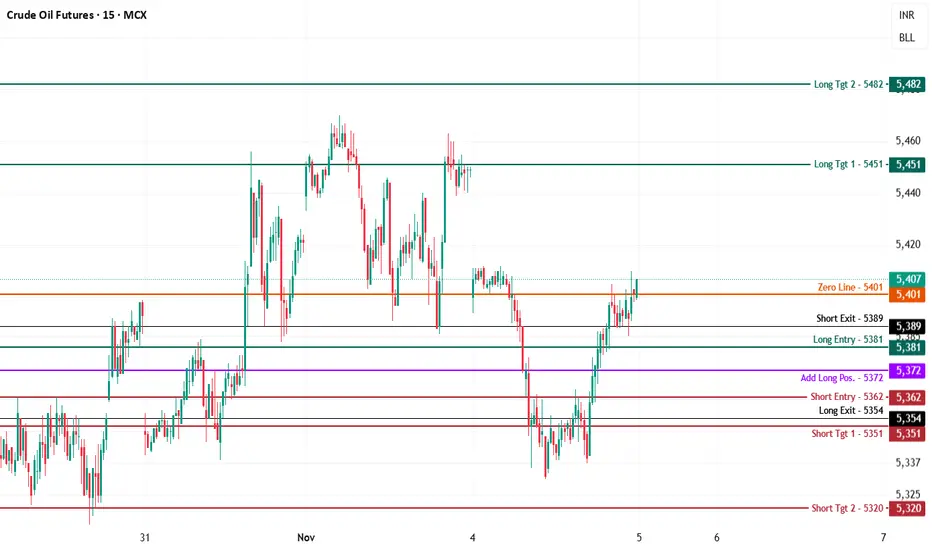
Crude Oil MCX Future Intraday Technical Analysis for 5th Nov.MCX:CRUDEOIL1!
MCX Crude Oil Futures — Chart Pathik Insights | 5-Nov-25
Crude Oil is climbing modestly, trading at 5,407 and pressing just above the zero line (5,401) after a determined recovery from late-session lows. The market is now balancing just under key resistance, and volatility can pick up with any strong push past the current pivots.
Bullish Structure:
Long setups activate above 5,381, with confidence growing if price holds above the zero line and works through 5,407.
Upside Levels:
5,451: First booking or resistance zone for bulls.
5,482: High extension if breakout momentum builds intraday.
Risk Management: Longs should use the add-long (5,372) or recent swing lows as stops in case the uptrend fails to sustain.
Bearish Structure:
Short action becomes valid below 5,362, especially if price sharply rejects resistance at the current band or fails to sustain the breakout.
Downside Targets:
5,351: Logical quick profit or scalp target.
5,320: Extension for deeper unwinding.
Risk Management: Shorts should be protected above 5,381, or covered if the market decisively pushes back above the zero line.
Chop/Neutral View:
With 5,401 as the pivot, expect further volatility and whipsaw action near the zero line—wait for breakout confirmation before scaling up exposure.
Keep these levels mapped for decisive entries and adaptive risk control. If Chart Pathik pivots clarify your session, boost, comment, and share to support the trading community.
Follow for objective structure, mapped logic, and continuous learning, every market day.
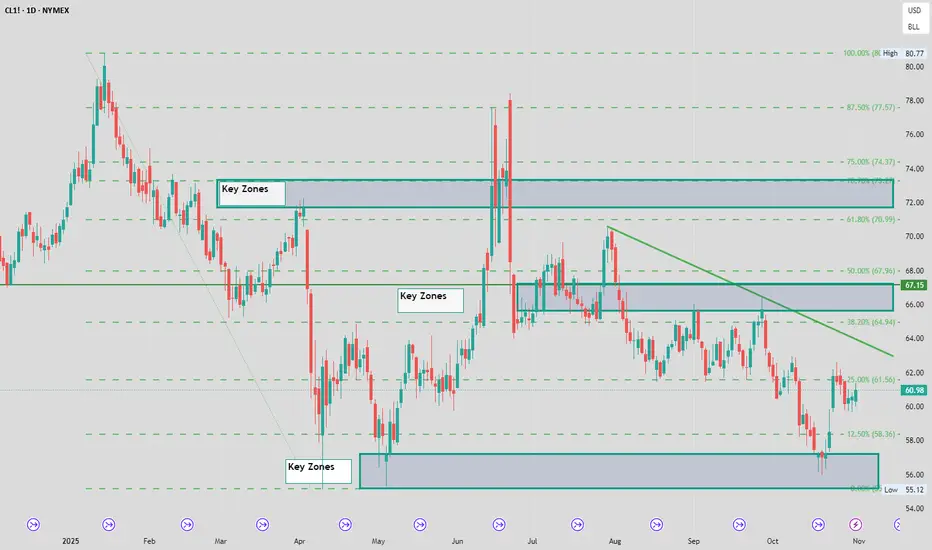
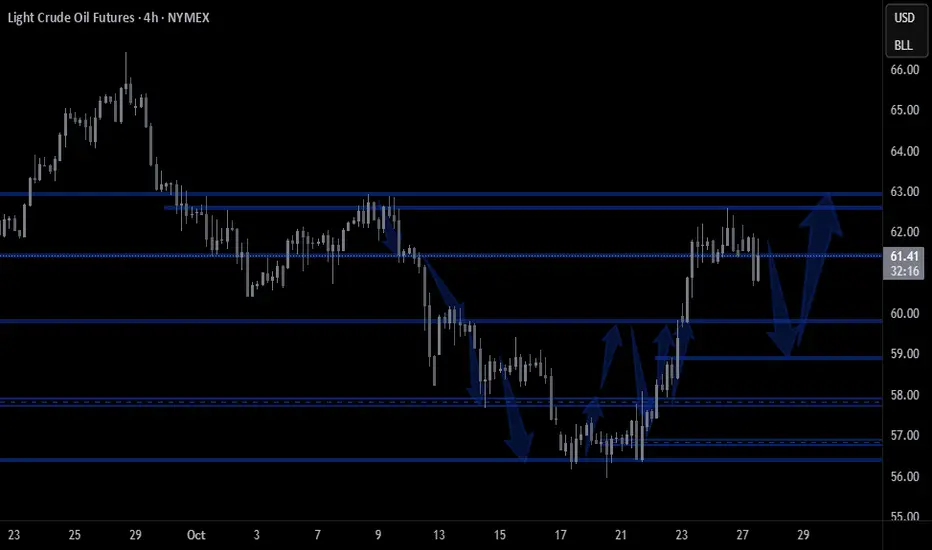
CL been the same all year - 2025 The song remains the same in CL this year aggressive moves higher get met with selling and big sell off's run into buyer range bound and key areas been mapped.
CRUDE OILPreferably suitable for scalping and accurate as long as you watch carefully the price action with the drawn areas.
With your likes and comments, you give me enough energy to provide the best analysis on an ongoing basis.
And if you needed any analysis that was not on the page, you can ask me with a comment or a personal message.
Enjoy Trading ;)

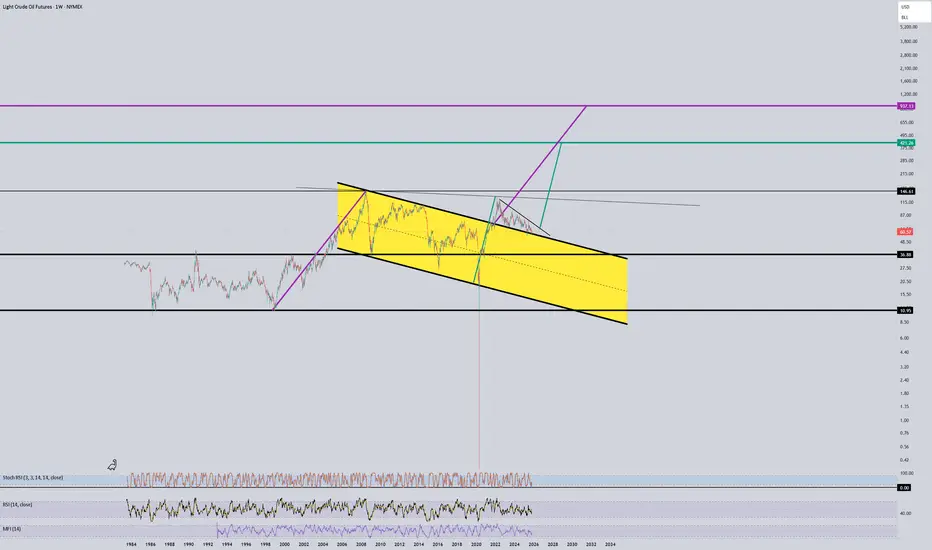
The world will be a SCARY place if this happens. This is the perfect chart for Halloween.
If this breakout is real and the measured moves get reached - the human race (outside of the WEF oligarchs and their AI technology) is in DEEP TROUBLE.
I predict the much talked about WW3 if this unfolds as per the chart!
Crude Oil ROAD TO 80!The technical outlook for Crude Oil (WTI) has shifted to a bullish bias following a key rejection at a significant resistance level. The subsequent price action has formed a robust ascending channel, indicating sustained buying pressure and a lack of significant sell-offs. The convergence of this channel with a promising ABCD harmonic pattern suggests a potential long-term bullish trend is developing, with a projected target zone near $80.00.
Detailed Pattern Analysis
The analysis begins on Wednesday, 9th April, where the price encountered a clear and defined resistance level on the daily chart. This level represented a point where sellers had previously overwhelmed buyers. However, the market's reaction was notably bullish.
Instead of reversing into a downtrend, the price action following the rejection formed a well-defined ascending channel. This pattern is characterized by a series of higher highs and higher lows, contained within two upward-sloping parallel trendlines. It demonstrates consistent and structured buying interest, with each dip being bought at a progressively higher price.
The observation of "no sign of a drop" is critical. It indicates that the corrections within the channel are shallow and orderly, lacking the aggressive selling volume that would typically signal a reversal. This reinforces the strength of the underlying bullish momentum and supports the thesis for a sustained "long bull run."
The ABCD Pattern: The note that "the ABCD looks promising" refers to a common and reliable harmonic pattern. This pattern suggests that the initial impulsive leg (A to B) is often equal to the subsequent leg (C to D). The completion of this pattern within the context of the broader ascending channel adds significant confluence to the bullish forecast.
Trigger and Target:
Bullish Trigger: A confirmed break and daily close above the $72.50 level is identified as the key catalyst. This level likely represents the recent high or the upper boundary of the initial consolidation. A breakout here would confirm buyer conviction and open the path for the next leg higher.
Long-Term Target: Based on the measured move of the ascending channel and the projected completion point (D point) of the ABCD pattern, the primary profit target is set around $80.00. This represents a significant technical and psychological resistance zone where the pattern would be considered mature.
Conclusion:
In summary, Crude Oil (WTI) presents a compelling bullish setup on the daily timeframe. The combination of a breakout above key resistance, a steady ascent within a defined channel, and a converging harmonic pattern all point towards a continued upward move. The strategy is to enter on a confirmed breakout above $72.50, targeting the $80.00 area, while strictly managing risk with a stop-loss placed below the channel support. This disciplined approach allows for participation in the potential bull run while rigorously protecting capital.

Crude oil is the next GoldLooks like there will be more conflicts between countries and Crude oil is going to rise huge because of demand supply and delivery issues. Levels also matches with the scenario.


WTI(20251106)Today's AnalysisMarket News:
US ADP employment rose by 42,000 in October, the largest increase since July 2025, exceeding market expectations of 28,000. The US ISM non-manufacturing PMI for October came in at 52.4, a new high since February 2025.
Technical Analysis:
Today's Buy/Sell Threshold:
60.27
Support and Resistance Levels:
61.30
60.91
60.66
59.87
59.62
59.23
Trading Strategy:
Consider buying if the price breaks above 60.27, with a first target price of 60.66.
Consider selling if the price breaks below 59.87, with a first target price of 59.62.

CL Crude Oil Short Supply-DemandSee Chart For Details.
Mainly a technical edge with price inside Daily supply + resistance and we have confirmation on lower timeframes.
Technicals = bearish
Fundamentals = Mixed
Sentiment = Mixed
Overall Slight edge I would say roughly 25% chance of 5:1

CRUDE OILPreferably suitable for scalping and accurate as long as you watch carefully the price action with the drawn areas.
With your likes and comments, you give me enough energy to provide the best analysis on an ongoing basis.
And if you needed any analysis that was not on the page, you can ask me with a comment or a personal message.
Enjoy Trading ;)
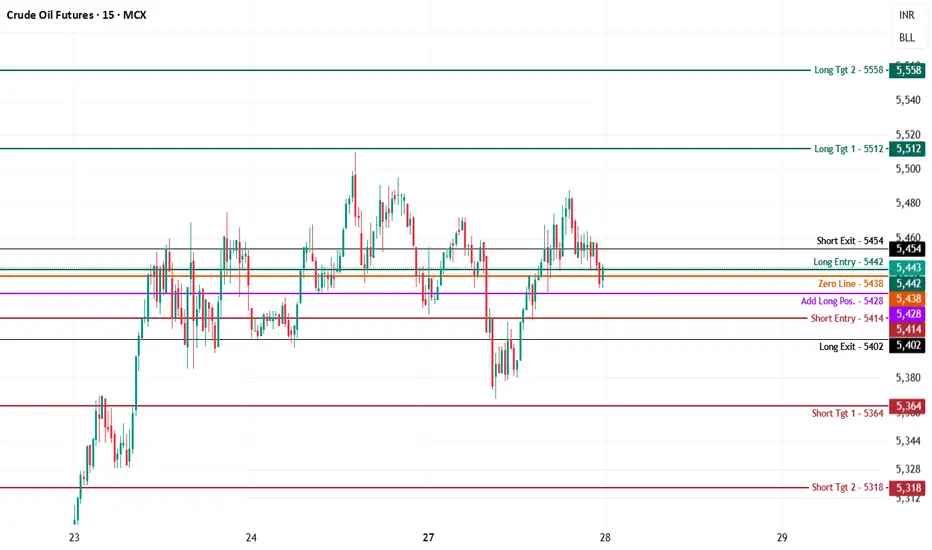
Crude Oil MCX Future Intraday Technical Analysis - 28th Oct., 25$MCX:CRUDEOIL — Chart Pathik Insights | 28-Oct-25
Crude Oil is holding steady at 5,443, consolidating at the long entry (5,442) while toggling just around the zero line of 5,438. After a session marked by quick retracements and fakeouts, strong hands are waiting for a conviction move from this tightly wound range.
Bearish Playbook:
Short trades stay valid below 5,414, with further pressure if supply keeps the price pinned beneath the add-long (5,428) and zero line.
Downside Targets:
5,364: First logical target for partial shorts or fast moves.
5,318: Deeper push if volatility leads to more liquidation.
Risk Management: Shorts can be protected near 5,428 or switch long if there’s a strong reversal above session range.
Bullish Playbook:
Longs are interesting above the long entry zone (5,442), with added confidence above the short-exit (5,454) and push towards higher supply bands.
Upside Targets:
5,512: Key resistance for short-term profit-taking.
5,558: Aggressive extension if buyers seize momentum.
Risk Management: Use the add-long or short-entry as tactical stops (5,428/5,414) if buyers lose grip or volatility escalates.
Neutral/Compression Logic:
The 5,438 zero line governs today’s chop band—expect chop and fade trades until a clear expansion cues the next directional sequence.
Keep these levels at hand for structured trading and calculated exits. Boost, comment, and share if these insights fit your strategy—your engagement builds a stronger learning market ecosystem.
Follow Chart Pathik for actionable logic, mapped zones, and a reliable edge every single session.
Oil bounced from POC. Sanctions aganst russia did't push it upOil bounced from POC. Sanctions aganst russia did't push it up
which is so good for down trend)
in a case of retest of POC - u can take short trade with goals $55 and $49
