This video is for someone who's going to fix some of my problemsThe is 11/4 . I'm all over the place in this video because I want someone who is familiar with TradingView to see some of my setups and I want these setups to be cleaner and create problems for me. Unfortunately I don't understand exactly why I'm having problems and so I'm talking out loud about some tool setups that I have to let somebody who knows what he's doing to figure out what I'm not sure about. If I knew exactly why things didn't work I wouldn't hire anybody... I would figure it out myself but I'm at a time in life when it's very hard to do that. I never talk about my trades or trades that you should center at your own risk and I try to tell you where that market is and how it's going to move.... Always thinking like a buyer or a seller. I never charge people money I have people around me who know that I trade because I talk to people that I live around. Honestly I really like analyzing the market and it took me many years to do it well and quite honestly not with modesty... I have made millions of dollars making decisions..... And I can tell by the symptoms of my age that it's getting more difficult for me to handle confusions... Or something in the software that I don't understand which could be my fault, but I don't understand.... And I know it's probably not going to get much better so I see this as an interim where I might have a year or ... But if it gets to stressful or confusing I'll stop. I know there will be at least one more video and I will ramble on hoping that I actually run into the problems that I have when I'm not doing videos... Hoping that the person who is good at computers can explain to me the things that I don't understand... But he recognizes the problem that he can fix. I forgot to mention that one of the many markets that we are looking at looks like it can have a reversal and may go lower and be the beginning of a significant move in a downward direction... I'll have to show you perhaps later today or tomorrow but if I try to look it up to refresh my mind I'll lose the video which is not how I want to waste my time////liquor reversals on indexes that have been moving higher and be cognizant of the DXY behavior.
Trade ideas

Coffee Beans at Their Highest Since 1977—But the Buzz Is FadingAfter a historic rally that pushed coffee prices to levels not seen since 1977, the market is finally cooling. Futures have started to slip, signaling a potential correction after months of bullish momentum.
Starbucks is an interesting idea. It would hypothetically benefit from lower coffee bean prices.
Starbucks, additionally, launched its now-iconic glass bear cups, one of its most viral campaigns in recent memory. Yet despite the hype, Starbucks’ stock price remains roughly where it was in 2018 with a PE that isn't too compelling at 39.
A similar trade comes to mind as a prior Hersey's Cocoa reversal hasn't panned out in terms of lower input prices filtering into higher margins. But the commodity market filtering into the real economy may be delayed by a few quarters.
A divergence in the RSI gives technical confidence that this market is overextended.
Grounds for Concern | Brewing Trouble

Analysis Techniques – Arabica Coffee Futures (Dec 2025)Analysis Techniques – Arabica Coffee Futures (Dec 2025)
Date: October 23, 2025 | Timeframe: D1 | Contract Code: ICEUS KCZ25
1. Trend Overview and Price Structure
December 2025 Arabica coffee futures continued to rally strongly, up +2.18% to 423.95 cents/lb, marking the sixth consecutive session of gains and returning to the highest level since early May 2025.
The current technical setup shows clear bullish momentum following a two-week consolidation between 380–400 cents.
If momentum persists, prices could advance toward the strategic resistance zone at 450 cents/lb, corresponding to the March 2025 swing high.
Short-term trend: Strongly bullish – continuing wave (3) within a broader recovery cycle.
2. Key Technical Price Levels
Resistance: 424 – 450 – 480
Support: 388 – 351 – 316
3. Detailed Technical Analysis
(1) Short-Term Trend:
Price has broken above the 400–410 resistance zone and is now aiming for the 450 target area.
A clear horizontal accumulation breakout pattern has formed, signaling that buyers are fully in control of the market.
(2) Trading Volume:
Volume has expanded alongside rising prices over the past week, confirming renewed speculative and commercial participation.
Managed money funds are likely rebuilding net-long positions after September’s liquidation phase.
(3) Wave Structure:
According to Elliott Wave Theory, Arabica is in wave (3) of a bullish sequence that began from the 316.50 low in July 2025.
Wave (1): 316 → 388
Wave (2): correction to 351
Wave (3): currently targeting 450–455, the 161.8% Fibonacci extension.
(4) Confirmation Signals:
Price broke above the accumulation range with long-bodied bullish candles, showing no signs of distribution.
Short-term EMAs (12–36) are expanding upward, confirming strong momentum.
Breakout volume exceeded the 20-session average, validating the move.
4. Strategic View – VNC
According to Bloomberg Intelligence, Arabica’s sharp rally through October has been driven by three fundamental catalysts:
1. Short-Term Supply Tightness in Brazil:
September exports fell nearly 11% year-on-year, as dry weather slowed harvest progress.
ICE-certified stocks dropped sharply, reaching the lowest level in 18 months.
2. Renewed Speculative Flows:
Commodity funds have rotated back into soft commodities (coffee, cocoa, sugar) as the energy complex corrected.
The Arabica-to-Robusta net-long ratio has risen to 1.4x, its highest since April.
3. Stable Consumption Demand:
Roasters in Europe and the U.S. have increased stockpiling ahead of the winter season.
The slightly weaker Brazilian real (5.52 BRL/USD) has discouraged farmer selling, tightening near-term supply.
VNC expects bullish momentum to persist in the short term, with 450 cents/lb as a medium-term target. However, profit-taking or a rebound in the real could trigger corrective pullbacks near 460–470 cents/lb.
5. Suggested Technical Strategies
Primary Long Scenario (Trend-Following):
Entry: 415 – 420
TP1: 450
TP2: 465
SL: 404
Probability: 75%
Risk/Reward Ratio: ~1:2.8
Alternative Short Scenario (Rejection at 450 Resistance):
Entry: 448 – 452
TP: 388
SL: 460
Probability: 25%
Risk/Reward Ratio: ~1:3
6. Corporate Hedging Strategies
For Arabica Exporters (Brazil, Colombia):
Increase forward price fixation around 440–450 cents/lb, as prices approach strong resistance.
Utilize options collars to protect profit margins in case of a near-term correction.
For Importers and Roasters (EU, U.S., Vietnam):
Consider early hedging in the 400–420 zone to lock in costs before a potential breakout above 450.
If prices reach 450–460, consider unwinding older hedges to maintain a neutral exposure.
For Commercial Traders:
Maintain medium-term long positions, targeting 450–455 for partial profit-taking.
A confirmed breakout above this zone could open the path toward 480–500 cents/lb.

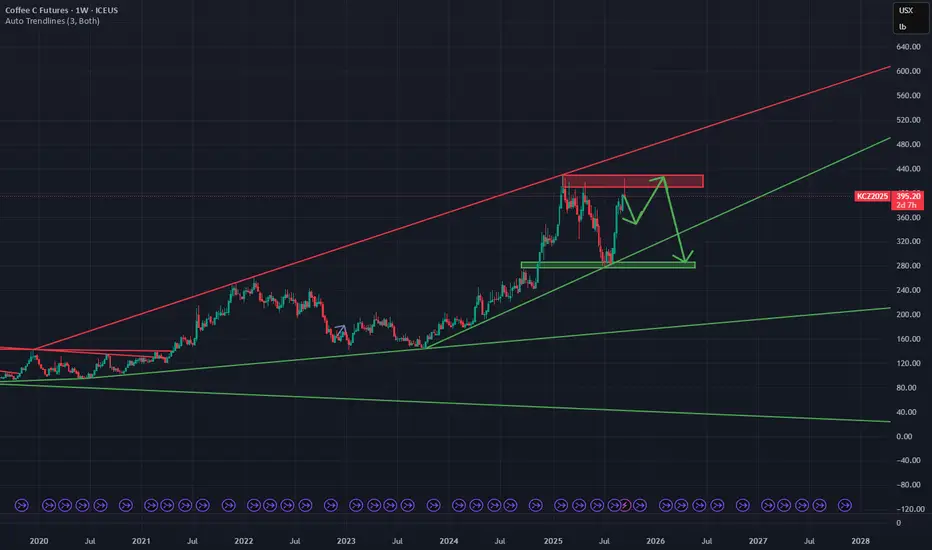
$COFFEE (MONTHLY): RECTANGLE BREAKOUT, targetting $595COFFEE is going to become even more expensive, it looks like. The MONTHLY has been bullish since covid.
In terms of pure TA, this is a very strong structure, long accumulation, a few solid decades, a breakout above old resistances, retested, clean Eliiot WAVE count, quite a dream. Except this is the MONTHLY chart and can take months or years to play out before reaching targets.
Out of last 7 HIDDEN BULL RSI divergences, 6 led to great rallies, one one failed. This WAVE 5 has got much higher targets, it makes it well worth watching closely.
So, need a closer look, but already a strong candidate for a LONG position this week, beyond crypto💙👽

Analysis techniques – Arabica Coffee Futures (Dec 2025)Analysis techniques – Arabica Coffee Futures (Dec 2025)
Date: Oct 06, 2025 | Timeframe: D1 | Contract Code: KCZ25
1. Trend Overview and Price Structure
December Arabica coffee rose +2.28% to 388.35 cents/lb, breaking above the 384–385 consolidation zone and confirming a short-term recovery.
The medium-term structure remains bullish from the 272.05 low, with a key support area around 350. Sustaining this zone may lead prices toward 420 cents/lb, the highest resistance since May 2025.
2. Key Technical Levels
Resistance: 384.6 – 420 – 450
Support: 350 – 316.5 – 272
3. Detailed Technical Analysis
(1) Short-term Trend:
Momentum strengthened as prices reclaimed the 384–385 area. Holding above 380 reinforces the near-term uptrend.
(2) Volume:
Volume expansion during the latest rally reflects renewed speculative buying.
(3) Wave Structure:
Arabica appears to be in wave 3 of a medium-term recovery cycle, targeting 420 – 450. A confirmed breakout above 420 could extend the move into wave 5 toward 450.
(4) Confirmation Signals:
A daily close above 388–390 would confirm bullish continuation, while a drop below 350 would weaken the broader structure.
4. VNC View
Short Term: Supported by low ICE certified stocks and a stronger BRL reducing farmer selling.
Medium Term: Brazilian 2025/26 crop remains strong, but rising logistics costs and recovering consumption in the US/EU support price stability.
Risk Factors: Currency volatility (BRL/USD) and prolonged La Niña weather conditions in South America may distort supply-demand balance.
5. Suggested Technical Strategies
Preferred Long Setup:
Entry: 384 – 388
TP: 420 – 450
SL: 350
Probability: 65%
Counter-trend Short Setup:
Entry: 418 – 420
TP: 370 – 350
SL: 425
Probability: 35%
6. Corporate Hedging Guidance
Roasters / Importers: Lock in purchases around 380 – 390 to hedge against potential rally toward 420.
Exporters: Delay sales once above 400 and use forward hedges to capture upside if the uptrend extends.

OilSeptember 24th 2005 second video today. I did a little bit more work with oil with a focus on Range boxes and 2 bar reversals. I did a brief look at how you can understand the Dynamics of a market that you're Trading by going to references for the markets for example,,, the CME which will give you the stats for a good number of markets so that you can get a realistic sense of how much you were making and losing when you do a trade on one of those markets.... In my mind it's very important to have a realistic understanding of what your real risk of loss and also your real possibility for reward when you take the long position. During the video and this is almost always the case... If I'm talking about something that I have on mind and then I see something on the chart that I want you to look at even though it's not directly dealing with my initial evaluation.... Just look at it along with me for a minute or so because that kind of behavior in my part is spotting things in the market that you should be able to see almost instinctively went once you learn these patterns. In the end if you do this long enough and it won't be that long you get a good sense of reading the market without drawing all kinds of stuff on your chart and that's a benefit because if you can look at the chart and get a sense of where the buyers and sellers are that's much better than just staring at the chart and not knowing what you're looking for..... If you're trading and you don't know what you're looking for your brain is going to feel stressed and with any change in your position if you do get into a chart and trade it you're going to feel tremendous stress because of all the problems that psychologically exists remorse regret fear of any kind you mitigate that when you place your majority of thinking to what the Market's doing because you know you can read the market well enough that the market will give you what you need to see.

Short Arabica Coffee🔍 Setup
Price is approaching a well‐defined supply/resistance zone (red area on chart). Historically this zone has acted as overhead resistance.
Below, there is a green demand/support zone which should act as target support area.
My target on the short is around 7.8% downside from entry, with stop loss placed just above the resistance zone / recent swing high to limit risk.
📊 Fundamental & Sentiment Background (COT & Others)
According to the latest COT report (as of 9 Sep 2025), commercial hedgers are significantly net short in Coffee C.
tradingster.com
However, speculators / non-commercials are heavily net long. This suggests that bullish momentum is still in force.
tradingster.com
Open interest is rising, showing participation in current levels. This makes the risk of a breakout (to the upside) real, if bulls hold control.
⚠️ Risks to this trade
Momentum from speculators could drive price through resistance, triggering stop losses and a strong short squeeze.
Any unexpected fundamental shock (weather, export disruption, currency devaluation, etc.) could reduce supply or boost demand, pushing prices higher.
If volume doesn’t drop on advance into resistance, the upward move may be stronger than anticipated.
✅ Conditions / Trigger For Entry
I will consider entering the short position once:
Price touches or re-tests the red supply zone.
There's a clear rejection (candlestick reversal pattern + bearish confirmation).
Momentum or RSI / MACD divergence is visible.
Speculator net longs show signs of plateauing or declining in the COT (next report).
🎯 Targets & Risk/Reward
Entry: around current price near supply, or after confirmed rejection.
Stop Loss: just above resistance / recent high.
Target: green demand/support zone (approx. 7-8% downside).
Risk-Reward Estimate: aiming for at least 1.5-2x potential reward vs. risk, ideally better.
🧐 My Edge vs What Could Go Wrong
My trading strategy gives me an average short profit of 7.8%, so this is in line with my risk appetite. The probability for a profitable trade for a short position is 75%. However, on average I will lose 12% on a losing short trade.
But I’m aware shorting commodities is riskier when there's strong bullish positioning (as is the case with speculators now).
I will monitor upcoming COT reports and fundamentals closely — if speculators increase longs again, I might bail earlier or tighten stops.
Conclusion: The COT data does not overwhelmingly confirm a short at this moment. It offers partial support via hedger short positions, but speculator long bias remains strong. If price shows a credible technical rejection in the supply zone and sentiment shows cracks, I believe this short has good risk/reward.
Second-Degree Divergences at Proven Buyer Zone - Bulls Coiled☕ KC1!: Second-Degree Divergences at Proven Buyer Zone - Bulls Coiled
The Market Participant Battle:
From points 1 to 3, number 2 buyers definitively pushed above and defeated sellers from number 1, establishing themselves as proven market participants. Now at point 4, price has returned exactly to these proven number 2 buyers who previously won the battle. The volume footprint shows mixed delta with selling pressure present, but price holding at this critical proven support suggests absorption is occurring. The fractal bullish bar combined with second-degree divergences indicates the proven buyers are preparing to defend their territory.
Confluences:
Confluence 1: VWAP First Standard Deviation Perfect Touch
Anchoring VWAP from point 1, price has returned precisely to the first standard deviation, creating a mathematical mean reversion setup. This level also pierces through what was previously resistance, which classical technical analysis suggests should now act as support. The precision of this touch - exactly at the 1st deviation - indicates algorithmic and institutional participants are respecting this level as a key inflection point.
Confluence 2: Second-Degree Hidden Bullish Divergences
While price is making higher lows, OBV, RSI, MFI, and CDV are all making lower lows - creating hidden bullish divergences. The current bar is a fractal bullish bar, meaning it contains bullish divergences on lower timeframes, making all these divergences "second-degree" - divergences within divergences. This nested structure of hidden buying pressure is extremely rare and powerful, suggesting accumulation beneath the surface despite the negative delta shown in the footprint.
Confluence 3: Proven Buyer Zone Retest at Support
Point 2 represents buyers who proved their strength by defeating point 1 sellers and pushing price to point 3. This isn't just any support level - it's a battlefield where buyers already won once. The footprint shows negative delta currently, but price holding at this exact proven zone despite selling pressure suggests hidden support. The resistance-turned-support flip adds another layer of technical confluence.
Web Research Findings:
- Technical Analysis: Coffee futures showing "Strong Buy" signals on daily technical indicators with current volume at 23,297 contracts
- Recent News/Earnings: U.S. retail coffee prices jumped 21% year-over-year - largest jump since October 1997 - due to 50% Brazil tariffs
- Analyst Sentiment: Citigroup raised 2025 target to $2.80/lb from $2.38, with ING predicting $2.68 full-year average
- Data Releases & Economic Calendar: La Niña probability at 71% for October-December could bring excessive dry weather to Brazil hurting 2026/27 crop
- Interest Rate Impact: Brazil experiencing worst drought in 70 years reducing yields by 12%, with some farmers losing 90% of harvest
Layman's Summary:
Coffee is facing a perfect storm of bullish factors. Brazil (supplying 40% of world's coffee) has its worst drought in 70 years, with farmers losing up to 90% of crops. La Niña weather (71% chance) threatens even more drought. Trump's 50% tariff on Brazilian coffee caused the biggest price spike since 1997. The technical setup shows we're at a critical support level where buyers previously won against sellers. While the footprint shows some selling pressure, multiple hidden indicators (divergences within divergences) suggest accumulation is happening beneath the surface. Price holding at this proven support despite negative delta indicates strong underlying demand.
Machine Derived Information:
- Image 1: 1-hour chart showing points 1-4 with proven buyer zone at point 2 - Significance: Clear retest of proven support - AGREES ✔
- Image 2: Clean chart showing resistance-to-support flip at point 2 level - Significance: Classical polarity principle confirmed - AGREES ✔
- Image 3 (Footprint): Shows negative delta (-124, -290, -372) at current levels - Significance: Selling pressure present but price holding at support - NEUTRAL ⚠️
- Fractal Bar Analysis: Current bar contains lower timeframe divergences - Significance: Multi-timeframe buying pressure building despite surface selling - AGREES ✔
Actionable Machine Summary:
The footprint shows selling pressure with negative delta, but crucially, price is holding at the proven buyer zone despite this pressure. The second-degree divergences (fractal bar with divergences inside) combined with the exact VWAP 1st deviation touch suggests this selling may be exhaustion rather than continuation. The divergence between negative delta and price stability at proven support often precedes reversals. Watch for delta to flip positive as confirmation.
Conclusion:
Trade Prediction: SUCCESS (Conditional)
Confidence: High
While the footprint shows current selling pressure, the confluence of proven buyer support, VWAP mathematics, and rare second-degree divergences outweighs the negative delta. The fundamental supply crisis from drought and tariffs provides strong tailwind. The key is that price is holding despite selling - suggesting absorption. Risk/reward remains excellent with stops below point 2. Monitor for delta improvement as entry confirmation.

Freshly Ground Coffee BeansICEUS:KC1! , high volume close into a key pivotal zone emphasizing the Bull thesis, Coffee beans are in demand and higher prices should follow suit

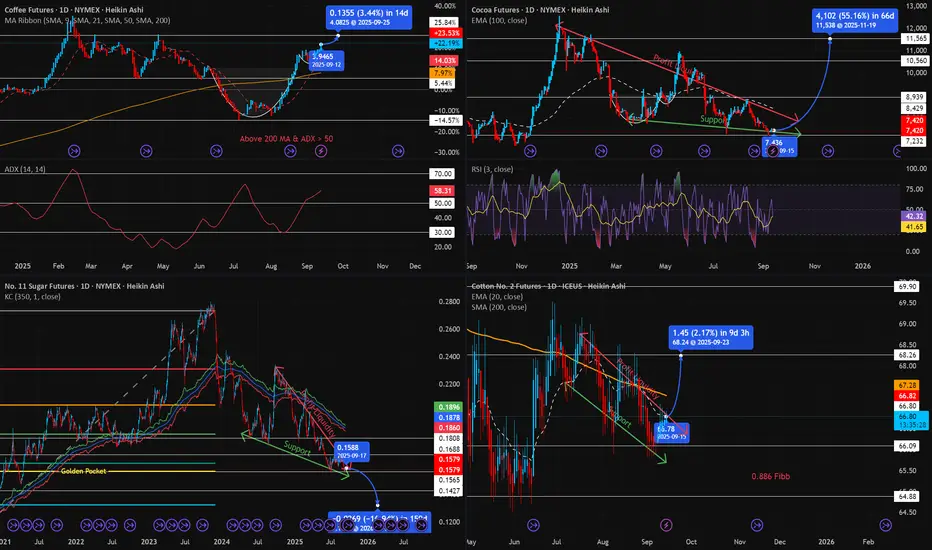
Cocoa, Sugar, Coffee & Cotton Rotation📌 The Soft Commodities Super Guide: Cocoa, Sugar, Coffee & Cotton
Soft commodities — crops grown rather than mined — are among the oldest traded goods in human history. From cocoa beans once used as currency in Central America, to cotton powering textile revolutions, to sugar driving global trade and colonization, and coffee fueling productivity worldwide, these markets remain essential and volatile today.
On exchanges like ICE, CME, and NYMEX, traders can access futures and ETFs to speculate, hedge, or diversify portfolios. Soft commodities are especially attractive because of their strong seasonal patterns, geographic concentration of supply, and sensitivity to weather, politics, and demand shifts.
This guide will cover:
Seasonality of Cocoa, Sugar, Coffee & Cotton
Major Price Drivers
Trading Strategies & ETFs/Stocks
Yearly Rotation Playbook
🔹 1. Seasonality of Major Soft Commodities
Seasonality refers to recurring, predictable patterns of price strength or weakness tied to planting, harvest, and demand cycles.
📈 Cocoa (ICE: CC Futures)
Strongest: Summer (Jun–Sep) → Demand builds, weather risk in West Africa.
Weakest: Winter (Dec–Feb) → Fresh harvest supply hits markets.
📌 Example: June–Sep 2020 rally (+20%) from droughts + demand recovery.
📈 Sugar (ICE: SB Futures)
Best Months: Feb, Jun, Jul, Nov, Dec.
Strong seasonal window: May–Jan (fuel demand + holiday consumption).
Weakest: Mar–Apr (harvest pressure).
📌 Example: Nov–Dec 2020 sugar rally (+15%) as Brazil shifted cane to ethanol.
📈 Coffee (ICE: KC Futures)
Strongest: Late Winter to Summer (Feb–Jul).
Weakest: Fall harvest months (Sep–Oct) → new supply weighs on prices.
📌 Example: Frost in Brazil (Jul 2021) cut supply → Coffee futures spiked +60%.
📈 Cotton (ICE: CT Futures)
Strongest: Winter & Spring (Nov–May) → Textile demand, planting risk.
Weakest: Summer & Fall (Jun–Oct) → Harvest & oversupply pressures.
📌 Example: Nov 2020–May 2021 rally (+25%) from China demand + U.S. weather risks.
🔹 2. What Moves These Markets Most?
~ Cocoa
Weather in Ivory Coast & Ghana (70% of supply).
Labor disputes, political unrest, crop diseases.
Global chocolate consumption, health trends.
~ Sugar
Ethanol demand (linked to oil prices, Brazil cane allocation).
Government subsidies & tariffs (India, EU).
Brazil’s currency (BRL) & weather.
~ Coffee
Brazil & Vietnam crops (60% of global production).
Frosts, droughts, El Niño.
Consumer demand trends (premium coffee, emerging markets).
~ Cotton
U.S., India, China output (~65% global supply).
China’s stockpiling/import policy.
Substitute fabrics (polyester), energy prices.
Apparel demand cycles.
🔹 3. Trading Strategies & Investment Vehicles
Futures
Cocoa (CC), Sugar (SB), Coffee (KC), Cotton (CT) traded on ICE.
Provide direct, leveraged exposure.
ETFs & ETNs
Cocoa: NIB (iPath Cocoa ETN).
Sugar: CANE (Teucrium Sugar Fund), SGG (iPath Sugar).
Coffee: JO (iPath Coffee ETN).
Cotton: BAL (iPath Cotton ETF).
Stocks with Exposure
Cocoa: Hershey (HSY), Mondelez (MDLZ).
Sugar: Cosan (CZZ), ADM, Bunge (BG).
Coffee: Starbucks (SBUX), Nestlé, JM Smucker (SJM – owns Folgers).
Cotton: Levi’s (LEVI), VF Corp (VFC), Ralph Lauren (RL), Hanesbrands (HBI), Gildan (GIL).
🔹 4. Soft Commodities Yearly Rotation Playbook
Here’s how traders can rotate positions through the year for maximum seasonal edge:
📌 Example Rotation:
Start year in Sugar & Cotton (Jan–Feb).
Shift into Cocoa & Coffee (Jun–Aug).
Rotate back into Sugar & Cotton (Nov–Dec).
📌 Conclusion: The Soft Commodities Super Strategy
Soft commodities offer traders multiple edges:
✅ Seasonality: Cocoa (summer), Sugar (winter), Coffee (spring/summer), Cotton (winter/spring).
✅ Macro Drivers: Weather, politics, energy, government policies.
✅ Cross-Market Links: Oil prices → ethanol (sugar); apparel cycles → cotton; consumer demand → cocoa/coffee.
✅ Portfolio Benefits: Diversification vs. equities & metals.
The best strategy is to rotate across the year:
Long Sugar & Cotton (winter/spring),
Long Cocoa & Coffee (summer),
Rotate out during weak harvest windows.
Softs may be volatile, but for disciplined traders, they provide predictable, repeatable seasonal opportunities with both futures and equities exposure.
Long Coffee📌 Coffee Futures: Seasonality, Market Drivers & Trading Insights
Coffee is one of the most important soft commodities in the world, consumed daily by billions of people. Traded for centuries, coffee originated in Ethiopia before spreading through Arabia and later into Europe, becoming a global staple.
Today, two main bean varieties dominate the market:
Arabica (≈70% of global supply): Higher quality, smoother flavor, and the most actively traded on futures exchanges.
Robusta (≈30% of supply): Stronger flavor, more caffeine, used in instant coffee and blends.
Coffee futures (KC contracts, traded on ICE) allow producers, roasters, exporters, and investors to hedge against price volatility or speculate on global demand and supply swings. These futures are physically settled, but most speculative traders roll or close positions before delivery.
🔹 1. Global Coffee Supply Concentration
Nearly 74% of the world’s coffee beans come from just five countries:
🇧🇷 Brazil → Largest producer, dominates Arabica and Robusta exports.
🇻🇳 Vietnam → Largest Robusta producer, key competitor to Brazil.
🇨🇴 Colombia → High-quality Arabica supplier.
🇮🇩 Indonesia → Mix of Arabica & Robusta, weather-sensitive.
🇪🇹 Ethiopia → Birthplace of coffee, major Arabica exporter.
Because of this concentration, traders monitor weather, politics, and economics in these countries closely. A frost in Brazil or political unrest in Vietnam can shake the entire global market.
🔹 2. What Moves Coffee Prices the Most?
Coffee is one of the most weather-sensitive and geopolitically exposed commodities.
1️⃣ Weather in Producing Countries
Frosts and droughts in Brazil (especially during flowering season) can cut supply drastically.
El Niño / La Niña events disrupt rainfall patterns across South America and Asia.
📌 Example: July 2021 frost in Brazil devastated crops → Coffee futures surged over 60% within months.
2️⃣ Political Instability
Strikes, protests, or export restrictions in Brazil, Vietnam, or Colombia can delay shipments.
Political risks in Latin America historically coincide with coffee supply disruptions.
3️⃣ Global Economic Growth
Rising incomes in Asia, Africa, and Latin America increase coffee consumption.
Coffee shifts from a luxury to a daily staple, driving long-term demand growth.
4️⃣ Health Reports & Consumer Trends
Positive studies about coffee’s health benefits (antioxidants, longevity, heart health) boost consumption.
Rising demand for premium Arabica beans (specialty coffee, single-origin) drives price premiums.
🔹 3. Seasonality of Coffee Futures
Like other soft commodities, coffee follows seasonal cycles tied to harvest and demand.
📈 Best Periods: Late winter to early summer (Feb–Jul). Traders often buy into supply fears before Brazil’s winter season (risk of frost).
📉 Weaker Periods: Harvest season in major producing regions (Sep–Oct) when fresh supply pressures prices.
📌 Example: Coffee futures tend to rally into June/July when frost concerns in Brazil peak, then weaken post-harvest in the fall.
🔹 4. How to Trade Coffee
Futures & ETFs
Coffee Futures (KC) → Traded on ICE, standard contract for institutional & speculative traders.
JO ETF (iPath Coffee ETN) → Retail-friendly option for coffee exposure.
Stocks with Coffee Exposure
Starbucks (SBUX): Global leader in coffee retail.
Nestlé (NESN.SW): Owns Nescafé & Nespresso, one of the largest global coffee buyers.
JM Smucker (SJM): Owns Folgers & Dunkin’ brands.
Luckin Coffee (LKNCY): Fast-growing Chinese coffee chain (emerging markets play).
📌 When coffee prices rise → Retailers like Starbucks may face margin compression unless they pass costs to consumers.
📌 When coffee prices fall → Profit margins improve for coffee sellers & roasters.
🔹 5. Coffee Trading Strategies
📈 Strategy #1: Buy and Hold
Buy and hold when the close price today is greater than the 200 Simple Moving Average, and the 14-14 ADX is lower than 50; and
Sell when neither of the above conditions are met.
Additional Notes:
In the 4-HR, a 200 SMA and 30 ADX Threshold can work.
Rallies typically last 120~180 days after the signal is generated.
Stop loss is either the 21 SMA, or the 2.5x Daily ATR.
📈 Strategy #2: Seasonal Long (Feb–Jul)
Go long coffee futures or JO ETF in late winter.
Exit before fall harvest (Sep–Oct).
📈 Strategy #3: Weather Hedge
Track Brazil’s weather models (frost, drought risk).
Enter futures or ETFs ahead of known risk windows.
📈 Strategy #4: Macro Demand Growth
Long-term investors may pair coffee exposure with emerging-market consumer stocks (Nestlé, Starbucks, Luckin Coffee).
📌 Conclusion: Coffee as a Soft Commodity Trade
Coffee is one of the most volatile and globally impactful soft commodities. With supply concentrated in a handful of nations and consumption spread worldwide, it offers both seasonal trading opportunities and long-term growth exposure.
✅ Seasonality Edge: Strongest in Feb–Jul, weakest in harvest season.
✅ Macro Edge: Track Brazil, Vietnam, Colombia → weather & politics drive 70%+ of supply.
✅ Consumer Edge: Health trends + premium coffee demand = long-term bullish.
✅ Diversification Edge: Coffee moves independently from equities & metals, making it an attractive portfolio diversifier.
Traders who align seasonality, weather, and demand cycles can use coffee futures or ETFs to capture repeatable opportunities in this globally essential commodity.

Review of multiple markets9 9.25 in this video I went through the markets that we typically follow here. If there is one market that I'm concerned about and that is gold because it's been unusually bullish and I kept my position as I indicated in this video but the price action concerns me that there might be a significant issue with the currency and that there may be more upside on the goal. However, there are suggestions in the patterns that there may be a correction lower.... Despite the fact that this is a very bullish gold market. If the market does reverse it could come down to an area that I talked about in the video. Not all markets are easy and very few markets are easy all the time. I really liked Elon musk's series about how to deal with the upcoming problems that are coming to us essentially now. it's worth reading what he has to say.

There are some reversal patterns on a few marketsThis is Thursday September 4th. there are a few reversal patterns suggesting that the market that was going lower may find buyers or the market was going higher and now it's going lower to find sellers.... So we'll look at those markets which we've been following recently.

Gold and silver keep going higherMy videos did not upload yesterday there were two videos. This video will be much shorter and maybe that'll solve the problem with uploads the patterns suggests that several reversals including Lumber are going to find buyers and trade higher.

FOLLOW-UP ON EARLIER TODAY ON 4 OR 5 MARKETSThis is a follow-up on September second video so that we could follow what was forecast for that day..... And then what could happen for this coming day since this video was done just before the market rolled over to September 3rd.

Gold silver ES coffeeIt's December 2nd this is the third video gold and silver have been going higher. I think we may have a reversal pattern on the ES we will watch we will watch as the market moves below support resistance lines..... There is a support resistance line when the Es as we speak.


Coffee ready for a shortCoffee has retraced to a descending trendline. It has been up every day for several days and is in very overbought territory. Look for signs of weakening momentum and RSI turning back down for a decent reversal trade.
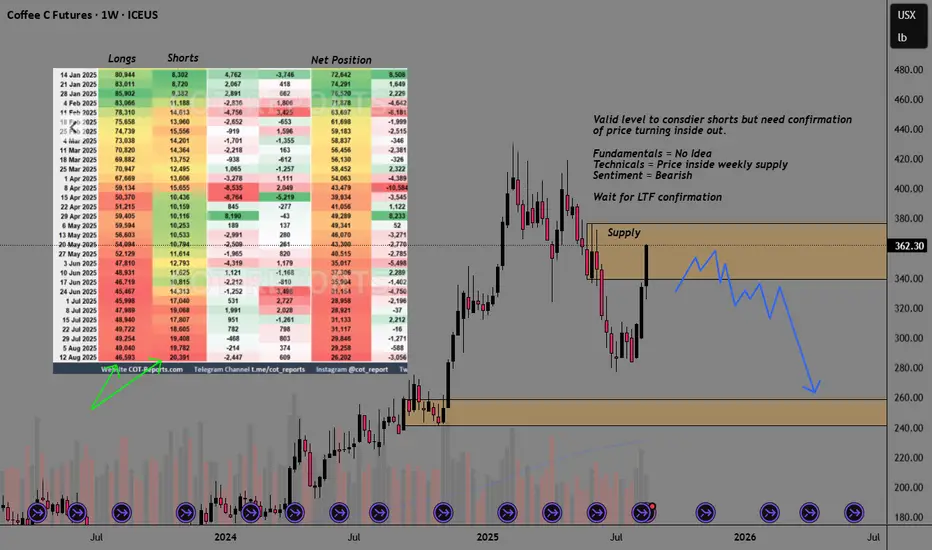
Coffee Futures Hit Weekly Supply Zone with RejectionThis week, Coffee futures have approached a significant weekly supply zone, where the Market
tested the area with a sharp spike, followed by a clear rejection. Currently, traders are watching for a potential re-entry into this same level, aiming for a swing trade targeting the monthly demand area. Additionally, seasonal patterns for coffee suggest a possible bearish trend, reinforcing the outlook for a potential downward move. This confluence of technical resistance and seasonal factors presents a strategic opportunity for traders to position for a downside continuation.
✅ Please share your thoughts about KC1! in the comments section below and HIT LIKE if you appreciate my analysis. Don't forget to FOLLOW ME; you will help us a lot with this small contribution.
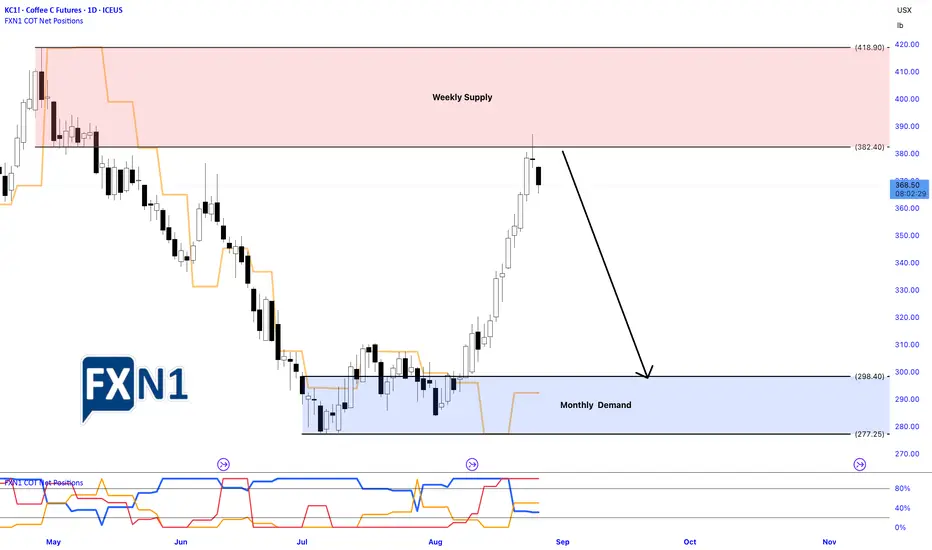
COFFEE Supply-Demand COT AnalysisSee chart for full analysis.
Overall I like looking for shorts with price inside levels of weekly supply
+ COT data suggests more selling is needed. Waiting for confirmation on LTF.
This video we are looking a coffeeAugust 20th 25 I'm getting ready to change the status of things I've been doing and that includes scaling out of videos.... I'm getting too old for this. My goal is to feature one market with about a 25 minute video and focus on price action and repeatable patterns for buyers and sellers without a lot of superfluous tools on the chart it may be more harmful than good...... I want the chart to look easy and show me where the market is going higher and where it's going lower.... Especially on a market that has volatility..... Volatility is the key for better returns.

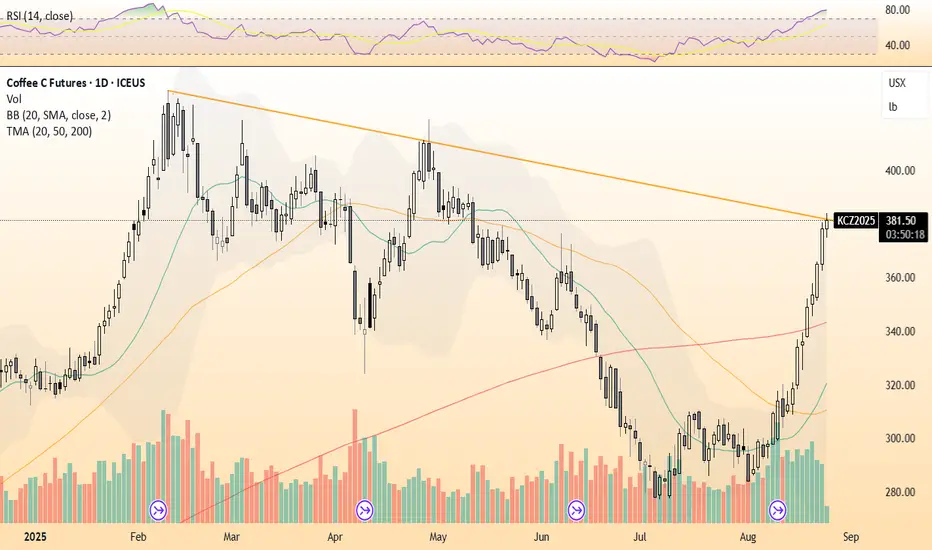
Correction Over? Coffee May Be Ready for Another Rally!After a strong rally and moving far from its moving averages, coffee futures have started a healthy and expected pullback.
As we can see, the 20-period moving average (green) stands out as a strong support level and a potential target for those who sold near the top — whether for a partial profit-taking (expecting a deeper correction) or a full exit.
The candle formed right on the 20MA clearly reflects this dynamic: positions being closed by some traders and opened by others.
This price zone offers a good buying opportunity, with a tight stop and a long target in favor of the prevailing uptrend.
The trade symmetry is favorable, further reinforcing interest in this region.
Initial targets would be the previous high, and if that level is broken, the Fibonacci projections for more ambitious upside moves.
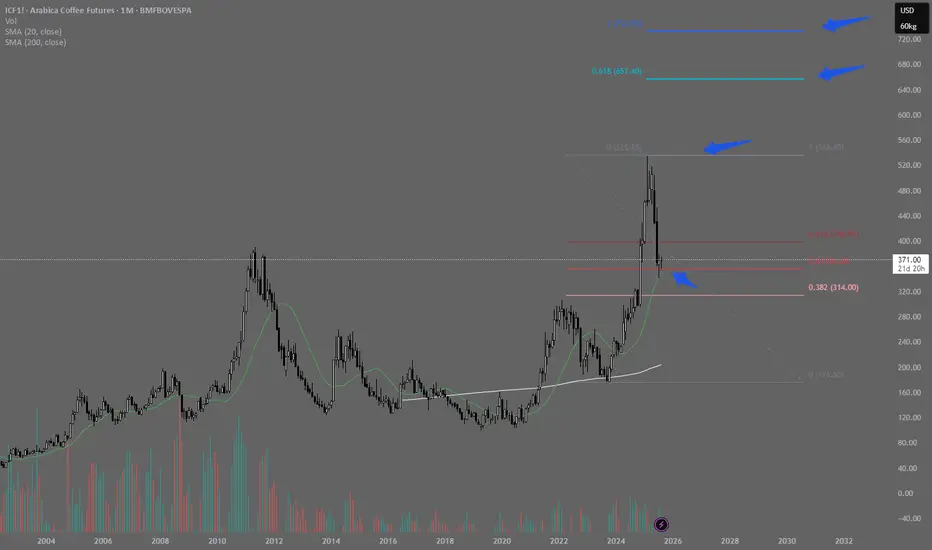
COFFEE Setback targetGlobal picture on Coffee is exit from 20 years triangle. Locally i am anticipating setback into the marked zone because of ratio of the double zigzag on the minor degree.
After this i am anticipating grows resume to ~485
