FUBO US LongFuboTV (FUBO) has shown significant growth recently, and there are several reasons for this.
In Q2 2025, FuboTV reported
EPS of $0.05, which exceeded analysts' forecasts (-$0.05)
Revenue of $371.3 million, also above expectations ($353.72 million)
The company achieved positive adjusted EBITDA for
Key facts today
Next report date
—
Report period
—
EPS estimate
—
Revenue estimate
—
0.25 USD
−173.94 M USD
1.62 B USD
336.56 M
About fuboTV Inc.
Sector
Industry
CEO
David Gandler
Website
Headquarters
New York
Founded
2009
ISIN
US35953D1046
FIGI
BBG002CV4Q74
fuboTV, Inc. engages in providing subscription to sports, news, and entertainment content. It offers its services through streaming devices and on television, mobile phones, tablets, and computers. The company was founded by David Gandler, Alberto Horihuela Suarez, and Sung Ho Choi on February 20, 2009 and is headquartered in New York, NY.
Related stocks

FUBO TVQuality product.
If they could integrate their product with a sportsbook/betting platform....wowzers
Simple and straightforward (and easy to cancel a subscription) unlike some others
skys' the limit for this stock
been on this stock for some time ^^^^

FUBO breakoutAfter creating a cup under long term resistance post merger news fubo is back at its breakout line.
Targeting a double.
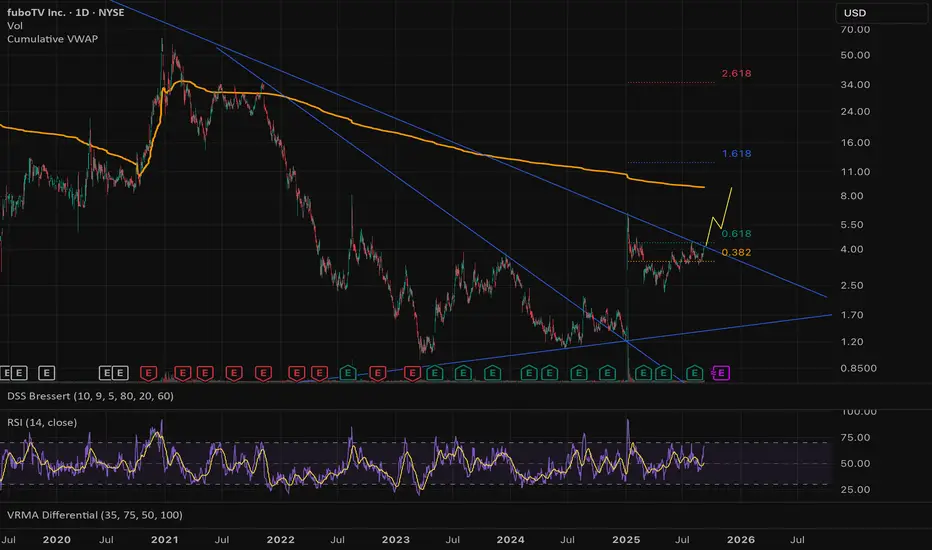
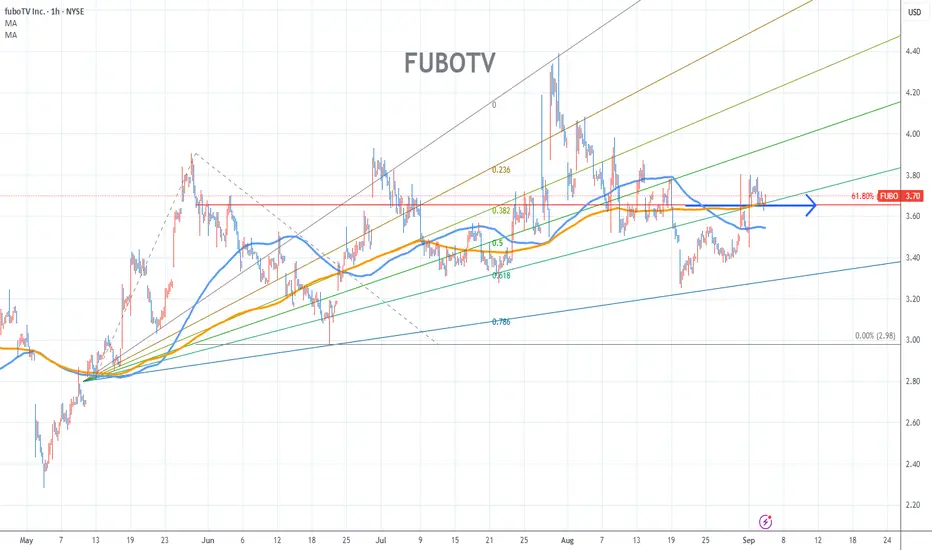
FUBOTV Stock Chart Fibonacci Analysis 090325Trading Idea
1) Find a FIBO slingshot
2) Check FIBO 61.80% level
3) Entry Point > 3.7/61.80%
Chart time frame:B
A) 15 min(1W-3M)
B) 1 hr(3M-6M)
C) 4 hr(6M-1year)
D) 1 day(1-3years)
Stock progress:A
A) Keep rising over 61.80% resistance
B) 61.80% resistance
C) 61.80% support
D) Hit the bottom
E)
FUBO — At Channel Support, Decision Time AheadTicker: FuboTV (NYSE: FUBO)
Timeframe: 1D
⸻
🟢 Bullish Scenario — “Respect the Channel”
• Trigger: Hold and bounce from channel support (~$3.70–$3.80).
• Entry Idea: Long near support zone.
• Stop Loss: Below $3.40 (invalidate channel).
• Targets:
• TP1 = $4.50
• TP2 = $5.20 (channel resistan
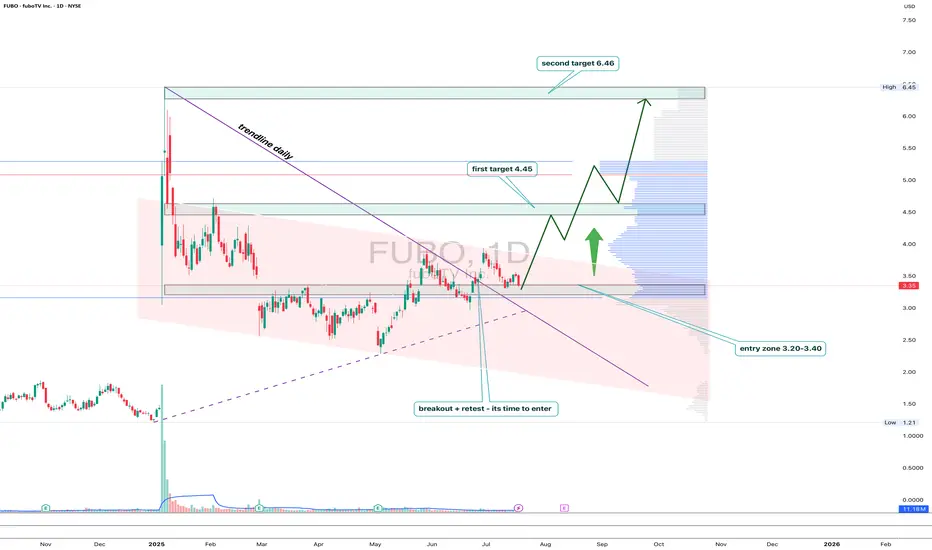
FUBO: trendline breakout with a subscription to $6.46FUBO has broken out of the descending trendline on the daily chart, followed by a clear retest and consolidation above the key 3.20–3.40 area. This zone coincides with the 0.5 Fibonacci retracement and high-volume support, confirming strong buyer interest.
As long as price holds above 3.20, the set
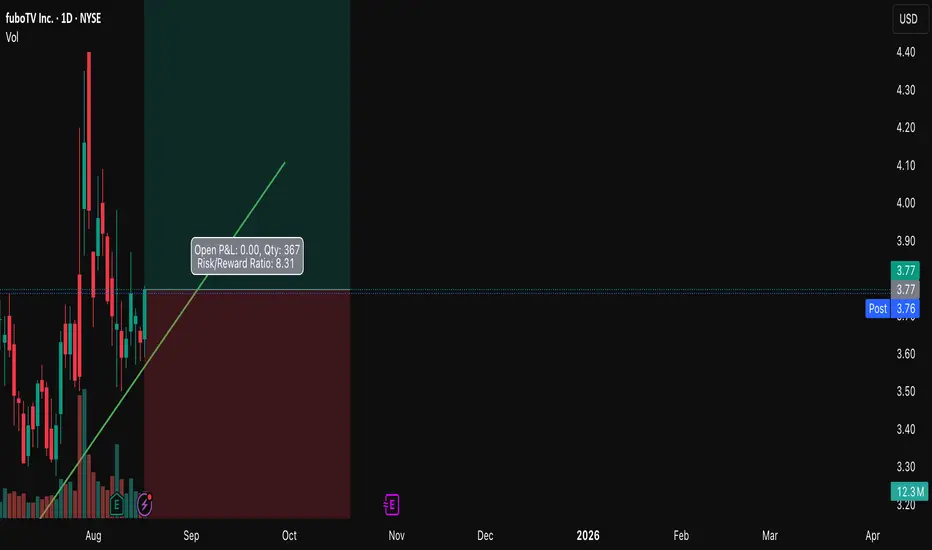
fuboTV $5.00 price target Positive Divergence Multi time frameMy trade on fuboTV has a $5.00 price target. With positive divergence multiple time frames 15,1hr, 4hr. An RSI scoop where the hrly RSI with a length setting of 36 shows upward momentum? The Chande momentum oscillator with a setting of 24 indicates the price may not stall at $4.50.

Round 2 on $FUBO! 92% UpsideEarlier this year we caught the MASSIVE 400% move on NYSE:FUBO 🚀
1st PT is $4.89 🎯
2nd PT and MM of Falling Wedge is $5.86 📏
We've come full circle and we are back in them for another MASSIVE move!

FUBO: Long term investmentFUBO: Long term investment
.
Pull back and tight consolidation, preparing for a big jump.
US STOCKS- WALL STREET DREAM- LET'S THE MARKET SPEAK!

$FUBOThis looks like a promising stock for a deep dive. The streaming sector is also projected to be bullish in the coming weeks. If you missed out on gains with Netflix, Fubo might compensate you.

See all ideas
Summarizing what the indicators are suggesting.
Neutral
SellBuy
Strong sellStrong buy
Strong sellSellNeutralBuyStrong buy
Neutral
SellBuy
Strong sellStrong buy
Strong sellSellNeutralBuyStrong buy
Neutral
SellBuy
Strong sellStrong buy
Strong sellSellNeutralBuyStrong buy
An aggregate view of professional's ratings.
Neutral
SellBuy
Strong sellStrong buy
Strong sellSellNeutralBuyStrong buy
Neutral
SellBuy
Strong sellStrong buy
Strong sellSellNeutralBuyStrong buy
Neutral
SellBuy
Strong sellStrong buy
Strong sellSellNeutralBuyStrong buy
Displays a symbol's price movements over previous years to identify recurring trends.
Curated watchlists where FUBO is featured.

Frequently Asked Questions
The current price of FUBO is 4.07 USD — it has decreased by −0.48% in the past 24 hours. Watch fuboTV Inc. stock price performance more closely on the chart.
Depending on the exchange, the stock ticker may vary. For instance, on NYSE exchange fuboTV Inc. stocks are traded under the ticker FUBO.
FUBO stock has fallen by −2.36% compared to the previous week, the month change is a 19.02% rise, over the last year fuboTV Inc. has showed a 186.87% increase.
We've gathered analysts' opinions on fuboTV Inc. future price: according to them, FUBO price has a max estimate of 5.00 USD and a min estimate of 4.25 USD. Watch FUBO chart and read a more detailed fuboTV Inc. stock forecast: see what analysts think of fuboTV Inc. and suggest that you do with its stocks.
FUBO reached its all-time high on Nov 11, 2015 with the price of 22,500.00 USD, and its all-time low was 0.32 USD and was reached on Mar 10, 2017. View more price dynamics on FUBO chart.
See other stocks reaching their highest and lowest prices.
See other stocks reaching their highest and lowest prices.
FUBO stock is 4.61% volatile and has beta coefficient of −1.48. Track fuboTV Inc. stock price on the chart and check out the list of the most volatile stocks — is fuboTV Inc. there?
Today fuboTV Inc. has the market capitalization of 1.42 B, it has increased by 1.20% over the last week.
Yes, you can track fuboTV Inc. financials in yearly and quarterly reports right on TradingView.
fuboTV Inc. is going to release the next earnings report on Oct 31, 2025. Keep track of upcoming events with our Earnings Calendar.
FUBO earnings for the last quarter are −0.02 USD per share, whereas the estimation was −0.03 USD resulting in a 35.75% surprise. The estimated earnings for the next quarter are −0.09 USD per share. See more details about fuboTV Inc. earnings.
fuboTV Inc. revenue for the last quarter amounts to 380.00 M USD, despite the estimated figure of 367.08 M USD. In the next quarter, revenue is expected to reach 361.27 M USD.
FUBO net income for the last quarter is −8.03 M USD, while the quarter before that showed 188.49 M USD of net income which accounts for −104.26% change. Track more fuboTV Inc. financial stats to get the full picture.
No, FUBO doesn't pay any dividends to its shareholders. But don't worry, we've prepared a list of high-dividend stocks for you.
As of Sep 25, 2025, the company has 590 employees. See our rating of the largest employees — is fuboTV Inc. on this list?
EBITDA measures a company's operating performance, its growth signifies an improvement in the efficiency of a company. fuboTV Inc. EBITDA is −80.82 M USD, and current EBITDA margin is −9.22%. See more stats in fuboTV Inc. financial statements.
Like other stocks, FUBO shares are traded on stock exchanges, e.g. Nasdaq, Nyse, Euronext, and the easiest way to buy them is through an online stock broker. To do this, you need to open an account and follow a broker's procedures, then start trading. You can trade fuboTV Inc. stock right from TradingView charts — choose your broker and connect to your account.
Investing in stocks requires a comprehensive research: you should carefully study all the available data, e.g. company's financials, related news, and its technical analysis. So fuboTV Inc. technincal analysis shows the neutral today, and its 1 week rating is buy. Since market conditions are prone to changes, it's worth looking a bit further into the future — according to the 1 month rating fuboTV Inc. stock shows the buy signal. See more of fuboTV Inc. technicals for a more comprehensive analysis.
If you're still not sure, try looking for inspiration in our curated watchlists.
If you're still not sure, try looking for inspiration in our curated watchlists.