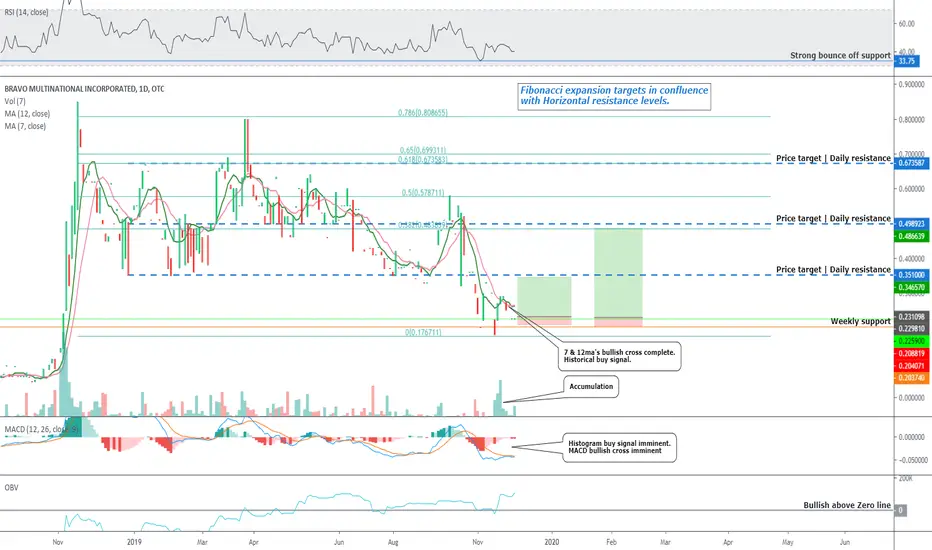
BRVO Is Our Low-Float Bottom'd Chart Bounce Alert. +100% Upside =====================
Bravo Multinational Incorporated (BRVO)
Alert Price: $0.2259
Float: 2.5M
Chart Analysis
========================
Members,
Earlier today we mentioned that we had identified a technical gem with tremendous breakout potential.
So without further ado, we ask that you ple
−0.0064 USD
−393.51 K USD
0.00 USD
26.88 M
About Bravo Multinational Incorporated
Sector
Industry
CEO
Grant Cramer
Website
Headquarters
Virginia Beach
Founded
1989
ISIN
US10568F2083
FIGI
BBG000PQMHN7
Bravo Multinational, Inc. is engaged in developing, acquiring, and launching turnkey SaaS solutions to help brands grow and create new revenue streams for brands of all types and sizes. It offers a comprehensive suite of turnkey, white-labeled SaaS solutions, including cellular services, travel club services, and AVOD/SVOD streaming platforms for content distribution. The company was founded on May 25, 1989 and is headquartered in Virginia Beach, VA.
Related stocks
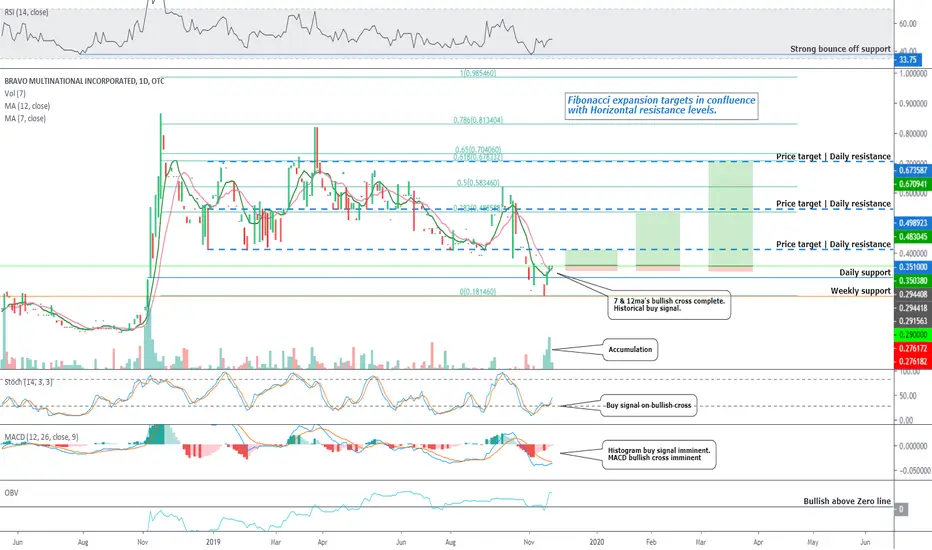
BRVO Is Our Low-Float Bottom'd Chart Bounce Alert. +100% Upside =====================
Bravo Multinational Incorporated (BRVO)
Alert Price: $0.29
Float: 2.5M
Chart Analysis
========================
Members,
We've just identified a technical gem trading on the OTC.
Please turn your attention to Bravo Multinational Incorporated (BRVO).
With it's low floa
See all ideas
Summarizing what the indicators are suggesting.
Oscillators
Neutral
SellBuy
Strong sellStrong buy
Strong sellSellNeutralBuyStrong buy
Oscillators
Neutral
SellBuy
Strong sellStrong buy
Strong sellSellNeutralBuyStrong buy
Summary
Neutral
SellBuy
Strong sellStrong buy
Strong sellSellNeutralBuyStrong buy
Summary
Neutral
SellBuy
Strong sellStrong buy
Strong sellSellNeutralBuyStrong buy
Summary
Neutral
SellBuy
Strong sellStrong buy
Strong sellSellNeutralBuyStrong buy
Moving Averages
Neutral
SellBuy
Strong sellStrong buy
Strong sellSellNeutralBuyStrong buy
Moving Averages
Neutral
SellBuy
Strong sellStrong buy
Strong sellSellNeutralBuyStrong buy
Displays a symbol's price movements over previous years to identify recurring trends.
Frequently Asked Questions
The current price of BRVO is 0.0480 USD — it has decreased by −23.75% in the past 24 hours. Watch Bravo Multinational Incorporated stock price performance more closely on the chart.
Depending on the exchange, the stock ticker may vary. For instance, on OTC exchange Bravo Multinational Incorporated stocks are traded under the ticker BRVO.
BRVO stock has fallen by −23.75% compared to the previous week, the month change is a −27.21% fall, over the last year Bravo Multinational Incorporated has showed a 6.76% increase.
BRVO reached its all-time high on Nov 23, 2009 with the price of 390.0000 USD, and its all-time low was 0.0210 USD and was reached on Sep 13, 2018. View more price dynamics on BRVO chart.
See other stocks reaching their highest and lowest prices.
See other stocks reaching their highest and lowest prices.
BRVO stock is 39.69% volatile and has beta coefficient of 2.50. Track Bravo Multinational Incorporated stock price on the chart and check out the list of the most volatile stocks — is Bravo Multinational Incorporated there?
Today Bravo Multinational Incorporated has the market capitalization of 2.29 M, it has decreased by −2.33% over the last week.
Yes, you can track Bravo Multinational Incorporated financials in yearly and quarterly reports right on TradingView.
BRVO net income for the last quarter is −69.03 K USD, while the quarter before that showed −71.02 K USD of net income which accounts for 2.79% change. Track more Bravo Multinational Incorporated financial stats to get the full picture.
No, BRVO doesn't pay any dividends to its shareholders. But don't worry, we've prepared a list of high-dividend stocks for you.
Like other stocks, BRVO shares are traded on stock exchanges, e.g. Nasdaq, Nyse, Euronext, and the easiest way to buy them is through an online stock broker. To do this, you need to open an account and follow a broker's procedures, then start trading. You can trade Bravo Multinational Incorporated stock right from TradingView charts — choose your broker and connect to your account.
Investing in stocks requires a comprehensive research: you should carefully study all the available data, e.g. company's financials, related news, and its technical analysis. So Bravo Multinational Incorporated technincal analysis shows the strong sell today, and its 1 week rating is sell. Since market conditions are prone to changes, it's worth looking a bit further into the future — according to the 1 month rating Bravo Multinational Incorporated stock shows the sell signal. See more of Bravo Multinational Incorporated technicals for a more comprehensive analysis.
If you're still not sure, try looking for inspiration in our curated watchlists.
If you're still not sure, try looking for inspiration in our curated watchlists.