Energy Stock Surge? ENI S.P.A Bullish Breakout IncomingENI S.P.A, a leading global oil company, is currently trading at $14.18 , demonstrating strong bullish momentum on the weekly chart. Our proprietary W.ARITAs indicator reveals a significant buildup in bullish momentum, suggesting an imminent breakout from the well-defined inverted head and shou
Key facts today
Next report date
—
Report period
—
EPS estimate
—
Revenue estimate
—
0.95 USD
2.58 B USD
91.92 B USD
1.83 B
About Eni S.p.A.
Sector
Industry
CEO
Claudio Descalzi
Website
Headquarters
Rome
Founded
1996
ISIN
IT0003132476
FIGI
BBG000NHBZG9
Eni SpA engages in the exploration, production, refining, and sale of oil, gas, electricity, and chemicals. It operates through the following segments: Exploration and Production, Global Gas and LNG Portfolio, Refining & Marketing and Chemicals, Power & Renewables, and Corporate and Other Activities. The Exploration and Production segment engages in research, development and production of oil, condensates and natural gas, forestry conservation (REDD+) and CO2 capture and storage projects. The Global Gas and LNG Portfolio segment refers to the supply and sale of wholesale natural gas by pipeline, international transport and purchase and marketing of LNG, which includes gas trading activities finalized to hedging and stabilizing the trade margins, as well as optimizing the gas asset portfolio. The Refining & Marketing and Chemicals segment engages in supply, processing, distribution, and marketing of fuels and chemicals. The Corporate and Other Activities segment includes the main business support functions in particular holding, central treasury, IT, human resources, real estate services, captive insurance activities, research and development, new technologies, business digitalization, and environmental activities. The company was founded on February 10, 1953 and is headquartered in Rome, Italy.
Related stocks

ENI: MAKE MONEY SIMPLYEni, the largest company we have in Italy.
I simply show u what it means to invest by doing some trades without having to search for the nex Tesla or the perfect entry point on Bitcoin.
Eni pays good dividends, the price range is obvious even for a child, so why not use it? Or, why not to sell an

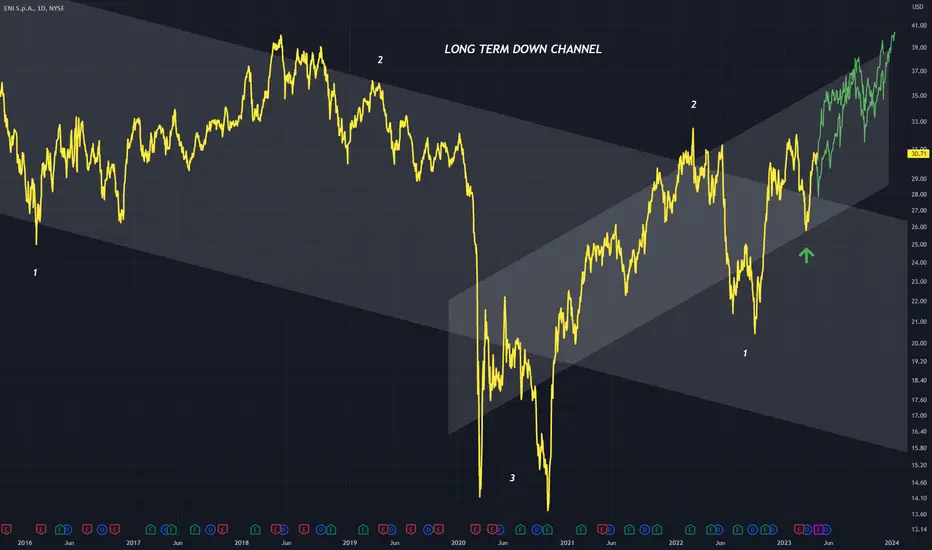
E - Down Channel BreakPrice is currently bouncing off the top of the long term down channel
This is within a smaller up channel that is taking its time to form
(1) label is the left and right shoulders
(2) label is the arms of the structure
(3) is the head
I expect the smaller up channel to continue for a bit following
Ready for a retest?HTF double bottom, or 8H double bottom that haven't been retested yet. I'm thinking we are soon to retest this, until EOY probably.
Double top on RSI, retest of previous high and many other signs, that makes me think this will be a nice short play.
Trendlines there for the orientation and confirma

ENI // Cup handle formation Close above 14.57 is requiredAlthough there is a cup-handle formation on the chart, let's look for closes above 14.57.

$E with a Neutral outlook following its earnings #Stocks The PEAD projected a Neutral outlook for $E after a POsitive Under over reaction following its earnings release placing the stock in drift A with an expected accuracy of 90.91%.

$E with a Bullish outlook following its earnings #Stocks The PEAD projected a Bullish outlook for $E after a Negative over reaction following its earnings release placing the stock in drift C with an expected accuracy of 75%.

ENI LongThe analyst consensus points to a rating of ´Underperform´. Average target price 31.7. Previous closing : 28.36 indicates for a potential upside 12%. Market Cap : 51,4Bn
Technical Analysis : Our price just hit the 50DMA we expect a pullback to our support and a green candle after it for a good ent

Portfolio and ENI Take profit (+50%)War.
High, very high volatility.
These are times when stocks move from traders to investors.
So it is right to accept drawdowns, obviously not in leverage and weighted, having liquidity to mediate when this problem passes.
However, there are some "favorable" situations even in these times, which

25/10/21 ENI guadagno giornaliero +1.20% usando tFrame 5 minMosse che andavano fatte il 25/10/21 sul titolo ENI
ACQ a 12,122
poi a 12,178 V+A
poi a 12,268 v+A
TOTALE GIORNATA 5 ESEGUITI e 0,146 guadagnati +1,20%
Uscire se ENI scende sotto i 12,268
Saluti. ESTERINA MATRAR 26/10/21 H 01,56

See all ideas
Summarizing what the indicators are suggesting.
Neutral
SellBuy
Strong sellStrong buy
Strong sellSellNeutralBuyStrong buy
Neutral
SellBuy
Strong sellStrong buy
Strong sellSellNeutralBuyStrong buy
Neutral
SellBuy
Strong sellStrong buy
Strong sellSellNeutralBuyStrong buy
An aggregate view of professional's ratings.
Neutral
SellBuy
Strong sellStrong buy
Strong sellSellNeutralBuyStrong buy
Neutral
SellBuy
Strong sellStrong buy
Strong sellSellNeutralBuyStrong buy
Neutral
SellBuy
Strong sellStrong buy
Strong sellSellNeutralBuyStrong buy
Displays a symbol's price movements over previous years to identify recurring trends.
BE6259268520
Eni Finance International SA 3.875% 09-NOV-2043Yield to maturity
3.03%
Maturity date
Nov 9, 2043
See all EIPAF bonds
Frequently Asked Questions
The current price of EIPAF is 18.34 USD — it has decreased by −0.81% in the past 24 hours. Watch ENI S.p.A. stock price performance more closely on the chart.
Depending on the exchange, the stock ticker may vary. For instance, on OTC exchange ENI S.p.A. stocks are traded under the ticker EIPAF.
EIPAF stock has fallen by −2.34% compared to the previous week, the month change is a −0.65% fall, over the last year ENI S.p.A. has showed a 21.38% increase.
We've gathered analysts' opinions on ENI S.p.A. future price: according to them, EIPAF price has a max estimate of 20.38 USD and a min estimate of 15.72 USD. Watch EIPAF chart and read a more detailed ENI S.p.A. stock forecast: see what analysts think of ENI S.p.A. and suggest that you do with its stocks.
EIPAF reached its all-time high on May 19, 2008 with the price of 40.94 USD, and its all-time low was 6.62 USD and was reached on Oct 28, 2020. View more price dynamics on EIPAF chart.
See other stocks reaching their highest and lowest prices.
See other stocks reaching their highest and lowest prices.
EIPAF stock is 0.82% volatile and has beta coefficient of 0.75. Track ENI S.p.A. stock price on the chart and check out the list of the most volatile stocks — is ENI S.p.A. there?
Today ENI S.p.A. has the market capitalization of 50.98 B, it has decreased by −4.01% over the last week.
Yes, you can track ENI S.p.A. financials in yearly and quarterly reports right on TradingView.
ENI S.p.A. is going to release the next earnings report on Oct 24, 2025. Keep track of upcoming events with our Earnings Calendar.
EIPAF earnings for the last quarter are 0.43 USD per share, whereas the estimation was 0.34 USD resulting in a 24.77% surprise. The estimated earnings for the next quarter are 0.38 USD per share. See more details about ENI S.p.A. earnings.
ENI S.p.A. revenue for the last quarter amounts to 22.11 B USD, despite the estimated figure of 22.17 B USD. In the next quarter, revenue is expected to reach 22.11 B USD.
EIPAF net income for the last quarter is 639.65 M USD, while the quarter before that showed 1.27 B USD of net income which accounts for −49.55% change. Track more ENI S.p.A. financial stats to get the full picture.
ENI S.p.A. dividend yield was 7.64% in 2024, and payout ratio reached 127.08%. The year before the numbers were 6.12% and 65.09% correspondingly. See high-dividend stocks and find more opportunities for your portfolio.
As of Oct 21, 2025, the company has 32.49 K employees. See our rating of the largest employees — is ENI S.p.A. on this list?
EBITDA measures a company's operating performance, its growth signifies an improvement in the efficiency of a company. ENI S.p.A. EBITDA is 16.58 B USD, and current EBITDA margin is 20.29%. See more stats in ENI S.p.A. financial statements.
Like other stocks, EIPAF shares are traded on stock exchanges, e.g. Nasdaq, Nyse, Euronext, and the easiest way to buy them is through an online stock broker. To do this, you need to open an account and follow a broker's procedures, then start trading. You can trade ENI S.p.A. stock right from TradingView charts — choose your broker and connect to your account.
Investing in stocks requires a comprehensive research: you should carefully study all the available data, e.g. company's financials, related news, and its technical analysis. So ENI S.p.A. technincal analysis shows the buy rating today, and its 1 week rating is buy. Since market conditions are prone to changes, it's worth looking a bit further into the future — according to the 1 month rating ENI S.p.A. stock shows the buy signal. See more of ENI S.p.A. technicals for a more comprehensive analysis.
If you're still not sure, try looking for inspiration in our curated watchlists.
If you're still not sure, try looking for inspiration in our curated watchlists.