PYTH - PERFECT - 110% gains BOOOOOM 🔥
I closed my EURONEXT:PYTH position with average +110% profit
Congrats guys!
Trade ideas
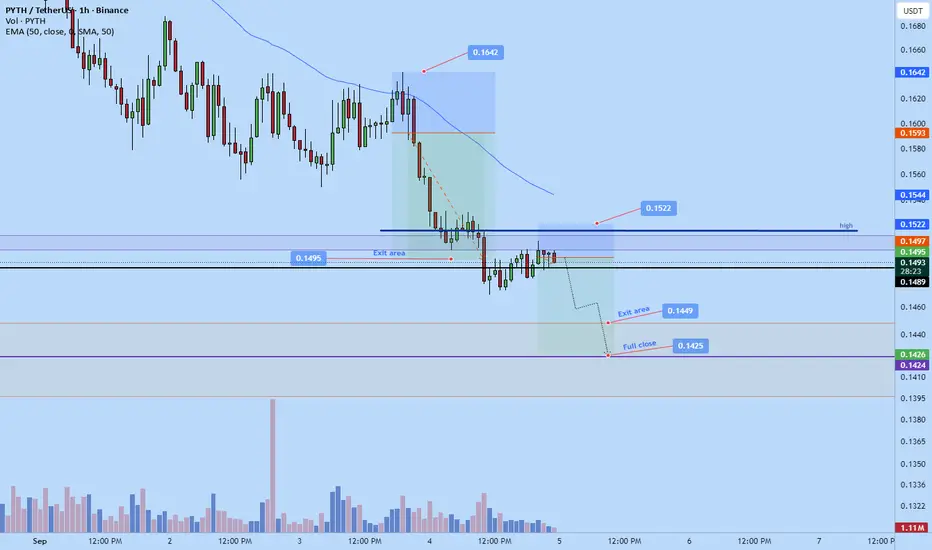
Pyth to dump again! $0.1425Just now opened a new short position on pyth. Expecting the dumping to continue today.
tp: 0.1425
Potential early closure at $0.1449
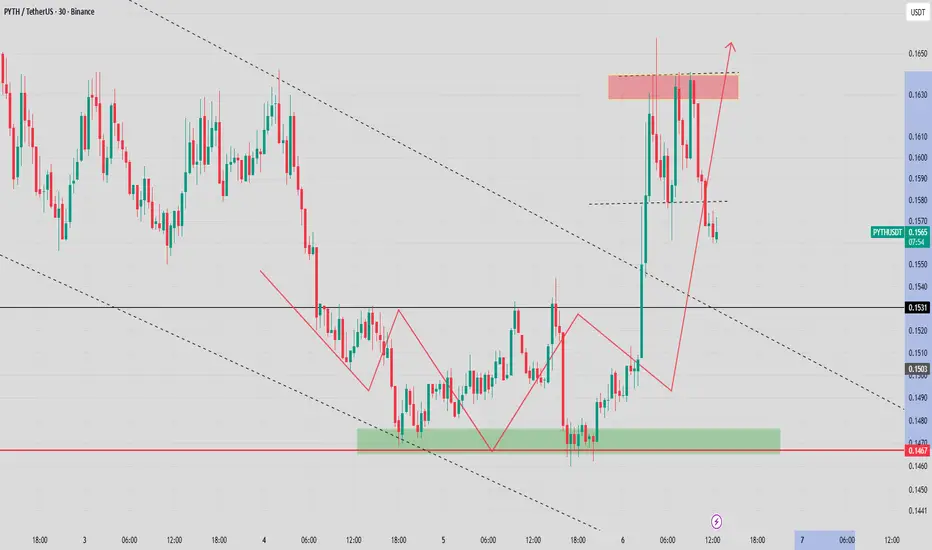
PYTH - bullish reaction awaited above 0.1450$ Will EURONEXT:PYTH pump back from this key level I mentionned?
1st entry was bad, but I think it's a good area for bulls here!
Key demand zone 0.1470 - 0.1450$
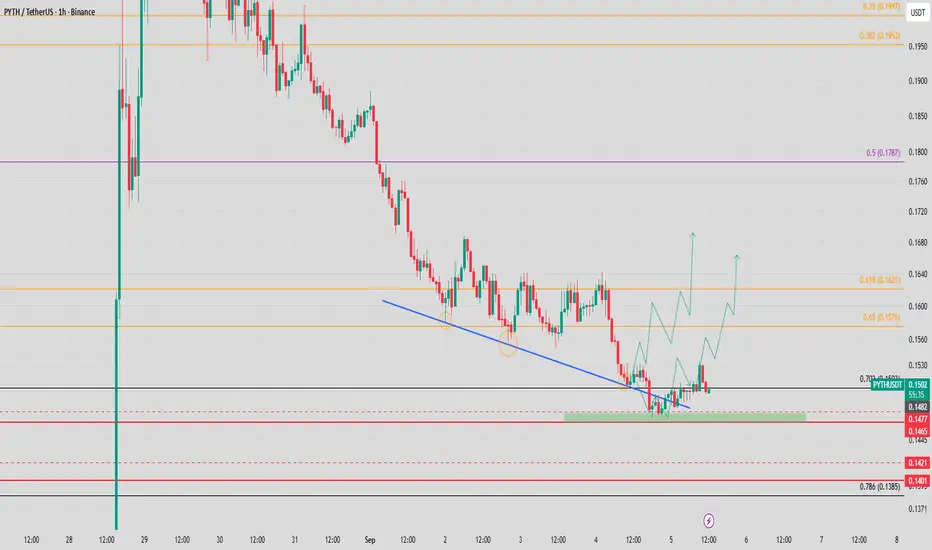
PYTH/USDT +300%Recently delivered a powerful breakout fueled by strong buyers, confirming bullish momentum. Following that move, price has now entered a healthy ~40% correction phase, offering a chance to reset before the next leg higher.
This correction presents an excellent opportunity to accumulate and DCA within the green box demand zone, positioning ahead of the next powerful bullish leg.
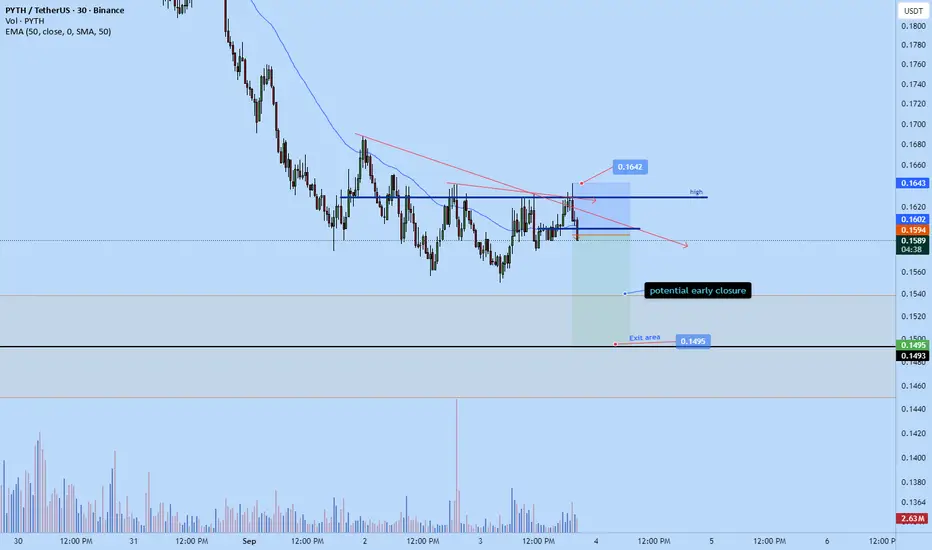
Pyth short back to $0.1495 areaJust now opened a short position on pythcoin. Aiming for $0.1495 area
roughly 2RR from my entry opted to use a relatively wide stop at $0.1642 for good invalidation.
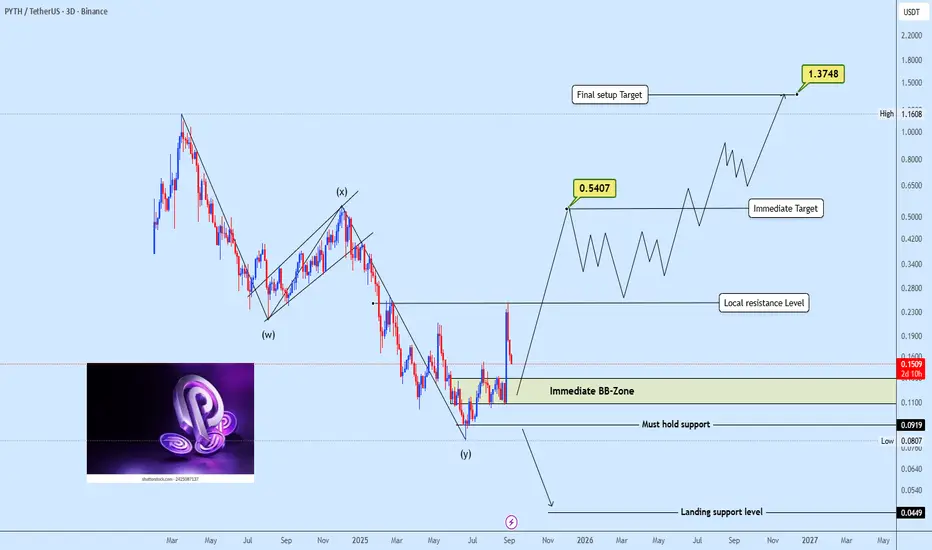
Could this be a bottom for PYTHUSDT?Pythusdt has completed its extended WXY correction, and the current rise from wave Y suggests a potential bottom formation.
Accumulate within the immediate BB-zone, then Watch local resistance closely a breakout could trigger a strong bullish move toward higher targets and If the BB-zone fails, price may extend lower toward the projected landing support.
What’s your outlook on PYTHUSDT here? Share your thoughts below
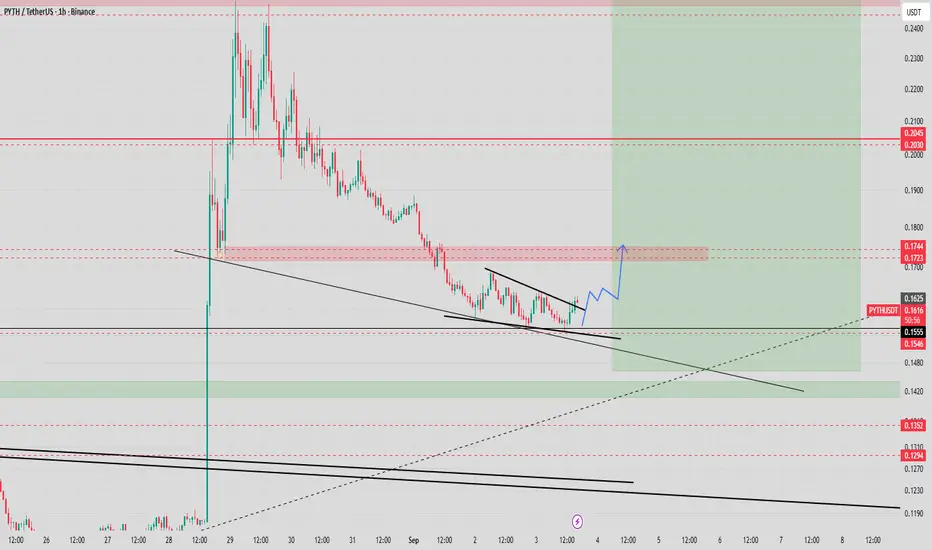
#PYTH - potential double bottom & key retest EURONEXT:PYTH - update:
Short term = bearish momentum but;
I'm pretty sure that another bottom is going to be see around the current zone here.
Another leg up toward 0.300$ could happen next 📈
Lower key demand zone 0.1400 - 0.1450$
What's your point of view on this one? 👀
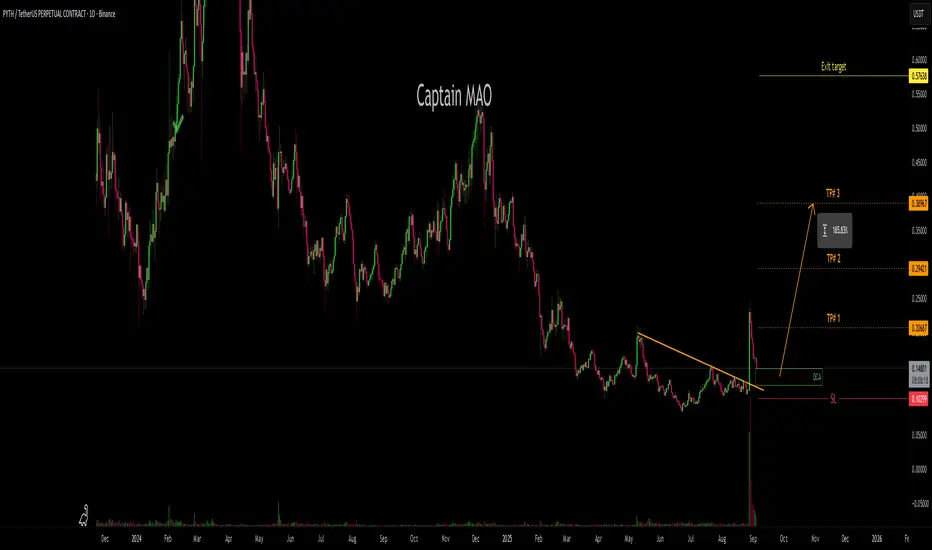
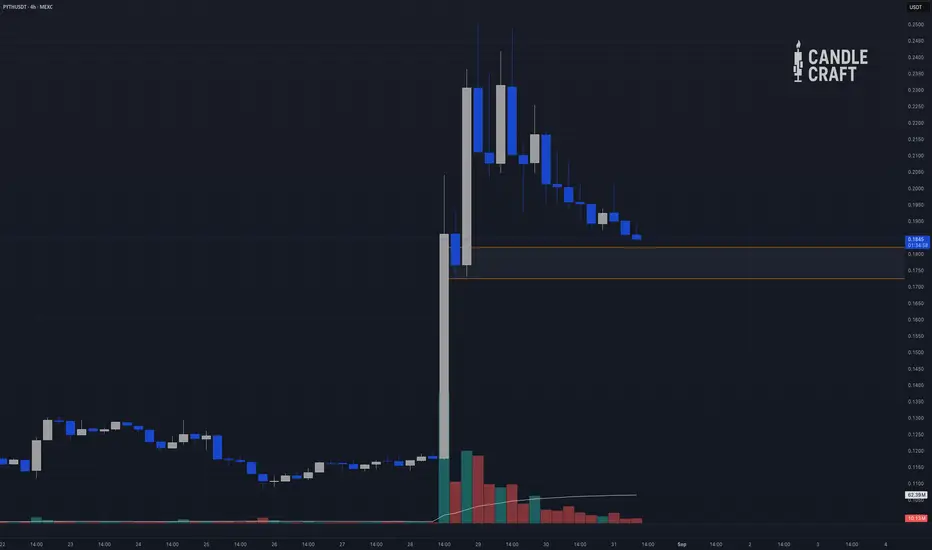
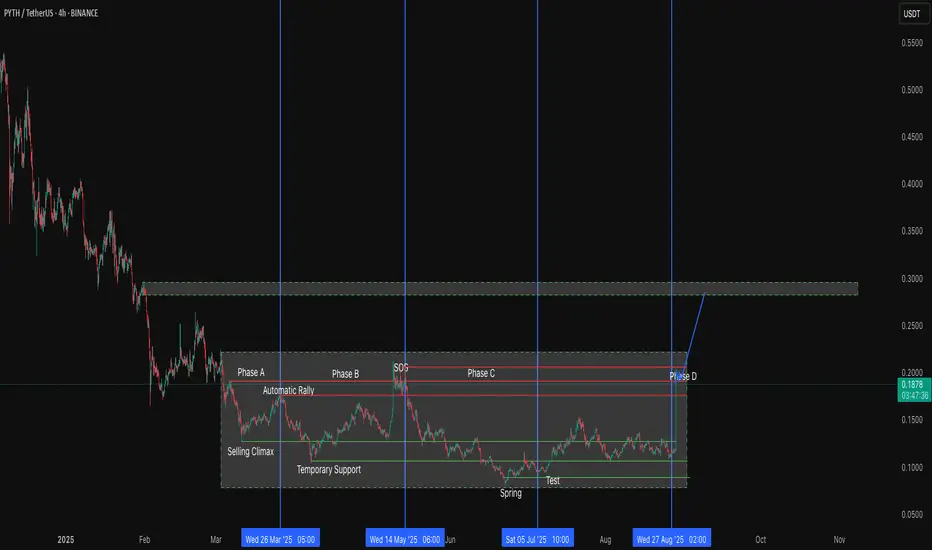
PYTH ROADMAPTo me the view is pretty clear.
* The purpose of my graphic drawings is purely educational.
* What i write here is not an investment advice. Please do your own research before investing in any asset.
* Never take my personal opinions as investment advice, you may lose your money.

PYTH — Let It Clean Lows, Then Reclaim (Patience Trade)Hey Candle fam, Heads-up: PYTH loves stop-cleaners. We want the 0.182→0.176 flush, reclaim + BOS up, then enter on the fill.
🔴 Scalp Setup — PYTHUSDT
1) HTF/MTF Bias (12H/4H)
• Price ≈ 0.186.
• Trend: MTF up; consolidating after a vertical pump.
• Sweep targets: below 0.182 → 0.176, above 0.195–0.205.
2) LTF Execution (15m)
• Confirmation: BOS up right after a sub-0.182 sweep (close beyond prior 15m lower high).
• OB/FVG: Enter on 50–100% fill of the displacement FVG created by the BOS leg; OB midpoint acceptable.
• Liquidity: below 0.182 / 0.176, above 0.195 / 0.205.
• Volume/Delta: Sweep candle ≥ 1.5× 20-bar average, or clear delta absorption at 0.178–0.182.
3) Derivatives
• OI: Expanded sharply; slight fade on pullback.
• Funding: Choppy, drifting toward neutral.
• CVD: Strong since breakout; watch for a 15m higher low.
• Resting liqs: 0.180 and 0.200–0.205.
4) Trade Map
• Bias: Long after sweep + BOS up.
• Sweep Zone: 0.182 → 0.176.
• Entry: 0.183–0.186 limit (FVG/OB 50–100% fill of BOS leg; allow fib drift to 0.65 only if momentum is A-grade).
• Stop: 0.1768.
• TPs: 0.194 / 0.200 / 0.205 (opt).
• RR: From 0.1845 fill → TP2 ≈ 3.2:1, TP3 ≈ 4.1:1.
• Trust Meter: A+ (85%).
👉 PYTHUSDT = Scalp A.
⚔️ Candle Craft | Signal. Structure. Execution.
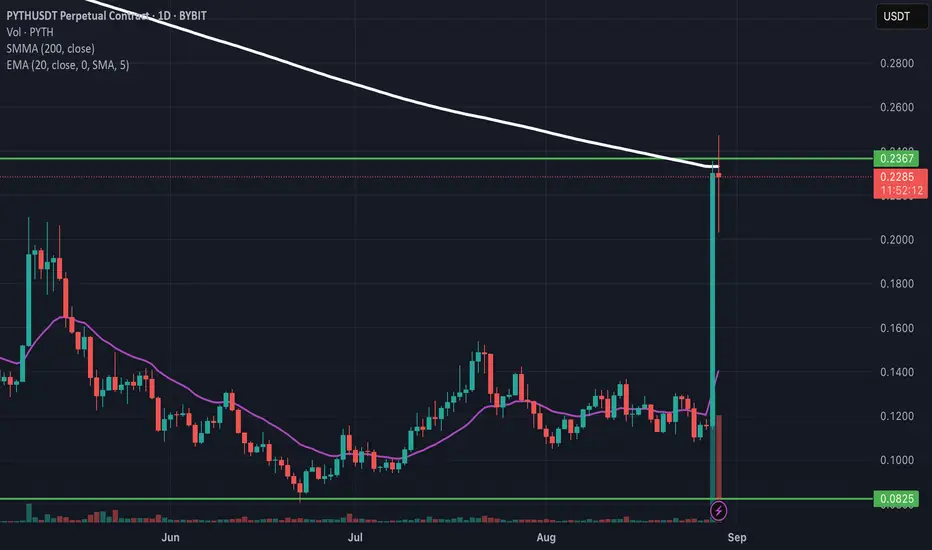
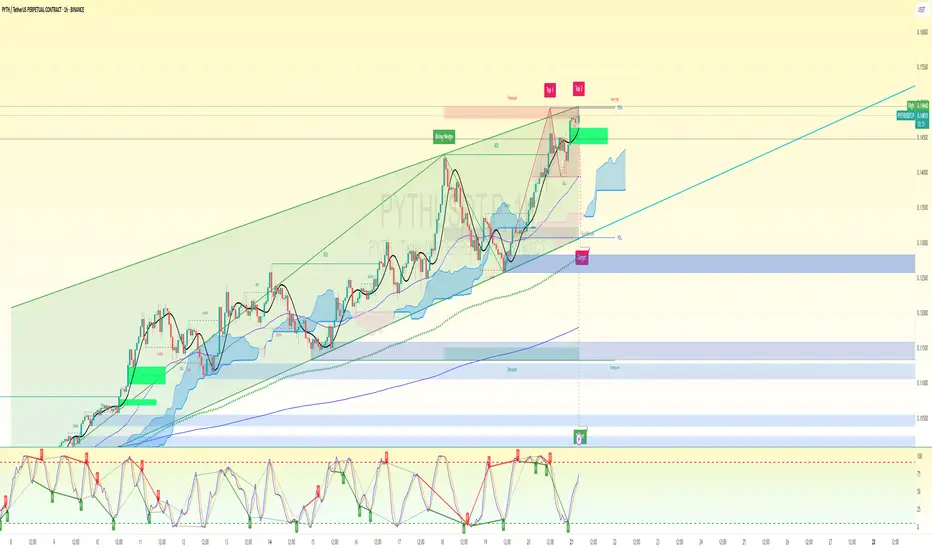
PYTH Short 7xEntree $02443
Trend line Daily
SL $02743
Top of Daily close
1st Target $18
Sell 50% - B/E
Final target $014

Short PYTH 7xEntree $02367
Trend line Daily
SL $025
Top of Daily close
1st Target $18
Sell 50% - B/E
Final target $014
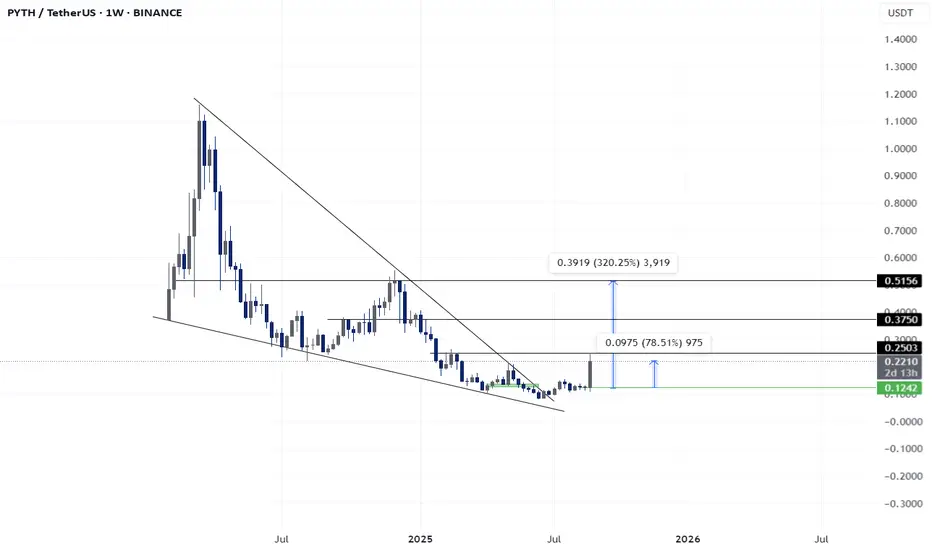
PYTH - LONG SET-UP GOING AS EXPECTEDBINANCE:PYTHUSDT
Going same as expected , 78% UP From our buying price
still target 3x
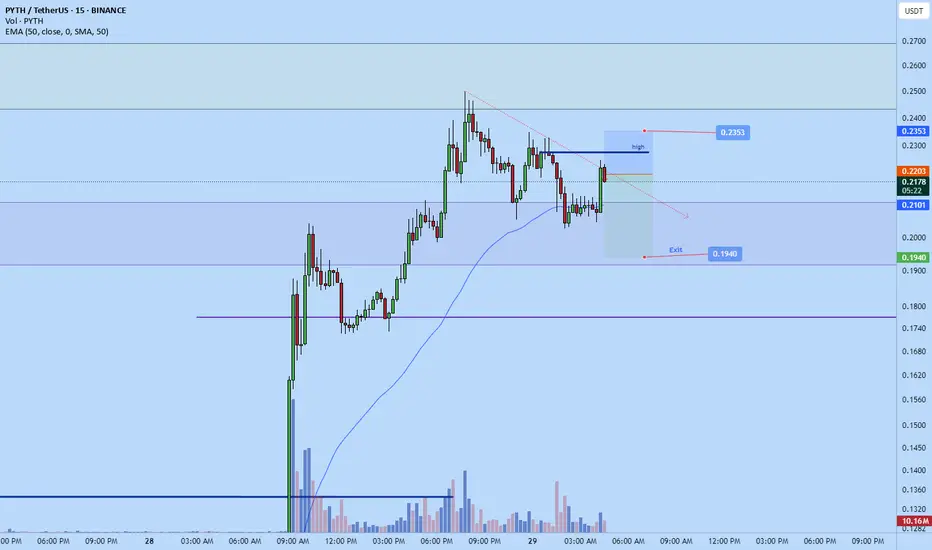

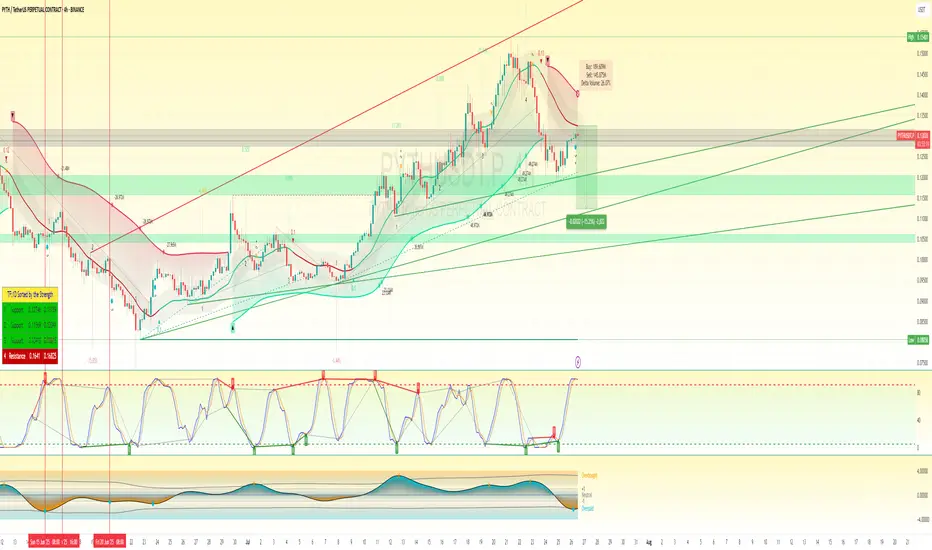
Bullish Breakout due to AccumulationWe have seen in the last couple of hours a buying pressure.In the last couple of months there has been an accumulation process of buying process.Today,we see price trading at a resistance level. A price acceptation of 0,185 possible will mean a price range breakout of this trading range leading to price drastically increase. to 0,27. Supply level that was not tested before, so an unmitigated supply.
Exclusive: Unlock the Secret Bullish $PYTH Strategy for Massive BINANCE:PYTHUSDT
Exclusive: Unlock the Secret Bullish EURONEXT:PYTH Strategy for Massive Gains!
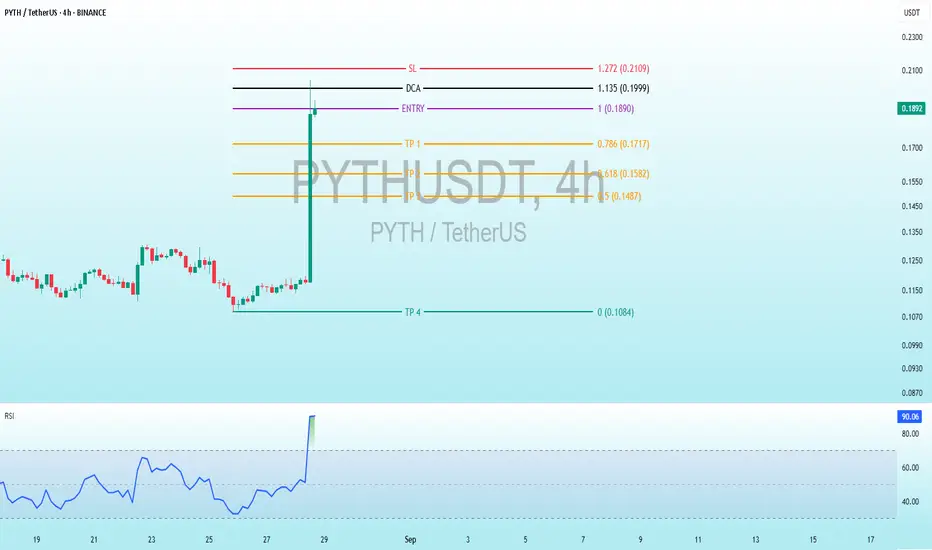
Trading Levels
The chart indicates predefined levels for a trading strategy:
Entry: 0.1890 - 0.1900 USD - The point where the trader plans to enter the market.
SL (Stop Loss): 1.272 USD - A high level to close the position at a loss, suggesting a possible typo or symbolic level (might be 0.1272, but clarification is needed).
TP (Take Profit): Four exit levels for profit:TP1: 0.786 USD (0.1717)
TP2: 0.618 USD (0.1582)
TP3: 0.5 USD (0.1487)
TP4: 0.1084 USD
DCA (Dollar Cost Averaging): 1.135 USD (0.1999) - A level for cost averaging, possibly for additional purchases if the price drops.
Price AnalysisThe price has experienced a sharp decline recently, reaching a low of around 0.1 USD, before recovering to the entry level (0.1890).
The current movement appears bullish, with a strong rise after a consolidation period, but the high RSI suggests a potential pullback or correction soon.
InterpretationStrategy: The chart suggests a high-risk, high-reward strategy. The TP levels are set with a relatively favorable risk-reward ratio, but the high SL (1.272) seems unusual and could be a typographical error.
RSI: The value of 90 - 89 indicates overbought conditions, which may signal a pullback or correction toward lower levels (e.g., TP2 or TP3).
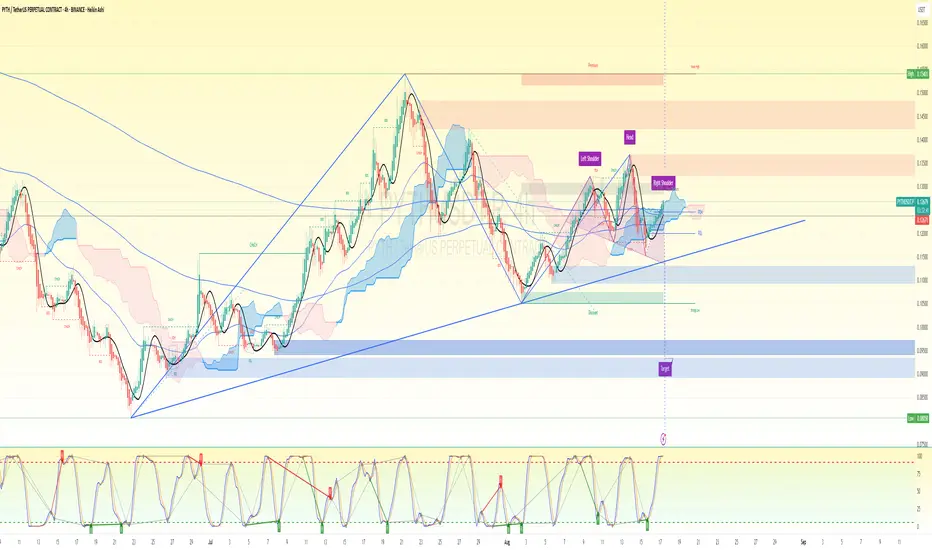
PYTH SHORT SETUP🔎 Chart Context
Pattern: A clear Head & Shoulders (H&S) structure has formed. Price is testing the neckline area (~0.126–0.128).
Indicators:
Stochastic RSI is pushing up from oversold → suggesting temporary relief rally.
Price is still inside/near the cloud resistance zone (bearish bias).
Target Zone: Marked at 0.090–0.095, aligning with the measured H&S breakdown.
📍 Precise Sniper Setup
Bias: Bearish (most probable continuation setup).
Entry (Short):
Aggressive: 0.1265 – 0.1280 (current price + neckline retest zone).
Conservative: Wait for a 4h close below 0.1230 (clean neckline break confirmation).
Stop-Loss (SL):
Above Right Shoulder high ~0.1315.
Safer SL: 0.1330 (above liquidity sweep zone).
Take-Profit (TP):
TP1: 0.1150 (near PDL / liquidity pocket).
TP2: 0.1050 (discount zone).
TP3 (Full H&S target): 0.090–0.095 range (your chart’s marked target).
⏳ Estimated Timeframe
If neckline breaks cleanly, TP1–TP2 can be reached in 2–4 days.
Full H&S target (~0.090) could take 5–10 days depending on momentum/volume.
✅ Summary (No bias):
Most probable trade = short from neckline zone (0.126–0.128) with SL above 0.1330 and targets down to 0.095.
If bulls reclaim and hold above 0.1330, the bearish setup is invalidated and shift to neutral → potential upside squeeze into 0.137–0.140.
PYTH BEARISH 🔍 Chart Context Analysis
Trend: Clearly bearish structure with persistent lower highs and lower lows.
Price Location: Trading below the EMA cloud and under both descending trendlines — shows bearish control.
Stochastic RSI (8H): In overbought region and beginning to roll over — early signal of bearish momentum building.
MACD/Stochastic Momentum Below: Shows recent bullish recovery but now stalling near the midline, potentially turning.
Volume: Volume is weak and not supporting a strong bullish reversal.
Liquidity Pools Below: Thick demand zones between $0.105 – $0.100 and $0.085 – $0.080 visible.
🟠 Most Probable Setup: Bearish Rejection from EMA Cloud
This is a short trade setup rejecting from the EMA resistance zone and trendline.
🔹 Sniper Entry:
Entry Zone: $0.1160 – $0.1170 (current price range)
Ideally enter near $0.1170 if price sweeps it on a wick and rejects
Stop loss should sit above the recent swing high and trendline confluence
🔹 Stop Loss (SL):
$0.1205
Just above EMA cloud and previous bearish breaker
Invalidates the setup if price sustains above this level
🔹 Take Profit Targets:
TP1 Range: $0.1105 – $0.1080 → (first support + minor liquidity zone)
TP2: $0.1050 → (major demand/4D support low)
TP3 (optional): $0.1000 → (if momentum continues and stochastic breaks down hard)
⏱️ Estimated Timeframe for TP Hits:
TP1: 6–12 hours
TP2: 18–24 hours
TP3: 1.5–2.5 days (if broader bearish move unfolds)
✅ Key Reasons for Bearish Bias
EMA cloud acting as dynamic resistance.
Stochastic RSI overbought and potentially crossing down.
Price under HTF trendlines and structure.
No strong bullish volume spike — indicating weak bull follow-through.
Multiple liquidity pools still uncollected below ($0.105 – $0.100).
🚫 When to Invalidate the Short:
Price closes above $0.1205 on 8H candle.
Bullish volume spike with engulfing candle.
Bullish breakout through both descending trendlines.
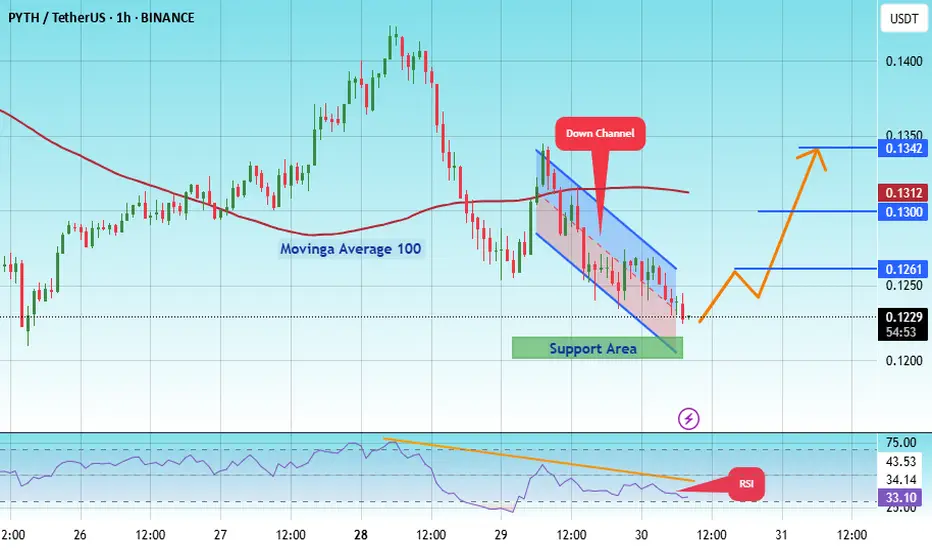
#PYTH/USDT#PYTH
The price is moving within an ascending channel on the 1-hour frame, adhering well to it, and is on track to break it strongly upwards and retest it.
We have support from the lower boundary of the ascending channel, at 1215.
We have a downtrend on the RSI indicator that is about to break and retest, supporting the upside.
There is a major support area in green at 0.1200, which represents a strong basis for the upside.
Don't forget a simple thing: ease and capital.
When you reach the first target, save some money and then change your stop-loss order to an entry order.
For inquiries, please leave a comment.
We have a trend to hold above the 100 Moving Average.
Entry price: 0.1230
First target: 0.1261
Second target: 0.1300
Third target: 0.1342
Don't forget a simple thing: ease and capital.
When you reach your first target, save some money and then change your stop-loss order to an entry order.
For inquiries, please leave a comment.
Thank you.
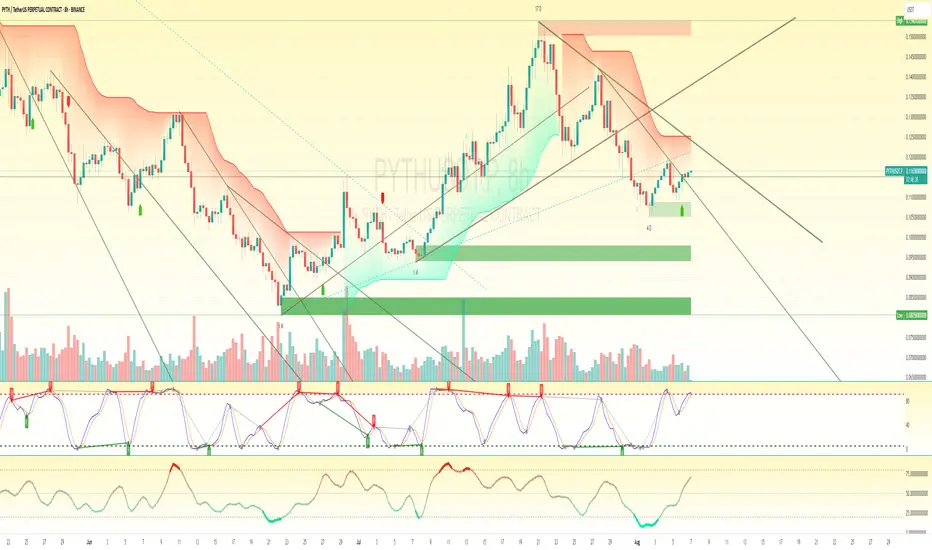
PYTH SHORT SET UP (version 2)🔍 Current Context:
Price is trading around $0.13007, just above a major reclaimed support demand zone ($0.126–$0.120).
4H Stochastic RSI is entering the overbought zone (high-risk for new longs).
Price has bounced off a local Fib level + trendline cluster.
Volume delta favors buys, but candles show hesitation near EMA zone.
✅ Most Probable Trade Setup: Bearish Reversal Sniper (Short Bias)
Reason: Price has rallied back into a key resistance zone + 4H EMA cloud, and Stochastic RSI is in overbought. Momentum is stalling under $0.1325. Unless bulls reclaim above $0.1345–$0.1355 cleanly, a rejection and pullback is highly probable.
🧨 Entry (Short):
Entry Range: $0.1320 – $0.1335 (as close to EMA ribbon & resistance cluster as possible)
🎯 Take Profit (TP1 Range):
TP1 Range: $0.1235 – $0.1215 → retest of reclaimed support
TP2 (optional): $0.1170 zone (deeper liquidity pocket)
🛡️ Stop Loss (SL):
Hard SL: Above $0.1358
OR above 4H swing high at $0.1370, if allowing some buffer
📉 Risk-to-Reward:
R: 0.0038
R:R ≈ 2.5–3.5 depending on exit zone
🕰️ Estimated Trade Duration:
TP1 zone hit could take 6–12 hours, based on 4H cycles
TP2 hit in 12–24 hours if momentum holds down
🔁 Invalidation:
Clean break and 4H candle close above $0.1358, invalidates short setup
In that case, wait for pullback to long above $0.136 if strength persists
🚨 Summary:
Most Probable Setup = Short
Reason: EMA rejection + Stoch RSI overbought + weak candle momentum
Action: Enter $0.1320–$0.1335 | SL above $0.1358 | TP1 $0.1235–$0.1215
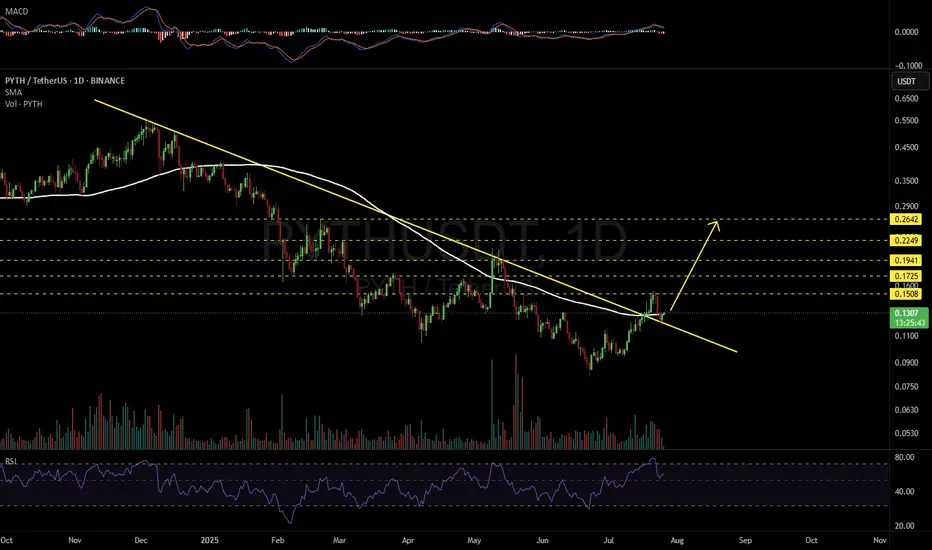
PYTHUSDT 1D#PYTH has broken above the descending trendline, and the retest has been completed successfully. It is now on the verge of breaking out above the daily SMA100.
If the daily candle closes above it, the upside targets are:
🎯 $0.1508
🎯 $0.1725
🎯 $0.1941
🎯 $0.2249
🎯 $0.2642
⚠️ As always, use a tight stop-loss and apply proper risk management.
PYTH SHORT set upBias: Rejection at weak high above PDH into premium zone with bearish divergence and overbought oscillator
🔍 Confluences:
✅ Price in premium zone
✅ Wick rejection at weak high
✅ Stochastic RSI double top + bearish divergence
✅ Price extended away from 9/EMA baseline
✅ Possible inducement sweep of PDH liquidity
✅ Low volume on final push (distribution behavior)
🎯 Sniper Entry Zone:
Entry (Short): 0.1440 – 0.1455
(Markets may try one more inducement wick above PDH. Set alerts and place partial limit above 0.1445)
💰 Take-Profit Range (TP1):
TP1 Range: 0.1300 – 0.1320
(Aligns with top of cloud / 4H equilibrium retest zone and PDL proximity)
TP2: 0.1220
(Targeting full EQ zone retest / liquidity void)
🛡️ Stop Loss (SL):
SL: 0.1476
(Hard stop just above the weak high and final supply zone. Small buffer for possible wick)
🧠 Risk-Reward (R:R):
TP1 R:R: ~2.8:1
TP2 R:R: ~5:1
⏳ Estimated Timeframe for TP1:
Within 6–12 hours, assuming the reversal confirms on 1H close and momentum follows through.
🚨 Tactical Notes:
Watch for 1H close back below 0.1410 as added confirmation.
Momentum divergence + overbought suggests exhaustion.
Lock in profits at TP1, trail SL to BE, and let rest run if targeting TP2.
PYTH/USDT Breakout Watch Is the Accumulation Phase Finally Over?📌 Technical Overview:
After nearly 8 months in a strong downtrend, PYTH/USDT is now showing signs of a potential trendline breakout. Price action is testing a critical descending resistance that has been respected since late 2024. This could be the turning point for a major trend reversal.
📉 Historical Context:
PYTH reached a high of $0.55, followed by a consistent downtrend with a series of lower highs and lower lows.
Since June 2025, however, the structure has shifted to higher lows, signaling early accumulation and waning bearish momentum.
📐 Technical Pattern: Descending Trendline Breakout
Price is currently challenging a long-term descending trendline, which has held as resistance since November 2024.
The pattern resembles a falling wedge/descending triangle breakout, typically viewed as a bullish reversal pattern.
A recent bullish candle is attempting to break above the $0.13 level, indicating growing momentum.
🟩 Bullish Scenario: The Reversal is On
If price closes above $0.13–$0.14 and confirms the breakout:
1. Short-Term Targets:
🔼 $0.1736 (Minor resistance / previous demand zone)
🔼 $0.1952 (Breakout retest zone)
2. Mid-Term Targets:
🔼 $0.2457 (Strong consolidation area)
🔼 $0.3196 – $0.3912 (Pre-breakdown range highs)
3. Long-Term Target:
🔼 $0.5258 – $0.5533 (Previous market top)
> A successful breakout could trigger a rally of +200–300%, especially if supported by market-wide bullish sentiment.
🟥 Bearish Scenario: Fakeout Risk
If price fails to hold above the trendline and drops below $0.12:
Support zones to watch:
🔽 $0.1000 (psychological level)
🔽 $0.0860
🔽 $0.0807 (major bottom support)
This would indicate a bull trap, and the market could return to a distribution phase.
🔍 Additional Confluences:
RSI is rising toward 60–65, suggesting bullish momentum is building.
Volume is increasing near the breakout — a good sign of trader interest.
A Golden Cross (EMA 50 crossing EMA 100) could occur soon if upside holds.
✅ Conclusion: Critical Pivot Zone
PYTH is testing a major inflection point. If confirmed, this breakout could end the long-term downtrend and launch a new bullish cycle. A rejection here, however, keeps the bear case alive.
#PYTHUSDT #PYTHBreakout #CryptoAnalysis #AltcoinSetup #TechnicalAnalysis #BreakoutCrypto #TradingView #TrendReversal #CryptoSignals #FallingWedge #BullishMomentum
