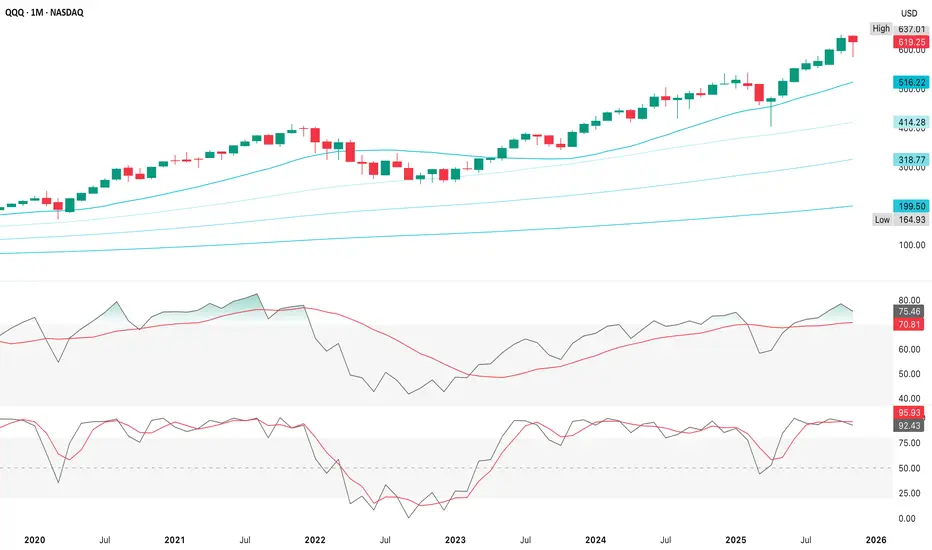
QQQ (28 November)November's monthly candle is closer to a hanging man than a hammer, but the context determines whether it’s actually bearish, since a true hanging man requires 1) a long lower shadow (yes), 2) a small real body near the top of the range (yes) & 3) appears after a strong uptrend (definitely yes)
The candle is bearish only if the next candle confirms with a break below the low
A hammer has the same shape, but appears after a downtrend , which is not the case here
So structurally it matches a hanging man, not a hammer, but a hanging man is a weak signal on higher timeframes without confirmation
The setup appears neutral-to-risky, but not confirmed bearish
The close is still strong, near the top of the range
There’s no follow-through since November just ended
Momentum (RSI/stoch) are cooling, but not rolling over
Price is still well above the 20 SMA
Historically on QQQ, monthly hanging man candles often lead to nothing unless the next month breaks the prior month’s low
The signal is warning, not reversal
The long-term structure is still upward
The 20 SMA around $516 is the first major support in a correction
Price at ~$619 is massively extended above all long-term trend baselines
This makes a blow-off or exhaustion candles more likely
Big wicks more common
Long-term risk higher than short-term risk, but none of this says “trend over"
The November candle is has bearish potential, not confirmed bearish
The up trend is strong which reduces the reliability of reversal patterns
SMAs are flattening, but not breaking so long-term uptrend fully intact
Confirmation is missing, or not yet realized
Trend is still bullish & the candle is just noise at the top of an extended move
If QQQ breaks below the low of that monthly candle in December (~$590), it would confirm the hanging man & open a deeper retrace toward the 20 SMA (~$516)
If next month stays above the low, the hanging man is invalid & the trend continues
Trade ideas
QQQ The Road Not TakenA trend reversal requires a higher high, followed by a higher low that holds & a second higher high - it needs that staircase
Sell volume should decline on dips & buy volume should rise on bounces
QQQ did see rise in volume on the reclaim of the 50d MA & that leans bullish, but we need to see if that continues into Monday-Tuesday
The bounce off the October low above the POC to the VAH usually leads back inside the range again
The market is not trending as participants reset inventory
There is a no structural higher-high sequence
Higher timeframe moving averages (20d/50d) still overhead/flat
No major volume climax that signals accumulation
This is exactly what we’d expect in the middle of a range
The bounce off VAL is meaningful, but the strength of the reclaim hasn't printed a higher low & QQQ hasn't broken above VAH with acceptance
Price needs to break above the VAH & consolidate above it (not just wicks/intraday spikes) to cause a trend reversal
Actual acceptance above value
Calling it a reversal leads to chasing the top & misses shorting the strongest part of the move
Price is testing the 4H downtrend line for the 4th time & downtrend lines become stronger each time they’re respected, but the 4th-5th hit is also where they often break, so this is a real inflection point - price is now at the perfect point to fail
This is not yet a confirmed trend reversal
QQQ is in a transitional phase with a potential reversal setup, contingent on holding a very specific level
The recent rally pushed above the prior swing lower-highs & that’s the first requirement of a reversal; however, we do not yet have a higher low
The pullback after breaking above those highs hasn’t printed a clean, confirmed higher low & until that happens, no one can classify this as a trend reversal
This is early-stage reversal behavior, not confirmation
This chart has one single number that tells you everything, the upper red shelf of the volume profile (~$620)
If QQQ closes above it & accepts, the trend reversal is active
If QQQ rejects it & slips back under the 50d MA
QQQ is at the doorstep of a trend reversal
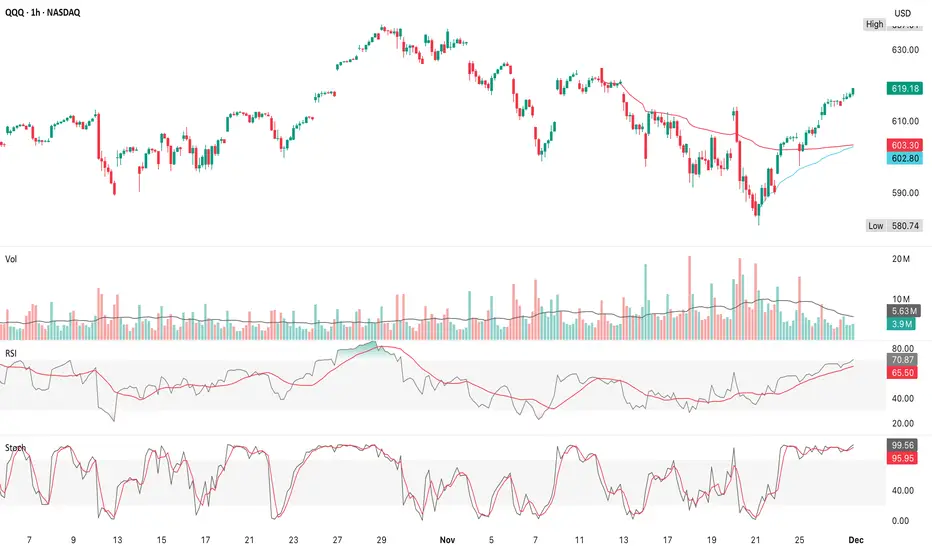
Whenever 2 anchored VWAPs converge, it almost always precedes a breakout if buyers win the retest, or a rejection and full revisit of lows if sellers win
The 10 October AVWAP acted as resistance during the entire decline & is a “memory line” for sellers
QQQ just pressed into it again, but hasn't cleanly reclaimed it
The 21 November AVWAP is rising, respected & acting as support on the last two pullbacks, which is constructive
Momentum is supportive, not conclusive
RSI broke its own downtrend line, but hasn’t made a structural higher high & is sitting right under the midline resistance zone
Stochastic fast %K turned sharply upward, is overbought, but in emerging trends this stays overbought
It's not yet rolling over, so buyers still have short-term momentum
Volume on the bounce is higher than the prior 2 declining sessions which supported the reclaim of the short-term VWAP, not capitulation volume, but does not need to be for a structural inflection
The absence of heavy sell volume after tagging the 10 October VWAP is noteworthy
That VWAP usually triggers a strong sell reaction, but this time it didn’t
QQQ is directly between long-term sellers (10 October AVWAP) & newly established buyers (21 November AVWAP)
That’s how reversals start, but also how traps form
This is a decision point, not a trend
QQQ is right up against the boundary that will define the next 2 weeks
A break and close above 10 October AVWAP signals sellers are done
A break above $612-$614 (prior swing high) confirms structural reversal (higher high)
A retest 10 October AVWAP, hold, then push higher is the “acceptance” signal
Above that, bulls have full control and this becomes a trend reversal
Look for a sharp rejection off 10 October AVWAP, it's a classic continuation down move
Lose 21 November AVWAP on a close & this would confirm the bounce was just rotational
Break below $588-$590 kills the higher-low structure that is forming
Based on the 4H chart, it slightly favors the bullish side as of now because buyers are defending their AVWAP with real activity, sellers failed to slam price at the first test of their AVWAP, momentum flipped from negative to neutral-bullish & price is curling upward into resistance with higher lows, but a failure at the 10 October AVWAP turns this into an immediate downside rotation
If AVWAP breaks, entry on acceptance above 10 October AVWAP with a stop under 21 November AVWAP for a target back to $620 & maybe $628 (range highs)
If rejection triggers, short the rejection wick off 10 October AVWAP with a stop above AVWAP for a target $596 to $590 & maybe $583
It's a holiday week ahead of Thanksgiving & that context matters a lot for how you read every signal on your charts right now because holiday-week flows around Thanksgiving have very specific, repeatable market behaviors that can completely distort what looks like a trend reversal or breakdown
Liquidity is fake or thin & signals look stronger
Market depth is shallow
High-frequency participants step back
Dealers provide less size
Futures markets lead cash markets
Volume shrinks, but ranges don’t necessarily shrink
This creates exaggerated up-moves
A small amount of buying can march price up through multiple levels.
Exaggerated down-moves
A single aggressive seller or macro hedge can flush price 1-2% with no real follow-through
Neither is “real” since it’s the effect of thin books
So those VWAP interactions, those higher low attempts & even that 50d reclaim are all valid structurally, but they’re not confirmed until we see them in normal liquidity
This is why the reversal/rotation distinction is fuzzy
The market isn’t trading at full signal strength
Thanksgiving week historically favors upside drift
Indices tend to float upward into the holiday as funds dress books, shorts de-risk & dealers maintain positive gamma
No new major economic releases
No new institutional rebalance flows
This is not a “trend reversal” - it’s mechanical upward drift
QQQ fits this perfectly
A bounce off value
Grind up toward overhead VWAP resistance
Momentum oscillators improving
Volume profile resistance approached, not broken
This is classic pre-holiday digestion
The real test comes the week after Thanksgiving
The key levels (especially those anchored VWAPs) almost never resolve during this week
The real outcome shows up when liquidity returns, funds resume normal size, post-holiday rebalance flows hit, options positioning resets & macro traders put risk back on
If the breakout is real then it confirms next week
If it was fake then it rejects hard early next week
That’s why this week often produces false starts
Price is moving, but the information value is low - the moves are real, but the signal is not

QQQ's 3rd PillarAAPL is the strongest of the 3 generals since price is holding above it's 20d MA with no meaningful breakdowns since mid-October
Higher highs/higher lows intact
AAPL is the relative strength leader
Pullbacks are still being bought
Upside momentum is slowing, but no bearish triggers
MSFT cleanly bounce from oversold, but still a repair phase
Hit lower Bollinger from the highs in late October
Strong rebound off ~$465
Still below its prior support around $520-$530, so this rally is still “inside the correction”
This is a reaction rally after a near-vertical flush
MSFT is repairing damage, not in breakout mode
It’s the “middle child” right now, stronger than NVDA, weaker than AAPL
NVDA is the odd one out (weakest)
Clear lower highs since the early-November peak
Broke down through $195 & failed to reclaim it convincingly
Trading below its short-term MA
NVDA is objectively the weakest structure, it's trend is broken, momentum pushing down, failed bounce attempts & chart resembles early-stage trend deterioration, not a completed correction
All three semis/chips (NVDA) have shown relative weakness lately vs megacap tech (AAPL + MSFT)
This aligns with QQQ given rotation inside tech rather than broad risk-on
AAPL doesn’t support a bearish tilt (too strong)
MSFT is neutral, but slightly bullish short-term
NVDA supports a bearish tilt (weak structure, momentum down)
QQQ weighting is heavily influenced by AAPL + MSFT, which are not breaking down
These charts do not reinforce a clean bearish thesis
They show rotation (NVDA weakness), but no index-leader breakdown (AAPL/MSFT still intact)
To get a real QQQ rollover, you typically need AAPL + MSFT to crack simultaneously
AAPL is the single most important line of defense for QQQ
Downside risk only becomes serious if AAPL loses trend with critical Levels at $268-$270 (the rising short-term trend support) & the top of the old consolidation from late October
A break would first invalidate momentum, then flip the trend down
If AAPL closes <$268, you’re no longer in “bull flag mode,” but in trend reversal territory & QQQ loses its strongest pillar
MSFT is the canary for liquidity since MSFT drives a ton of passive flow
Its rebound is strong, but it’s a reaction rally inside a broken structure
This is the rebound low & the base of the prior breakdown
Losing this means the bounce was a dead-cat & confirms a larger down-leg
A daily close <$480 signals recovery failed, sellers in control & next level becomes ~$460
That is a meaningful QQQ drag
NVDA is already weak
NVDA is the weakest chart of the 3 generals
It does not have to break down to add downside pressure, but there is a level where selling accelerates sharply, $170-$173, the base of the November flush
A close <$170 opens a vacuum to $160 to $150 fast
That would be a serious volatility event for QQQ
Genuine QQQ downside risk appears only when 2 of the 3 megacaps break, so if these 2 things happen, downside risk is confirmed
AAPL closes <$268-$270
MSFT closes <$480-$485
At that point, QQQ loses AAPL’s trend support & MSFT’s liquidity bid
NVDA is already structurally weak, so the combined effect is decisive
Those two breaks together flip the entire index environment from “bullish trend with rotation” to “index-level breakdown”
Alphabet (GOOGL) has been the stealth leadership bid
When AAPL & NVDA wobble, Alphabet often becomes the rotational safety valve inside QQQ because it trends cleanly, absorbs passive flows (huge weighting) & attracts “quality growth” buyers when semis weaken
This stabilizes QQQ even when one of the top names is soft
But here’s the nuance
Alphabet’s strength can support QQQ, but it cannot prevent a QQQ breakdown if AAPL or MSFT crack key levels given weighting reality of AAPL + MSFT = ~23-26% of QQQ
GOOGL (A + C) = ~8-10% total
Alphabet can dampen downside, not cancel it
Alphabet’s run-up is a sign of “healthy rotation,” not froth
Alphabet’s recent behavior looks like trend accelerating, rising volume on up days, oscillators in a bullish regime but not overcooked & clean support at each pullback
This is classic “institutional accumulation”
When markets are topping, you don’t typically see new leadership emergences - you see everything stall
Alphabet rising while NVDA weakens suggests this is sector rotation, not index distribution
It tells you “the market is not in risk-off, but in reshuffle mode"
Alphabet’s strength delays downside - it doesn’t prevent it
NVDA breaking down is a noticeable drag, MSFT breaking $480 is a real drag & AAPL breaking $270 is an index “air pocket” event
Alphabet can counter only 1 of these circumstances, not 2
When the flows in the biggest names turn, Alphabet’s strength becomes irrelevant because passive flows unwind, systematic strategies flip short/flat, correlations compress toward 1 & Alphabet gets sold with the others at that point
Alphabet helps explain why QQQ hasn’t rolled over yet
This is the key practical takeaway
Alphabet’s strength is the reason you’re seeing shallow dips, the reason VIX isn’t reacting much & the reason QQQ keeps getting saved above key levels
It’s functioning as a 3rd pillar, replacing NVDA for now, but again, it cannot offset a structural loss of AAPL or MSFT
The combined model (AAPL, MSFT, NVDA, GOOGL)
If Alphabet stays strong & AAPL/MSFT hold, pullbacks are just noise
If Alphabet stays strong, but MSFT breaks $480, QQQ slides, but not violently
If Alphabet is strong, but AAPL breaks $270, QQQ drops harder than you expect
If Alphabet weakens & either AAPL or MSFT fail, sharp downside becomes likely
Alphabet is a stabilizer, not a shield
Alphabet’s run-up tells you institutions are still allocating into megacap tech, the market is rotating, not distributing & QQQ won’t break on NVDA weakness alone
I
t delays downside risk, but does not erase it
The real triggers remain AAPL <$270 & MSFT <$480
QQQ is short-term bullish, but not yet a durable trend reversal
The 21 November AVWAP has been acting like a dynamic rising support line
Price respected it during every hourly pullback
Friday’s price extended above it into stretched momentum territory which means buyers have controlled the bounce, but this AVWAP is far from price now so mean-reversion risk increases
Both AVWAPs show an extended, overbought bounce with no real test of strength
The rally from the 21 November low is steady, one-sided, over-extended, on declining volume, into a major prior supply & without a single higher-volume accumulation candle
This looks almost exactly like a corrective rally into resistance, not a fresh impulse trend
NASDAQ:QQQ AMEX:SPY NASDAQ:AAPL NASDAQ:GOOGL NASDAQ:MSFT NASDAQ:NVDA

QQQ Trading Opportunity! SELL!
My dear friends,
QQQlooks like it will make a good move, and here are the details:
The market is trading on 619.15 pivot level.
Bias - Bearish
Technical Indicators: Supper Trend generates a clear short signal while Pivot Point HL is currently determining the overall Bearish trend of the market.
Goal - 609.75
Recommended Stop Loss - 623.82
About Used Indicators:
Pivot points are a great way to identify areas of support and resistance, but they work best when combined with other kinds of technical analysis
Disclosure: I am part of Trade Nation's Influencer program and receive a monthly fee for using their TradingView charts in my analysis.
———————————
WISH YOU ALL LUCK

QQQ: Market of Sellers
Looking at the chart of QQQ right now we are seeing some interesting price action on the lower timeframes. Thus a local move down seems to be quite likely.
Disclosure: I am part of Trade Nation's Influencer program and receive a monthly fee for using their TradingView charts in my analysis.
❤️ Please, support our work with like & comment! ❤️

QQQ bullish then bearish?i think were in a topping proccess somthing to watch out for we are already seeing the reasons to be bullish evaporate i think we could possibly take out the high but the aftermath will be brutal! wdy think??
AI Bubble? Or Risk of a Flash Crash.New Technology that is used too soon and or improperly used before it is fully tested and regulated is, historically, the cause of every prior Flash Crash.
Flash Crashes are not just on the 3 major indexes but also occur on individual stocks, Stock Derivatives, Sectors, and Industries.
New Technology Bubbles form at the END of a Long Term Great Bull Market.
This bull market is only 2+ years old and the technical patterns confirm: there is no bubble.
There is uncertainty, misuse of AI, AI mistakes and errors in analysis, AI misinterpretations, and AI making up an answer when it can't find data on that topic.
The sideways trend that the indexes and many stocks are in right now is a short term to intermediate term correction that is quickly patterning out any excessive speculation.
At this time speculation and gambling mode trading by retail groups and smaller funds managers has evporated.
The sideways trend is common. The stock market of today trends sideways more often than uptrending or downtrending.

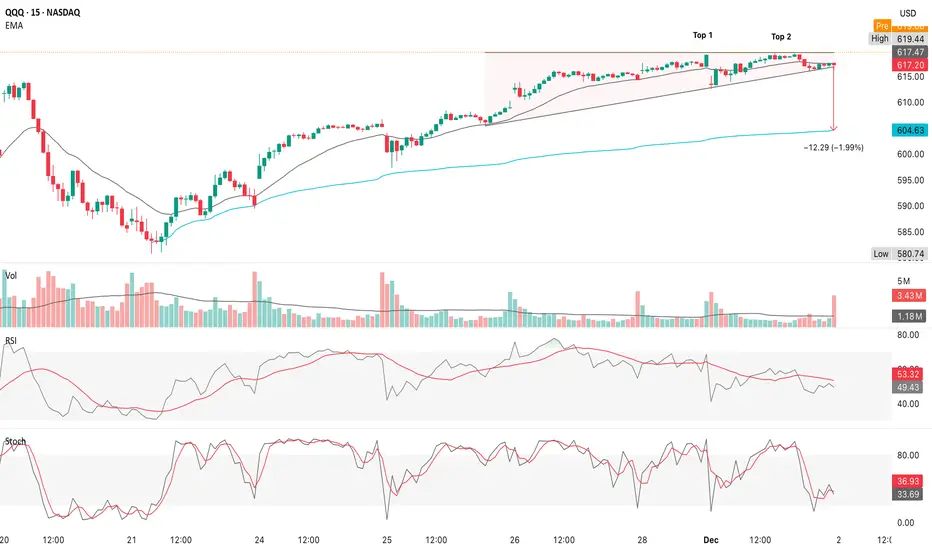
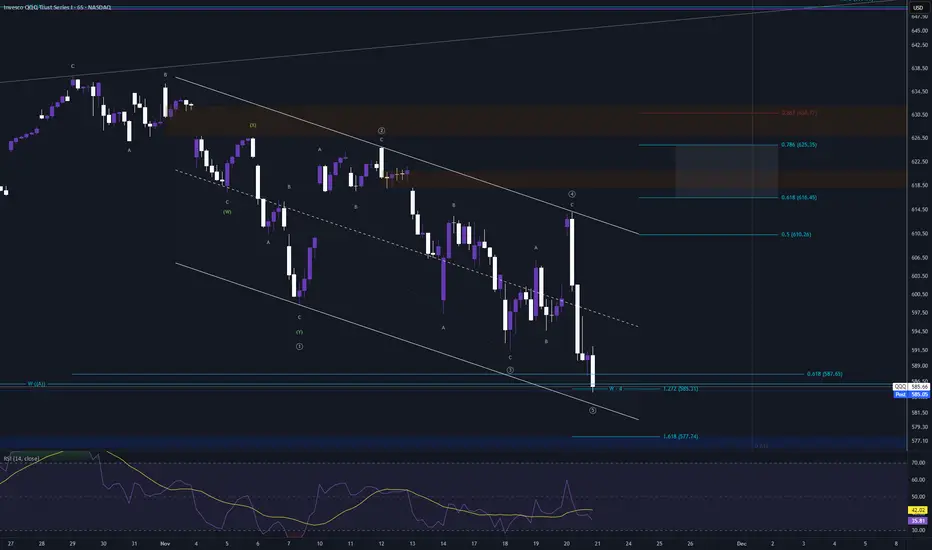
QQQ Short-Term RoadmapThe 15m chart shows 3 things with absolute clarity
1. Rising wedge
• A clean candle through wedge support
• A retest attempt that failed
• Follow-through selling
• High-volume breakdown bar
2. Double top at $619-$620
• Top 1 rejection
• Top 2 rejection
• Neckline broken
• Pattern validated
• The double top + wedge combo gives strong short-term downside momentum
3. Momentum confirms the breakdown
• RSI sloping down, under its average
• Stoch rolling over from mid zone
• No bullish divergences
• No failed breakdown behavior
• This is genuine intraday weakness
Short-term downtrend on the 15m is active & should continue toward support, ~$604
• This target is not arbitrary - it has extremely strong confluence
• Rising wedge measured move
• Double-top measured move
• AVWAP (21 November) ≈ $603-$605
• Daily pivot support zone
• 50d MA ~$604
• Largest VPVR volume node (HVN) $602-$610
• Fair-value of the entire multi-week range
Every timeframe and every tool points to $604-$610 as the magnet
• The market is heading directly toward it
• This 15m breakdown is simply the path into it
Volume confirms this is real selling
• The breakdown candle has higher volume
• Volume increased from baseline
• Not holiday drift, not thin liquidity
• True supply entered at the top
• This validates the move
Short-term is bearish until ~$604-$610 is hit
• This is a normal pullback into support
The larger trend remains bullish because price is above all major MAs (20d/50d/100d/200d)
• Macro shifted bullish (rate-cut odds jumped)
• Daily trend structure is intact
• 4H MACD still bullish
• Daily RSI still rising
This 15m breakdown is corrective within an uptrend
• Follow-through toward ~$610
• Liquidity sweep of the wedge target ~$604-$606
• Bounce attempt from $604-$610
• The market will try to reclaim $612-$615
• If it succeeds, trend resumes toward $620+
• If it fails → next test is $600-$603
Bullish continuation remains intact above $610, while warning signals appear below $610 & a break of $605
• Both still compatible with larger bullish structure
Bearish shift (deeper correction risk)
• Break below $600
• Bearish confirmation with a break below $590
• This would signal a structural break on the daily timeframe; however, right now we are nowhere near those lower levels
The 15m chart shows a real, clean breakdown, valid bearish patterns, selling into the highs & momentum rolling over
• A short-term move toward ~$604-$610, but this is a normal pullback in a strong daily uptrend & larger trend remains bullish
• $604-$610 is key
• Expect a bounce attempt there
• No evidence yet of a trend reversal
• No evidence of a larger correction unless $600, then $590 break
• This is exactly how strong markets correct
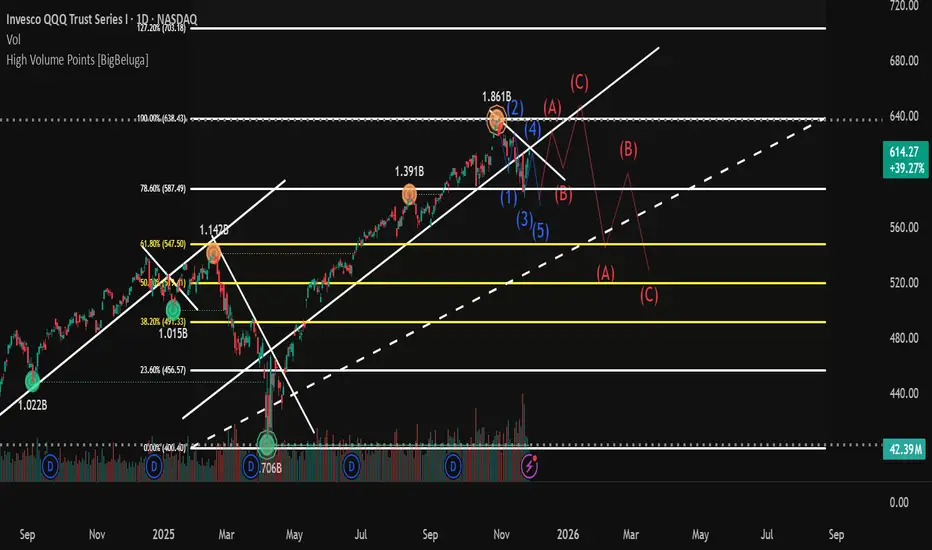
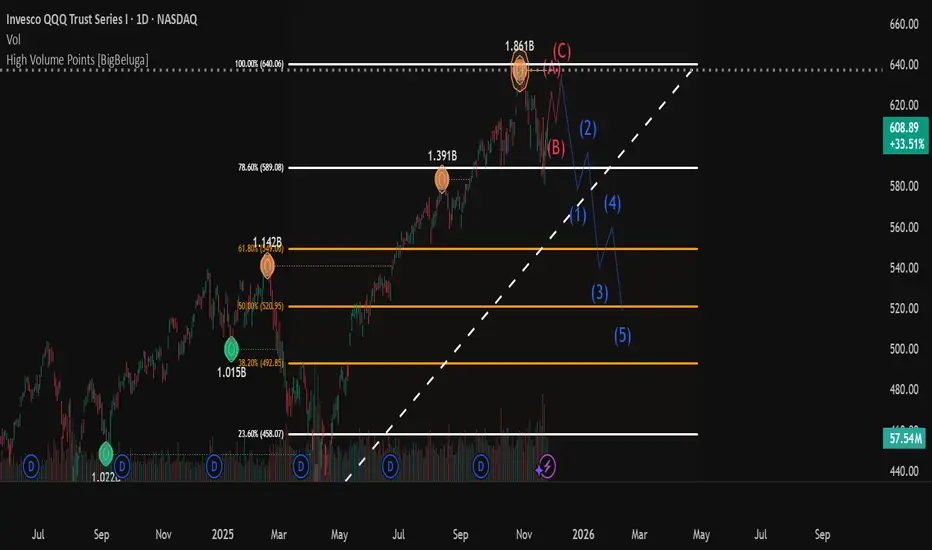
QQQ Bearish Path (Preferred unless $614 breaks)There are 2 competing (4) scenarios
1. (4) Already Bottomed at ~$586
The market tagged the 78.6% retrace (~$586.8)
Price immediately launched into a strong impulsive rebound
Volume confirmed it was real demand, not just a short-cover spike
20d MA is now being tested (~$614)
If reclaimed, this is a strong confirmation of Wave (5) beginning
This would project Wave (5) toward the 123.6–138.2% extensions or a price of (~$692-$726)
2. (4) Extends Lower Toward ~$560
Retest of trendline from 2024 lows
Major structural support ($555-$565)
This scenario remains valid unless QQQ closes above $614 (20d MA) & then holds above $596 on a retest
If that happens, the deeper Wave (4) becomes much less likely
(4) may already be completed because the bounce off $586 was fast, impulsive & clean
QQQ reclaimed short-term moving averages with a steep angle
RSI & Stoch made strong bullish divergences at the low
This behavior is more typical of the end of a Wave (4) correction than of a mid-cycle pullback
If QQQ rejects $614, fails to break $620, price drops & breaks $589 & especially breaks $586, then the deeper (4) target at $558-$565 becomes the primary path
That level coincides with 50% retracement of the entire Wave 3, anchored VWAP from the April low & major volume shelf
Both are valid, but market structure currently favors the upper (4) unless broken


$QQQ: IS THE PULLBACK OVER ?Has the pullback from the all-time high concluded?
Analysis of the chart indicates that the decline from the all-time high appears corrective. This suggests it is unlikely to undermine the prevailing upward trend that began at the lows observed in April, despite registering a 9% decrease.
It is noteworthy that the 0.382 retracement level lies at 548, and the 200-day simple moving average (SMA) is positioned at 544. Consequently, the correction remains well within the boundaries of the existing uptrend, as it has yet to approach the typical 0.382 retracement threshold.
There is also potential evidence of a bullish flag pattern emerging.
The presence of a bearish marubozu candle followed by a doji during the downtrend could imply a potential reversal, with today's bullish gap-up-and-go serving as a possible confirmation signal.
Furthermore, the 14-period RSI has surpassed its resistance trendline; however, this should be validated by a sustained move above the 50 level.
While there are encouraging technical signals, a definitive bottom has not yet been confirmed yet.
Key indicators to monitor include:
• The establishment of higher highs and higher lows, maintaining support at 588.
• A break above the upper trendline of the flag pattern, including moves above the 50-day moving average and significant resistance at 613.
Although QQQ continues in a favorable direction, it is premature to confirm a conclusive trend reversal at present.
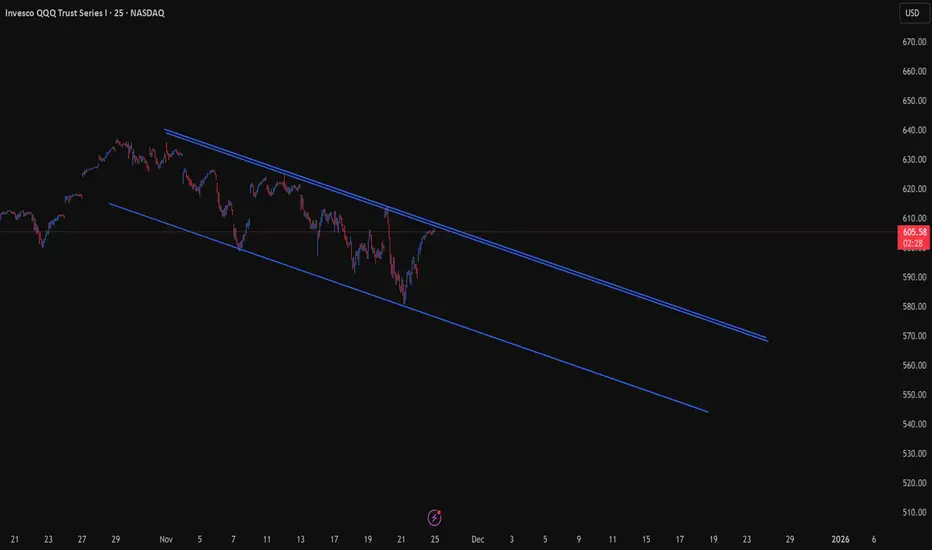
The Geometry of the Week: QQQ Inside the Declining ChannelThis week’s market map centers on a single dominant structure —
a perfect declining parallel channel guiding QQQ through the entire November decline.
Price is now rallying back into the upper rail, the same geometric boundary that rejected every advance this month.
This rail rises at a 1×2 natural angle, meaning:
1 trading day = $2 of vertical movement
A classic slope in fast corrective markets.
1. What Must Happen for the Market to Rise
For QQQ to reclaim strength and retest the November highs, one condition must be met:
QQQ needs a daily close above the upper rail of the declining channel.
Nothing less.
This angle is the gatekeeper.
Without a close above, upside follow-through is limited.
And if price rejects off the trendline?
→ The geometry remains intact
→ The downtrend holds
→ Lower prices become the natural next step
In geometric markets, rejection at the angle is the signal.
2. Compass Reading for the Week
Primary Trend: Down
Secondary Move: Counter-trend rally
Market Location: Testing upper rail resistance
Key Zone: 606-608
Bias: Watch for daily close above or rejection at the angle.
Market Knots Reading — Bull vs. Bear Bias
🔵 Bullish Bias
What the bulls can build a case from:
1. Acceleration is Positive
Acceleration has flipped above zero and is holding there.
This is the earliest sign of internal energy returning.
→ Trend force is rising
→ Short-term conditions favor continuation upward.
2. Speed Is Rising From the Lows
Speed has made a clear higher low and is now climbing toward the mid-range.
→ The market is gaining internal velocity
→ Bulls are defending the short-term structure
3. Price Is Rising Cleanly Within the Channel
On the 50-min view, price is stair-stepping upward and respecting short-term support.
→ Short-term bias: Up
Bull Case Summary:
Acceleration > 0 + rising Speed =
Bulls have the initiative going into the next rail test.
🔴 Bearish Bias
What the bears can counter with:
1. Speed Still Below the October Highs
Even at 125, Speed is far below the momentum peaks seen earlier.
→ The current rally remains weaker than the prior thrusts
→ Internal strength is not matching price strength
2. Rising Into a Major Structure
Price is pushing directly into the upper parallel rail.
→ This is where rallies have consistently failed
→ Bears control the geometry, even if bulls control the short-term motion
3. Acceleration Is Positive But Weak
Acceleration is above zero but not expanding aggressively.
→ This is not “trend breakout” force
→ It’s counter-trend lift inside a broader downtrend
Bear Case Summary:
Speed < November peaks + Weak Acceleration =
Rally may exhaust at the upper rail and fail.
Who won Earnings Season?The top 10 holdings in Invesco's Nasdaq 100 ETF (QQQ) as measured in relative strength since October 1 (Note that Alphabet counts for two of them GOOG and GOOGL). Which companies are investors propping up going into the end of the year?
Mostly Alphabet Inc. a.k.a. Google, but surprisingly also Amazon, Broadcom and Apple. If the market goes bullish and hits a new high by the end of the year, these are the ones who will lead the way.

QQQ ATH in for awhileIn a related posted, looked at ATH on Oct 29th. That has held so far. Now looking at the next phase. It looks like we have a 3-3-3-3-3 leading diagonal.
I'm looking for a pop anywhere from 610 to 625, maybe get the first bear gap, maybe both? It depends on how the first pullback My assumption is 616 at least, gives bulls a breakout, potential retest, then drop from there. Possibly test the bear gap at 626.
Marking this as a short for beginning of Dec after.
How the next couple weeks go!
Daily QQQ (US100-NQ) Outlook - Prediction (21 NOV)Daily QQQ (US100-NQ) Outlook - Prediction (21 NOV)
📊 Market Sentiment
Market sentiment is bearish right now, in my opinion. The FED is expected not to cut rates in December, and the uncertainty around when rate cuts may resume in 2026 is adding pressure. After yesterday’s intraday crash, overall market anxiety has increased significantly.
📈 Technical Analysis
Price tapped the monthly FVG level around 588.5, which holds significant liquidity. In my view, this zone may set up the foundation for a potential Friday bounce.
📌 Game Plan – Prediction
I expect two possible scenarios:
Scenario 1 (Black Line):
Price may consolidate and range between 597–588, creating choppy intraday price action.
Scenario 2 (Red Line):
Price may retrace toward 578.5, then recover and move back above the 588 level.
💬 For detailed insights and broader market context, please check my Substack link in profile.
⚠️ For educational purposes only. This is not financial advice.

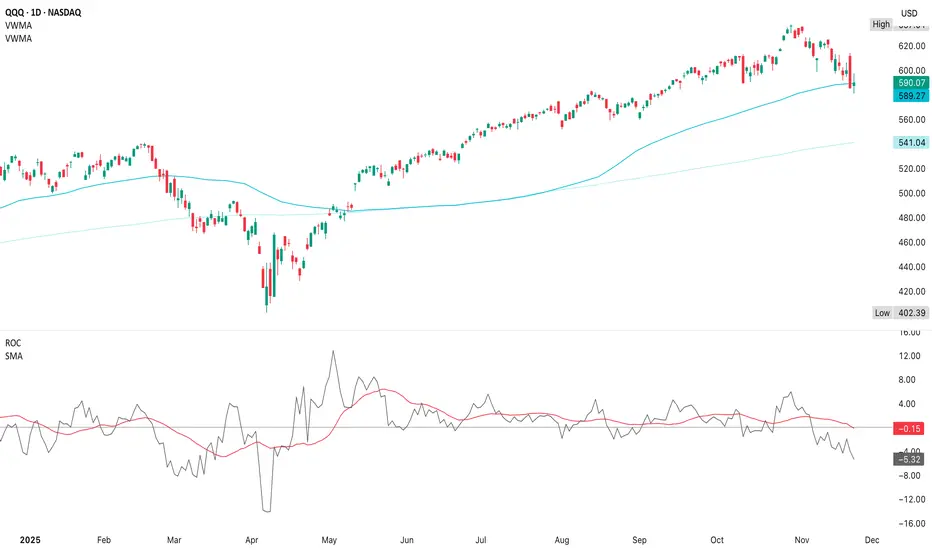
QQQ (21 November)VWMA is like an EMA, but weighted by volume, so it tells you what price the heavy money is actually paying & it exposes trend shifts earlier than simple moving averages
The 20d VWMA is curling down which shows that the short-term trend has firmly turned bearish
This downturn began well before the breakdown
The 50d VWMA is flattening, slightly bending down so the medium-term trend is now losing momentum
When 20d crosses below 50d VWMA (if it happens), that’s a trend-change confirmation
This aligns with the multi-timeframe weakness in stochastics rolling over on daily & 4H & RSI making lower highs
ROC is trending below its signal line which signals that this isn’t just a dip, but that momentum is deteriorating across multiple layers
ROC is extremely useful for measuring acceleration; rather than, direction
ROC has been trending under the signal line for about 2 weeks & is now below zero, indicating negative momentum
No bullish divergence appears yet (price lows not rising vs ROC lows rising)
The ROC signal line is sloping down which signals sustained weakness
There are only 2 reasons for VROC to spike this hard (unusual ahead of Thanksgiving) & spikes above 100% only occur near major turning points, both tops & bottoms
Capitulation into a low
Institutional rotation before another leg lower
This is the opposite of a bottoming structure
Current ROC behavior matches early-cycle pullback phases from February 2020, September 2021, April 2022 & March 2024
Each of these periods saw a continued drift lower, lower highs on oscillators & price returning to mid-range support levels
Looking at earlier timeframes, initial support is $586-$589
$573-$576 is highly probable if the oversold bounce fails
$558-$563 is weekly support & $540-$545 is less likely, but possible in a deeper correction (50wk MA)
Given VWMA downtrend & ROC weakness, the path of least resistance is still down to the $573-$576 or $560 area unless a catalyst interrupts the selling
Historically, when ROC breaks below zero & VWMA is rolling over, the pullback usually extends 2-4 weeks
Price tends to form a lower low or retest the first low before recovering
Bounce attempts during this period are weak (exactly what we saw this week)
Thanksgiving week usually has lighter volume that contribute to false moves & NFP data the following week is a a major event into the December FOMC, so expect a weak bounce ($598-$605) in the next 3-5 trading days with a pullback lower into early/mid December
The true reversal likely only after a vol spike & ROC divergence
This is not yet bottoming behavior, momentum is declining, the short-term bounce attempts are corrective, not impulsive, so the next logical destination remains $573-$576 & then $560
Price may push higher to $605-$612 which means we see a sharper sell-off in December
Until ROC flattens, ROC offers a bullish divergence, price reclaims 20d VWMA & stoch/RSI turn up on the daily, QQQ is still in the middle of a corrective leg down; instead of a real, tradable reversal
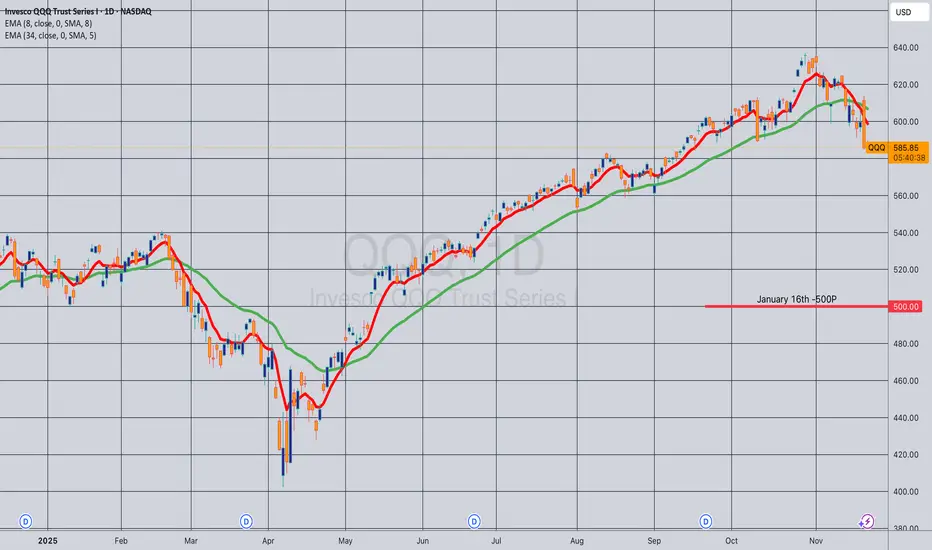
Opening (IRA): QQQ January 16th -500P... for a 5.22 credit.
Comments: My SPY position is becoming somewhat of a spaghetti works, so opting to open a run in the Q's instead, targeting the strike paying around 1% of the strike price in credit.
Will look to add/ladder out at intervals, assuming I can get in at strikes better than what I currently have on.
Weekly QQQ (NQ-US100) Outlook - Prediction (23 NOV)Weekly QQQ (NQ-US100) Outlook - Prediction
📊 Market Sentiment
Market sentiment is driven by fear at the moment. In my opinion, we are trading inside a bearish zone. Unless we get meaningful data or positive news, I expect the market to continue declining. Core PPI will be released on Tuesday at 08:30, which could create a minor bullish reaction; however, I personally do not think this will shift the overall sentiment. PPI is not a strong catalyst for a major sentiment change, so bearish conditions are likely to remain in play.
📈 Technical Analysis
Price ran the 613 level strongly and reversed aggressively on Thursday after NVDA earnings. This move trapped the bulls and filled institutional put positions. As I mentioned on Thursday evening, a weak bounce was possible and that is exactly what occurred.
📌 Outlook – Prediction
Scenario 1 (Bearish Scenario):
I believe this scenario is more likely to play out. I expect price to retrace toward 559. If we see strong bullish momentum on Monday, I will likely become more cautious with my puts.
Scenario 2 (Bullish Scenario):
If price shows strong momentum on Monday and reprices toward 614, then I will consider buying calls around 606, targeting all-time highs afterward.
Follow me for daily SPY–QQQ updates. I will update the idea based on evolving price action.
💬 For detailed insights and broader market context, please check my Substack link in profile.
⚠️ For educational purposes only. This is not financial advice.

QQQ Gobble, Yelp, Cluck, Purr, Cackle, Cutt, Keekee!Thanksgiving week has a strong statistical pattern & historically, Monday-Tuesday shows normal volatility (often a continuation of the prior trend), Wednesday is a half-day with very little volume (small bounces) & Friday (also a half-day) is choppy with fake moves, low conviction & slow
Thanksgiving week is bullish during uptrends & during downtrends these shallow bounces fizzle out
The bounce ahead of the holiday fizzles out due to low volume & lack of buyers
Week after Thanksgiving usually gives a big directional move & usually down, or a continuation of the current downtrend
The moves next week tend to lack power & any bounce is not a true reversal, but the week after Thanksgiving (2-6 December) is when the real move happens & could be the window for the drop towards $568 to $560
Funds don’t reposition aggressively on holiday weeks
Low liquidity prevents trend continuation
Big red moves require volume, which returns first week of December
Early December is historically one of the most volatile periods each year
So this add confidence to the timeline of the expected move lower
QQQ will likely bounce next week to $598-$605 then the drop into $560 between 2-6 December supported by the fact that QQQ is still well below its 20d/50d MAs & losing trend support
If you want to trade, keep to small bullish scalps only & avoid heavy puts short-term since low volume kills momentum
Key upside is likely capped to $599-$605
After Thanksgiving is the best window to enter puts because the directional moves become strong with clear downside targets of $575 to $570 to $562 to $560
Thanksgiving delays the big leg down, but does not cancel it; in fact, the small expected bounce sets up the sharp drop the following week

QQQ Liquidation FlushToday was a liquidation flush & the opening price action wasn’t a bounce attempt, since it largely occurred after-hours rather than during regular trading hours
• The failed push was simply a backtest of broken intraday moving averages & not the bounce to the 20d MA that's expected, but today's drop sets the stage now
• The bounce was initially expected from the level that price hit today (~$583)
• The market needed this flush to generate real bounce conditions, so the bounce expectation remains because the real signal just fired
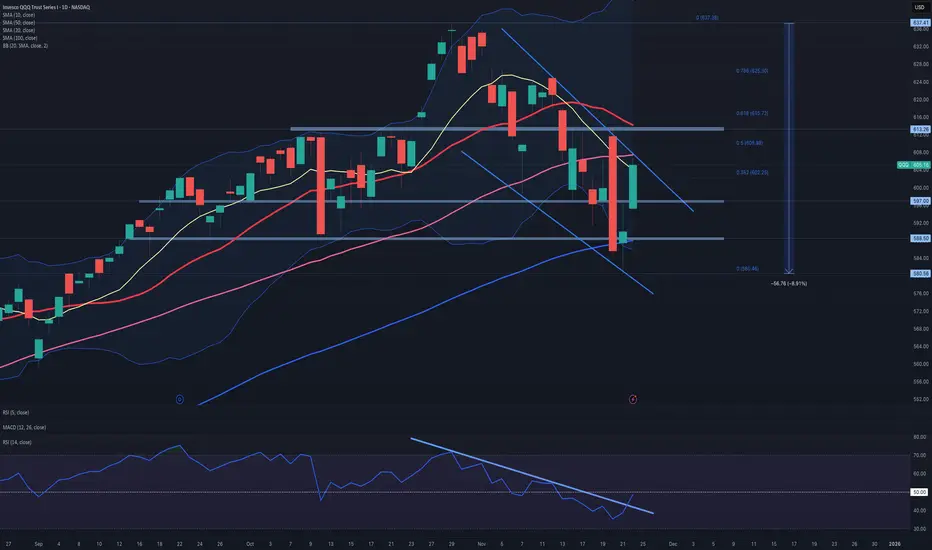
The daily Bollinger band breakdown has a very high mean reversion probability
• When QQQ closes a full red candle outside the lower Bollinger band, a reflex bounce occurs within 1-2 sessions almost ~85% of the time & today was the breakdown day
• The bounce almost never happens on the breakdown candle, but comes immediately after, so we're on schedule
Intraday indicators didn’t actually show bounce conditions until the last hour
• 15m Stoch is curled up after the close
• 1H RSI at ~32
• 1H candle bodies are extended from 1H 20 MA by 3%
• 4H Stoch is basically 0
These are the conditions that produce the bounce
• We now have oversold momentum, a completed flush, a proper lower band break, a perfect touch of the 100d MA, capitulation volume & structure completion (wave a likely ended today)
Today wasn’t the bounce, but the setup, so the expected bounce remains to $603-$612 with a high probability of hitting it before the next major leg lower
• Now to 27 November 27 into 3 December (NEVER SHORT A DULL TAPE - Thanksgiving week)
• 3 December to 20 December (tax-loss selling & liquidity pockets produce the broader correction)
• Final low into mid-late December, then a strong Q1'26 rebound
Monthly is overbought & starting macro reversal
⬇
Weekly's momentum turning into a multi-week correction
⬇
Daily lost 20d MA & Bollinger breakdown signals trend shift
⬇
4H/1H VWAP resistance & declining MAs suggests bounces will fail
⬇
Intraday completed wave a flush into first support so everything is aligned & nothing contradicts anything else
Short-term (next 5-10 days)
• 70% probability
• Bounce to $603-$612
• Rejection
• Move down into $555-$570
• Within 1-3 days
• Late November into early December
Today wasn’t the bounce, but the flush into the bounce
• After-hours price action (around $583-$585) hit the exact lower Bollinger band, so that is where bounces begin, not where they end
• If QQQ opens anywhere above $585 tomorrow, your upside window is bounce target = $603 to $612 (these are the 1H/4H resistance & the 20d MA retest) creates a clean 3-5% snap which is perfect for short-term calls
• Invalidated if QQQ closes below $580-$583
• Calls are a good idea for a bounce, not a swing with an expiry 6 December & strikes $600, $605 & $610 for an expected peak before rejection anywhere from $603-$612, but don't overstay
After the bounce, the most straightforward option place is directions with puts
• $580 strike with an expiry 20 December (monthly) because $580 is right inside the target area of $555-$570 so gives room for theta decay since the expected decline is expected to last 2-3 weeks
• Avoids weekly expiries that get crushed by time decay
• You get IV expansion as price drops
A higher risk/reward strategy is a put spread if you want defined risk & better capital efficiency, so buy a $590 put & sell a $560 put with a 20 December expiry
• $590 is the current breakdown level
• $560 is the projected low of wave c
• Profit if QQQ lands anywhere ≤$560 into December OPEX
• Captures maximum value if $555-$570 target hits
An ultra safe hedge with less stress is $600 puts with a 16 January expiry (monthly)
• This one is for lower IV entry, more time for the correction to fully complete & survives a bigger bounce (even if it pushes to $612-$616)
$580P 20 December expiry is the best match for the projected correction's timing & target
(IF QQQ CLOSES BELOW $580, THIS INVALIDATES THE EXPECTED BOUNCE & THE CORRECTION BEGINS IMMEDIATELY)

QQQ Mean-ReversionEvery time QQQ reached the lower Bollinger band, a mean-reversion bounce followed this year
When price tags the lower band & doesn’t expand downward, it means the selling is losing momentum
The 20d MA is near $605 & the nearest magnet after a lower band tag
Price almost always returns to the middle band unless there is a trend breakdown (not yet the case)
There is a volatility expansion event (NVDA earnings maybe)
As of now, the bands aren't expanding, but stable, which means the chart favors mean-reversion rather than breakdown
The upper Bollinger band is near $620-$625 & aligns with the 10 October AVWAP & the 4H resistance around $617 & is the maximum price target if the bounce extends above the 20d MA
A bounce to $605-$610 isn’t just possible - it’s expected
Price almost always returns to the mean; unless, the trend breaks
Price still above the September/October high-low structure
The probability favors a bounce to $605-$610
Only one thing invalidates the mean-reversion bounce - A full body daily close below the lower Bollinger band which signals volatility expansion, trend transition & momentum breakdown
