TESLA: Bullish Continuation Pattern: Eyes on 482 → 550 → 600TESLA: Bullish Continuation Pattern: Eyes on 482 → 550 → 600
TSLA is forming another bullish continuation pattern after a series of higher-low triangle formations. The structure suggests strong trend continuation potential if buyers reclaim momentum.
A confirmed breakout above the current resist
Next report date
—
Report period
—
EPS estimate
—
Revenue estimate
—
53.25 THB
245.19 B THB
3.36 T THB
2.39 B
About Tesla, Inc.
Sector
Industry
CEO
Elon Reeve Musk
Website
Headquarters
Austin
Founded
2003
ISIN
TH0809121906
FIGI
BBG01TZGV685
Tesla, Inc. engages in the design, development, manufacture, and sale of electric vehicles and energy generation and storage systems. It operates through the Automotive and Energy Generation and Storage segments. The Automotive segment includes the design, development, manufacture, sale, and lease of electric vehicles as well as sales of automotive regulatory credits. The Energy Generation and Storage segment is involved in the design, manufacture, installation, sale, and lease of solar energy generation, energy storage products, and related services and sales of solar energy systems incentives. The company was founded by Jeffrey B. Straubel, Elon Reeve Musk, Martin Eberhard, and Marc Tarpenning on July 1, 2003 and is headquartered in Austin, TX.
Related stocks

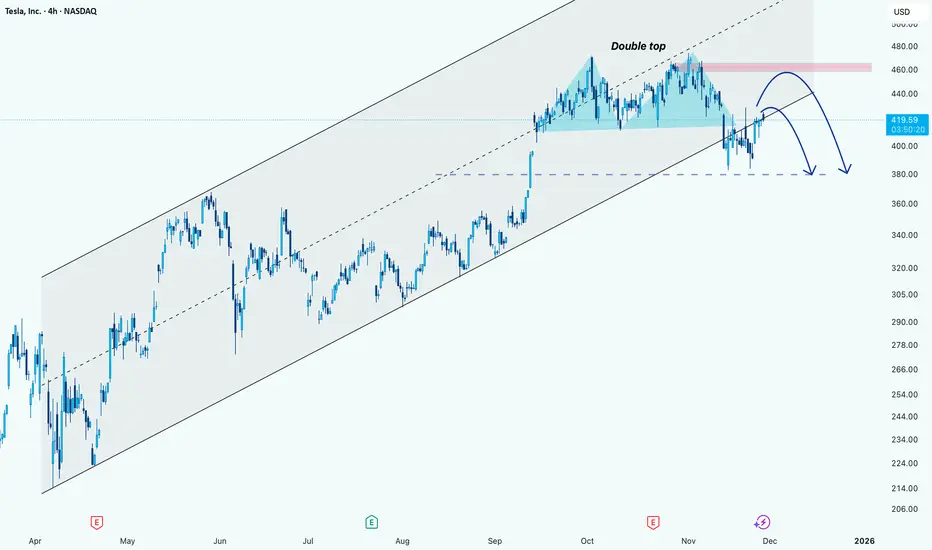
Tesla: A overview of itHi!
Trend Analysis:
TSLA has been trading in an ascending channel for several months, with higher highs and higher lows visible since April.
The recent price action broke above the midline of the channel but is currently consolidating near the $420-$425 area.
Pattern Formation:
A Double Top p
Tesla: Do Converging EMAs Signal a Decisive Moment?Hello everyone, looking at Tesla’s current rebound, my first impression is that the market is entering a rather sensitive “trend-defining zone.” After a strong decline since mid-November, TSLA has finally bounced and climbed above the EMA 34, moving straight into a test of the EMA 89 — where the tw
Tesla Reversal Signal Triggered at the 200 SMA!TSLA 🚗 Bullish Pullback Playbook — Smart Layered Entry Setup!
📈 Asset:
TSLA — Tesla Inc. (NASDAQ)
Swing Trade Playbook | Trend-Continuation Setup
🧠 Market Thesis
TSLA shows a bullish pullback into the 200-Day Simple Moving Average, a level historically respected by trend-followers. The latest Heik

TESLA - Long - 528 / 611Tesla is still displaying the potential to fly higher.
As per our technical analysis we can find the stock has the potential to hit the levels of 528 and even to the levels of 611.
611 is a reversal level and hence we can expect some minor correction from that point.
Incase the stock fall from the

Tsla bullish breakout 2.7:1 risk reward ration Tesla is breaking out to bullish trend. Heading long here at 330, target 430$
$TSLA: $350 Target - $380 Short (Support Breaking)The support for Tesla seems to be breaking, and the oscillators are due for a negative downtrend along with the RSI close being too high. The analysts at the same time are neutral and this has been given a buy over a strong buy target with catalysts like lower earnings in some countries and a lack o

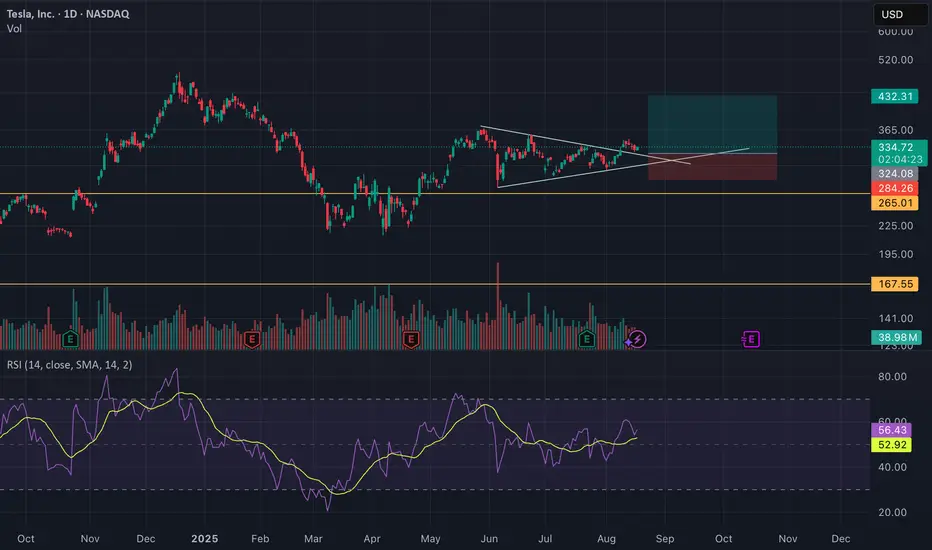
Tesla - The triangle is still valid!🎀Tesla ( NASDAQ:TSLA ) can still confirm the breakout:
🔎Analysis summary:
Just two months ago, Tesla perfectly broke out of the major ascending triangle pattern. In the meantime we just witnessed a major consolidation at the all time high. Quite likely that Tesla will soon confirm the breakou

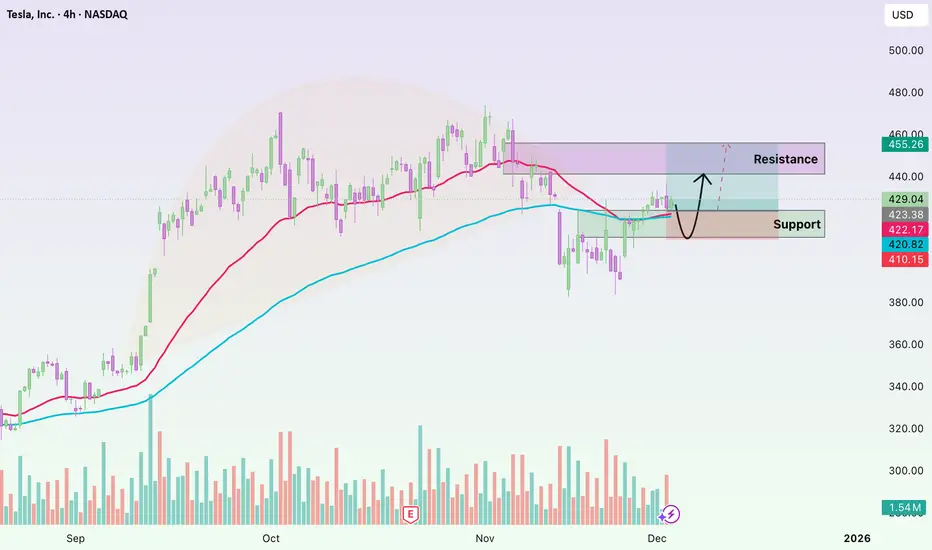
Tesla May Have Charged its BatteriesTesla has chopped sideways for months, but some traders may think the EV maker is ready to start moving again.
The first pattern on today’s chart is the $420 level. TSLA held that price several times between mid-September and mid-November. It briefly became resistance when the stock dipped but now

TSLA daily bullish divergenceNASDAQ:TSLA is consolidating below all-time high resistance, suggesting a breakout is coming.
Wave (2) appears complete at the High Volume Node support and 0.5 Fibonacci retracement with a bullish structre flip.
📈 Daily RSI hit oversold with bullish divergence
👉 Continued downside has a target o

See all ideas
Summarizing what the indicators are suggesting.
Oscillators
Neutral
SellBuy
Strong sellStrong buy
Strong sellSellNeutralBuyStrong buy
Oscillators
Neutral
SellBuy
Strong sellStrong buy
Strong sellSellNeutralBuyStrong buy
Summary
Neutral
SellBuy
Strong sellStrong buy
Strong sellSellNeutralBuyStrong buy
Summary
Neutral
SellBuy
Strong sellStrong buy
Strong sellSellNeutralBuyStrong buy
Summary
Neutral
SellBuy
Strong sellStrong buy
Strong sellSellNeutralBuyStrong buy
Moving Averages
Neutral
SellBuy
Strong sellStrong buy
Strong sellSellNeutralBuyStrong buy
Moving Averages
Neutral
SellBuy
Strong sellStrong buy
Strong sellSellNeutralBuyStrong buy
TSLA4317805
Tesla Energy Operations, Inc. 5.45% 17-DEC-2030Yield to maturity
10.02%
Maturity date
Dec 17, 2030
TSLA4296328
Tesla Energy Operations, Inc. 5.45% 16-OCT-2030Yield to maturity
9.28%
Maturity date
Oct 16, 2030
TSLA4290558
Tesla Energy Operations, Inc. 5.45% 01-OCT-2030Yield to maturity
8.99%
Maturity date
Oct 1, 2030
TSLA4247202
Tesla Energy Operations, Inc. 5.45% 21-MAY-2030Yield to maturity
8.69%
Maturity date
May 21, 2030
TSLA4324758
Tesla Energy Operations, Inc. 4.7% 14-JAN-2026Yield to maturity
8.00%
Maturity date
Jan 14, 2026
TSLA4286421
Tesla Energy Operations, Inc. 5.45% 17-SEP-2030Yield to maturity
7.89%
Maturity date
Sep 17, 2030
TSLA4231716
Tesla Energy Operations, Inc. 5.45% 23-APR-2030Yield to maturity
7.60%
Maturity date
Apr 23, 2030
TSLA4250220
Tesla Energy Operations, Inc. 5.45% 29-MAY-2030Yield to maturity
7.40%
Maturity date
May 29, 2030
TSLA4313161
Tesla Energy Operations, Inc. 5.45% 03-DEC-2030Yield to maturity
7.15%
Maturity date
Dec 3, 2030
TSLA4260133
Tesla Energy Operations, Inc. 5.45% 25-JUN-2030Yield to maturity
7.02%
Maturity date
Jun 25, 2030
TSLA4224815
Tesla Energy Operations, Inc. 5.45% 26-MAR-2030Yield to maturity
6.78%
Maturity date
Mar 26, 2030
See all TSLA01 bonds
Curated watchlists where TSLA01 is featured.


