SILVER (XAGUSD): Bullish Continuation AheadFollowing a retest of a previously breached structure, SILVER has demonstrated a resumption of its bullish trend.
The bullish breakout observed above the resistance line of a bullish flag pattern offers robust confirmation of a continued bullish trend.
It is anticipated that the price will rise towards the 39.18 level.
SILVERMINICFD trade ideas

XAGUSD, Elliott wave analysisOutlook for XGUUSD on the 3-day chart.
There have been no changes since the last update.
We are currently in sub-wave (3) of wave (ⅲ).
Sub-wave (3), indicated by the green line, will likely be an extension.
If this scenario assumption is correct, the upward trend will continue.

Silver reached an important supply range!According to the previous analysis, the trend of silver was exactly bullish, and currently silver has reached an important supply range, in which we have the possibility of a 3D formation, after which we can have our own expectations and predictions of the rise or fall of this metal, in case of penetration or non-penetration.

Silver (XAGUSD) – Cup & Handle on the Monthly ChartSilver (XAGUSD) – Cup & Handle on the Monthly Chart
🔹 Technical Overview
The long-term chart of Silver shows the development of a massive Cup & Handle pattern.
The “cup” formed from the 1980 peak down to the 1990s lows, followed by a long recovery to retest the 2011 highs.
Price is now trading in the potential handle phase, consolidating in the 38–39 USD zone.
🔹 Key Levels
Major Support (long-term): 3.47 – 4.00 USD.
Strategic Support: 26–30 USD zone.
Major Resistance: 48.00 USD – neckline of the pattern.
Targets if breakout confirms:
First target: 161 USD.
Extended target: 616–664 USD (ultra long-term).
🔹 Interpretation
As long as price remains below 48.00, the breakout is not confirmed.
A monthly close above 48.00 would validate the Cup & Handle formation and open the door to much higher levels.
If price loses the 26–30 USD zone, the bullish scenario is weakened and may be delayed.
🔹 Conclusion
Silver is at a critical long-term inflection point.
A confirmed breakout above 48 USD could trigger one of the largest bullish waves in its history, while failure to break out keeps price locked in a wide consolidation.
📝 Quick Key Points
📊 Long-term Cup & Handle formation.
📍 Major support: 3.47–4.00 USD.
📍 Critical resistance: 48.00 USD.
🎯 Breakout targets: 161 → 616+ USD.
⚠️ Loss of 26–30 USD weakens the bullish case.


Silver : Buy Triggered
Silver : Buy Triggered
( Not a Buy / Sell Recommendation
Do your own due diligence ,Market is subject to risks, This is my own view and for learning only .)

XAG to the Moon?Is this the golden Ticket the Price of gold is expensive... Imagine working at a mine for this material vs the guy who owns the money / the mine.

SILVER: Will Go Up! Long!
My dear friends,
Today we will analyse SILVER together☺️
The in-trend continuation seems likely as the current long-term trend appears to be strong, and price is holding above a key level of 40.740 So a bullish continuation seems plausible, targeting the next high. We should enter on confirmation, and place a stop-loss beyond the recent swing level.
❤️Sending you lots of Love and Hugs❤️

SILVER RELATIVE TO GOLD/SILVER RATIO - 3 possible deep correction.
target price : 20.50$/oz.
trade invalidation level : daily close above 33.00$/oz.
good luck.

SILVER Will Keep Growing! Buy!
Hello,Traders!
SILVER is trading in an
Uptrend and the price
Made a bullish breakout
Of the key horizontal
Level of 39.53$ and the
Breakout is confirmed so
We are bullish biased
And we will be expecting
A further bullish continuation
Buy!
Comment and subscribe to help us grow!
Check out other forecasts below too!
Disclosure: I am part of Trade Nation's Influencer program and receive a monthly fee for using their TradingView charts in my analysis.

XAUUSD(SILVER)We have broke out and held the price, i see a pullback to the low 39.30 - 39.50 area and continune the bullish movement to 43 and 48 the next levels of resistance.
All fundamentals are calculated in

VIOLENT BOS on SILVER takes place! HOW FAR it goes this time?!?This is where momentum strategys eventually lead to...

Uptrend in silverThe trend we expect in silver is a ping-pong and upward movement until it reaches the main supply range, but in the long term it is an upward trend.

SILVER BULLISH BREAKOUT|LONG|
✅SILVER is going up currently
And the price broke the key structure level of 39.52$
Which is now a support, and after the pullback
And the retest, I think the price will go up
LONG🚀
✅Like and subscribe to never miss a new idea!✅

SILVER (XAGUSD): Classic Trend-Following Setup
I see a very classic bullish model on Silver:
after a strong bullish wave, the market started to correct
within a bullish flag pattern.
Its resistance breakout always provides a reliable confirmation to buy.
I expect a rise to 39,16 now.
❤️Please, support my work with like, thank you!❤️
I am part of Trade Nation's Influencer program and receive a monthly fee for using their TradingView charts in my analysis.

Gold, Silver soar on rate cut hopes & Trump tariff rullingGold and silver are making headlines as both metals surge amid a mix of macroeconomic and technical factors. Gold is trading just below its all-time record, having recently touched $3,495 per ounce, while silver has soared to a 14-year high of above $40.50.
The main catalyst behind this rally is growing confidence that the Federal Reserve will cut interest rates soon, following dovish signals from Fed officials and signs of a softening US job market. With markets now pricing in a 90% chance of a rate cut, the US dollar has weakened, making non-yielding assets, such as gold and silver, more attractive. The recent US court ruling that deemed most of President Trump’s tariffs illegal has added further pressure on the dollar, while thin trading conditions due to a US bank holiday have amplified price moves.
Bullish signals for gold and silver are strong. Both metals are also benefiting from tight supply conditions and ongoing geopolitical uncertainty, which are driving investors toward safe-haven assets.
Gold is consolidating just below record highs, and technical analysis points to a potential breakout from a bullish symmetrical triangle pattern. If confirmed, this could propel gold toward new highs, with targets in the $3,550–$3,820 range.
Silver’s rally is supported by a classic pennant formation, with technical projections suggesting a move toward $42 is possible in the short term.
However, there are bearish risks to consider. If upcoming US employment data surprises to the upside or inflation remains stubbornly high, the Fed could delay or scale back rate cuts, which would strengthen the dollar and potentially cap further gains in gold and silver.
Additionally, both metals are trading near major resistance levels, and a failure to break out convincingly could trigger profit-taking or a technical pullback. For gold, support sits around $3,440, with the 50-day moving average at $3,350 providing a key floor. For silver, a drop below $39.55 could signal a short-term reversal.
While the setup favours further upside, especially if the Fed delivers on market expectations, traders should stay alert to key data releases and resistance levels that could shift the narrative in either direction.
This content is not directed to residents of the EU or UK. Any opinions, news, research, analyses, prices or other information contained on this website is provided as general market commentary and does not constitute investment advice. ThinkMarkets will not accept liability for any loss or damage including, without limitation, to any loss of profit which may arise directly or indirectly from use of or reliance on such information.

Silver Outlook: $120+ on Deck?XAGUSD has been grinding higher with the kind of energy we only see before major parabolic moves. The long-term chart shows decades of coiling and multiple breakouts that all share one thing: when silver runs, it explodes.
With inflation sticky, industrial demand climbing, and precious metals back in the spotlight, silver sitting at $39 today could be the calm before the storm. A breakout through the $50 zone sets up a straight shot toward $76, and in a full 2025 commodity supercycle, $120+ is not just possible, it looks like history repeating itself.
This chart doesn’t whisper, it shouts: silver’s next chapter could be its biggest yet.

SILVER H9 | Market OutlookPotential for a bullish pullback on the XAGUSD H9 which could lead to a price movement towards the resistance level at 40.300. BUY levels from 39.500

SILVER: Bearish Continuation is Expected! Here is Why:
The recent price action on the SILVER pair was keeping me on the fence, however, my bias is slowly but surely changing into the bearish one and I think we will see the price go down.
Disclosure: I am part of Trade Nation's Influencer program and receive a monthly fee for using their TradingView charts in my analysis.
❤️ Please, support our work with like & comment! ❤️

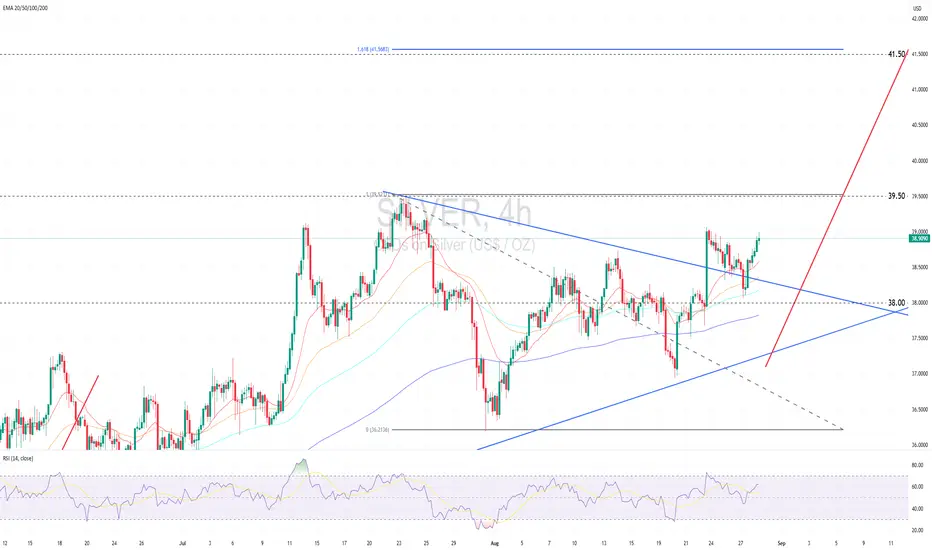
Silver Breaks Out of Key Trend Range with Multiple Supporting FaSilver Breaks Out of Key Trend Range with Multiple Supporting Factors
Technical View
Silver has broken out above the triangle’s upper boundary, signaling a potential shift from consolidation to bullish momentum.
A decisive break above the July peak at 39.50 would confirm an uptrend and open the way toward 41.50, aligned with the 161.8% Fibonacci retracement.
Failure to clear the psychological barrier at 39.00, however, could trigger a pullback toward 38.00 or the ascending trendline support.
Notably, a golden cross across multi-period EMAs has just formed, reinforcing the bullish bias.
Fundamental View
The key driver for an uptrend in precious metals, including silver, is political turmoil after President Trump’s attempt to fire Fed Governor Lisa Cook raised concerns over the Fed’s independence. Markets now price in an 85% chance of a September rate cut, up from 78% a week ago.
The dollar weakened on rate-cut expectations, supporting metal prices, though it stabilized slightly mid-week.
Markets are awaiting US Q2 GDP data (3% growth expected) and July PCE inflation, the Fed’s preferred gauge, which is likely to remain above the 2% target.This is likely to create volatility in the market.
Analysis by: Krisada Yoonaisil, Financial Markets Strategist at Exness
XAGUSDSuccess in the FX, indices, and gold markets comes from discipline, not luck — I win by combining deep market analysis with strict risk management, keeping emotions out of trading, and focusing on long-term consistency rather than quick gains. Every trade is based on research, patience, and clear strategy, allowing me to grow steadily while protecting capital.

SILVER Potential Short! Sell!
Hello,Traders!
SILVER keeps growing
And we are bullish biased
Mid-term but the price will
Soon hit a horizontal resistance
Of 39.52$ from where a local
Bearish pullback is to
Be expected
Sell!
Comment and subscribe to help us grow!
Check out other forecasts below too!
Disclosure: I am part of Trade Nation's Influencer program and receive a monthly fee for using their TradingView charts in my analysis.

Silver Acceleration PhaseGold and Silver are entering acceleration mode.
Silver tends to run into hyperdrive during gold's last major leg up. Gold could push to 3,800+ here, while Silver could run up to 45+.
The miners are very happy. Most of their technicals look amazing.
PAAS and FMS in particular are my favorites currently and look like they want to moon soon.
