US100 trade ideas
NAS100 - Stock Market, Waiting for Inflation Index?!The index is above EMA200 and EMA50 on the one-hour timeframe and is in its long-term ascending channel. If the drawn upward trend line is maintained, we can expect Nasdaq to reach its previous ATH. In case of its valid breakdown, its downward path will be smoothed to the specified demand zone, where it can be bought with appropriate risk-reward.
U.S. equities closed lower on Friday after a volatile session, capping off a turbulent week in negative territory. Initially, weaker-than-expected employment data fueled optimism that the Federal Reserve would move toward further rate cuts. However, growing fears of an economic recession quickly overshadowed that optimism and pushed the indexes into the red.
Following the labor market report, expectations for a 25-basis-point rate cut at the Fed’s September meeting are now virtually certain. The main question, however, is how fast subsequent cuts might unfold. Some analysts have even floated the possibility of a surprise 50-basis-point cut on September 17. Fed Chair Jerome Powell, speaking at the Jackson Hole symposium, stressed that risks stemming from labor market weakness may now outweigh inflation risks—a factor that could justify a shift in the central bank’s policy approach.
Nick Timiraos, a prominent Wall Street Journal reporter closely tracking Fed policy, noted that the sharp slowdown in job growth over the summer has likely cemented the Fed’s decision to cut rates by 25 basis points in the upcoming meeting.
Still, he made no explicit mention of a 50-basis-point move. While markets have raised the probability of that scenario to 14%, Timiraos believes the main focus remains on a more moderate reduction. He also observed that the latest jobs report has deepened uncertainty over the pace and scope of cuts beyond September—a challenge that policymakers and markets will grapple with in the months ahead.
Barclays Bank now projects the Fed will lower rates three times in 2025—each time by 25 basis points in September, October, and December. This is an upward revision from its earlier forecast of just two cuts in September and December.
President Donald Trump once again lashed out at Fed policy in a post on his social media platform, writing: “Jerome Powell should have cut rates long ago. But as usual, he has acted too late.”
Meanwhile, mounting concerns over ballooning fiscal deficits—not only in the U.S. but also in countries like Japan, France, and the U.K.—have placed added pressure on long-dated bonds. The yield on the 30-year U.S. Treasury briefly climbed to a one-and-a-half-month high last week. At the same time, the Treasury Department plans to issue new three-year, ten-year, and thirty-year securities next week, an event that could further fuel volatility in the bond market.
The coming week will be light in terms of data volume, yet the few scheduled releases will carry significant weight as inflation once again takes center stage. On Wednesday, the Producer Price Index (PPI) for August will be published. Forecasts suggest both the headline and core readings will show sharp declines compared to July.
On Thursday, the European Central Bank (ECB) will hold its policy meeting, where markets currently expect the deposit rate to remain unchanged at 2.15%. Shortly afterward, traders will turn their attention to the U.S. Consumer Price Index (CPI) for August, along with weekly jobless claims data—closely monitored for signs of potential weakness in the U.S. labor market.
Finally, on Friday, the preliminary University of Michigan Consumer Sentiment Index will be released. This survey has been a particularly important gauge of inflation expectations this year, offering deeper insights into how U.S. households perceive price trends.
The PPI, which reflects changes in goods prices at the factory gate, often provides more forward-looking signals than the CPI. As shown in July’s data, any unexpected surge in August’s numbers could temper investors’ optimism about the pace of rate cuts. For now, the impact of tariffs on goods prices appears limited, while the Fed’s main concern remains the risk of renewed inflationary pressures in the services sector. According to the Cleveland Fed’s Nowcast model, headline inflation rose 0.1% in August to reach an annualized rate of 2.8%, while core inflation held steady at 3.1%.

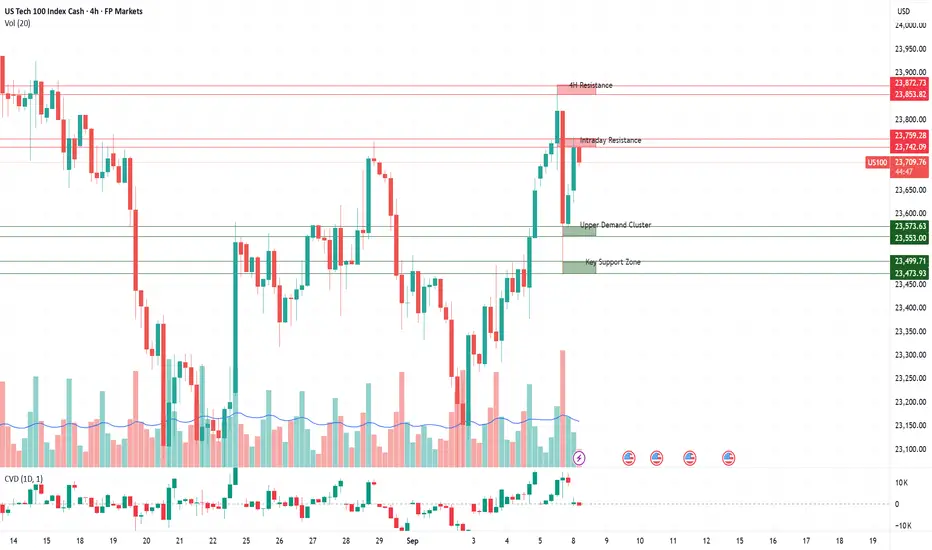
Nas100: Trading Levels in FocusSupply Zones (Red)
23,853 - 23,873
A strong supply zone near recent highs. Sellers are expected to defend aggressively here, making it a potential rejection area. A confirmed breakout and retest, however, could open the path toward new highs.
23,742 – 23,759
This zone reflects last week’s high-volume rejection. Acts as an intraday decision area: sharp rejections can trigger short setups, while a clean break and hold above would strengthen bullish momentum.
Demand Zones (Green)
23,553 – 23,573
A fresh demand zone aligned with recent breakout structure. Buyers may attempt to defend here for continuation longs. If broken, the zone flips into resistance, adding downside pressure.
23,473 – 23,500
Well-tested support area with prior absorption. Strong bounce potential, but multiple retests increase the risk of a breakdown. A failure here would likely accelerate bearish momentum.
Overall Sentiment: Cautiously Bullish on Fragile Ground
At its core, the market is cautiously optimistic right now. Positive momentum from Big Tech and expectations of looser monetary policy are fueling short-term upside potential. At the same time, consolidation and uncertainty around macro data keep sentiment restrained. Momentum is present but it relies on breakout moves holding.
Key levels for us100we are facing an strong liquidity zone then we are not going to go against it even it give us the shake out. now, if it breakt the 23,745 and then it shakes out we can go to the 23900s but, in the case that it breaks 23635 and dont manage to reclaim the 23681 we can expect a fall but i dont see the fall that near. However lets see what tomorrow holds for us. Btw if it shakes out the 23748 we will cover once it reaches 23879 50 to 70% and then the rest we will see how we can add along the way.
killzone ideal setup to takeSTEP 1: Spot session HH/LL (prefered asia session)
STEP 2: Wait for next session to sweep HH/LL of previous session
STEP 3: Spot FVG,OB or wtv that confirm reversal/continuation
STEP 4: Enter position after confirmation of market reaction
NQ Weekly Analysis!FA Analysis:
1- We know that the FED opened the door for a rate cut in September (Next week). The FED gave priority to address Employment Mandate issue and considered the higher inflation data as one time shot.
2- Hence, the Inflation (the second FED mandate) the most relevant data this week with both PPI and CPI to validate the FED view of one time shot. Another higher inflation will destroy this narrative and the FED might revise the way forward.
The story is simple: Higher Inflation data will send NQ down and vice-versa for inline and softer inflation.
TA Analysis:
Weekly TF:
The weekly close expresses really the incertitude regarding the direction. No clear direction; both direction are open; all will depend on inflation data.
Daily TF:
The daily close was bearish. NFP data provided an inline inflation data but a very negative employment data. As mentioned, bad data data is bad for NQ and vice-versa.
From daily perspective, price might retest Friday high or just NFP low (magenta dotted line) and continue down towards TP1, TP2 and TP3 particularly if Inflation data comes strong.
H4 TF:
H4 provided a break down. Inline with daily analysis, the least resistance is that price continues down after a short retrace up.
GL Everyone!
US100 Technical Analysis! SELL!
My dear friends,
My technical analysis for US100 is below:
The market is trading on 23633 pivot level.
Bias - Bearish
Technical Indicators: Both Super Trend & Pivot HL indicate a highly probable Bearish continuation.
Target - 23440
About Used Indicators:
A pivot point is a technical analysis indicator, or calculations, used to determine the overall trend of the market over different time frames.
Disclosure: I am part of Trade Nation's Influencer program and receive a monthly fee for using their TradingView charts in my analysis.
———————————
WISH YOU ALL LUCK
QQQ Concentration RiskSince mid-2023, the gap has steadily widened - it doesn’t mean an immediate reversal, but it does mean QQQ is very top-heavy (the NDX/NDXE ratio tends to oscillate in bands; rather than, trend infinitely higher)
Strong NDX vs weak NDXE suggests a fragile rally
If mega-caps stumble, the whole index could pull back hard
However, if breadth improves (NDXE starts outperforming), that would strengthen the rally base
Current leadership concentration favors short-term bullish momentum (45%), but the rally is fragile, if mega-caps falter, the downside could open quickly (30%)
1. FAANG + NVDA/TSLA Leadership Persists
Ratio keeps rising (NDX > NDXE)
Leaders continue to attract flows (AI, cloud, semis).
QQQ pushes to new highs with narrower breadth
Rally vulnerable if just one or two leaders stumble (NVDA, AAPL, etc.)
+5–10% upside near term if momentum holds
2. Pause & Rotation (25%)
Ratio stalls near highs
Equal-weight (NDXE) starts to catch up
Breadth improves modestly, but QQQ as a whole chops sideways
QQQ consolidates in a 5%–7% band
3. Breadth Divergence Resolves Lower (30%)
Concentration risk unwinds
Leaders mean-revert (profit-taking, earnings disappointments)
NDX underperforms NDXE, ratio falls from highs
QQQ could correct −10% or more
The ratio at 2.88 is stretched relative to historical balance
A “reasonable” medium-term range would be closer to 2.3–2.5 (15% to 25% on percentage scale)
Implies QQQ pause/correction while NDXE holds steady or outperforms, or broadening participation (small/mid Nasdaq catching up)

NAS100 Bearish Reversal from Supply Zone – Short SetupThe NAS100 (1H chart) is trading within a channel structure marked by a rejection line (resistance) and a support line. Price recently broke below the EMA (70 & 200), showing bearish momentum.
Supply Zone (POI): 23,524 – 23,637, where price may retest before further decline (potential short entry zone).
Trend: Current momentum is bearish after rejection from channel resistance.
Support/Target: Main downside target is 22,979 – 22,905, aligning with previous swing low and Fibonacci extension area.
EMA Strategy: Price below both 70 & 200 EMA indicates bearish trend continuation.
Structure Break: Breakdown of channel support suggests sellers are in control.
📌 Trading Plan:
Entry (Sell Zone): 23,524 – 23,637 (POI Supply Zone)
Stop Loss: Above 23,640 (channel resistance)
Target: 22,979 – 22,905
Conclusion:
Market is in bearish structure. Wait for pullback to supply zone for a high-probability short entry, targeting the lower support zone.


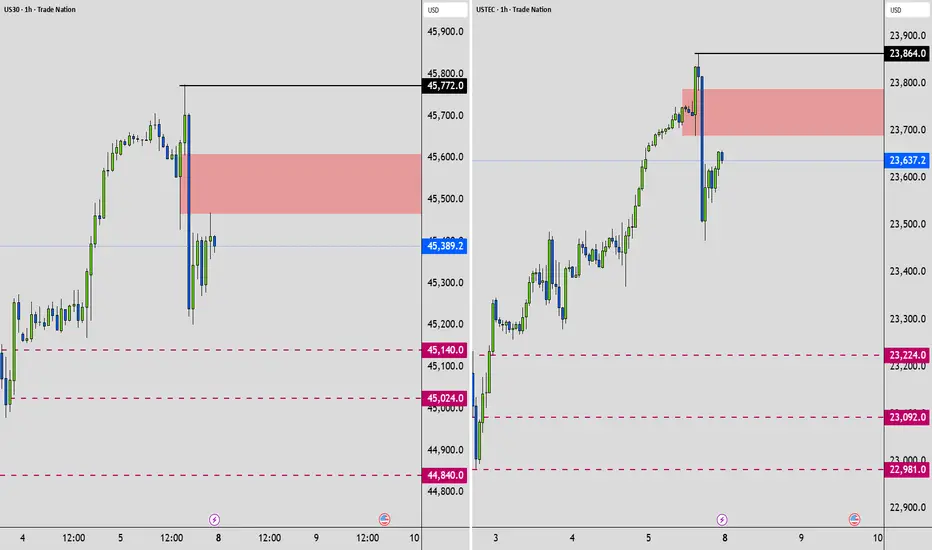
US30 & NAS100 - Potential TargetsDear Friends in Trading,
How I see it for Monday & Tuesday: 8-9 Sept.
1) Potential Targets for US30
2) Potential Targets for NAS100
Keynote: BE SAFE!
Wednesday to Friday is stacked with High Impact Data.
I personally will be focusing on catching setups for this week before Wednesday.
I sincerely hope my point of view offers a valued insight.
Thank you for taking the time study my analysis.
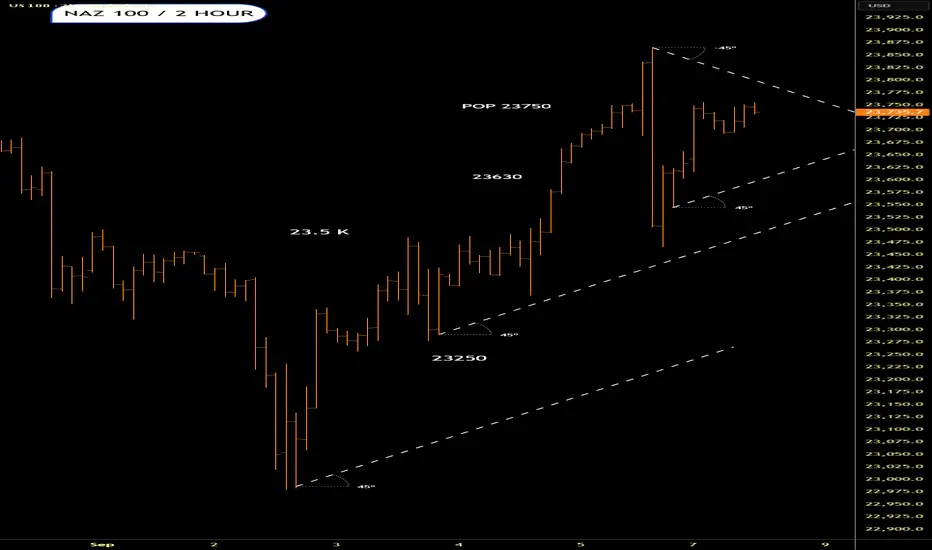
Buy zone of Nas100If we start trading inside the triangle again, then there is a possibility sellers will step in the market and push the market lower to the buy zone area. The triangle pattern is a strong indication of sell - however, the overall market structure of Nas100 is bullish, therefore, I will not be taking sells if sellers do step in the market, I will still wait for buy entries.
If the market trades up, and breaks resistance, I will look for buy entries on smaller TF and continue with the bullish momentum.

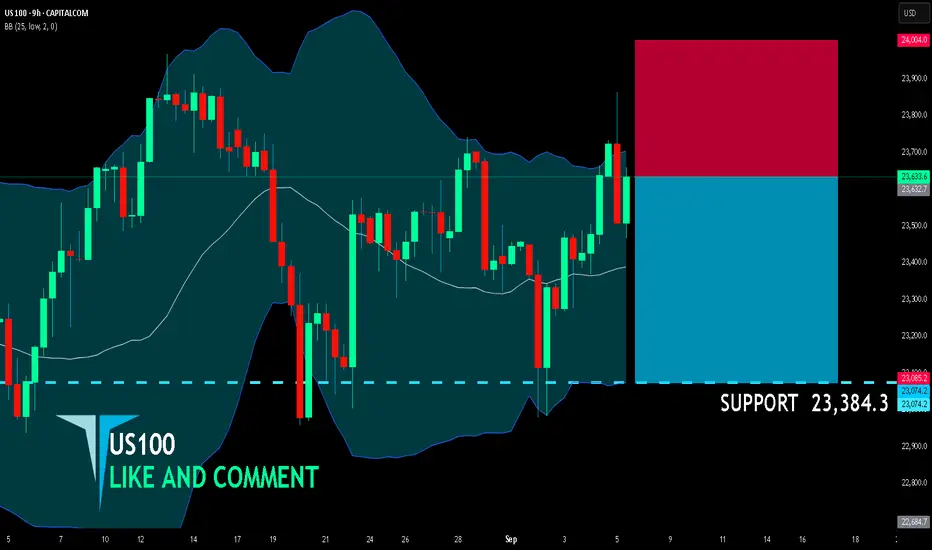
US100 SHORT FROM RESISTANCE
US100 SIGNAL
Trade Direction: short
Entry Level: 23,632.7
Target Level: 23,384.3
Stop Loss: 24,004.0
RISK PROFILE
Risk level: medium
Suggested risk: 1%
Timeframe: 9h
Disclosure: I am part of Trade Nation's Influencer program and receive a monthly fee for using their TradingView charts in my analysis.
✅LIKE AND COMMENT MY IDEAS✅
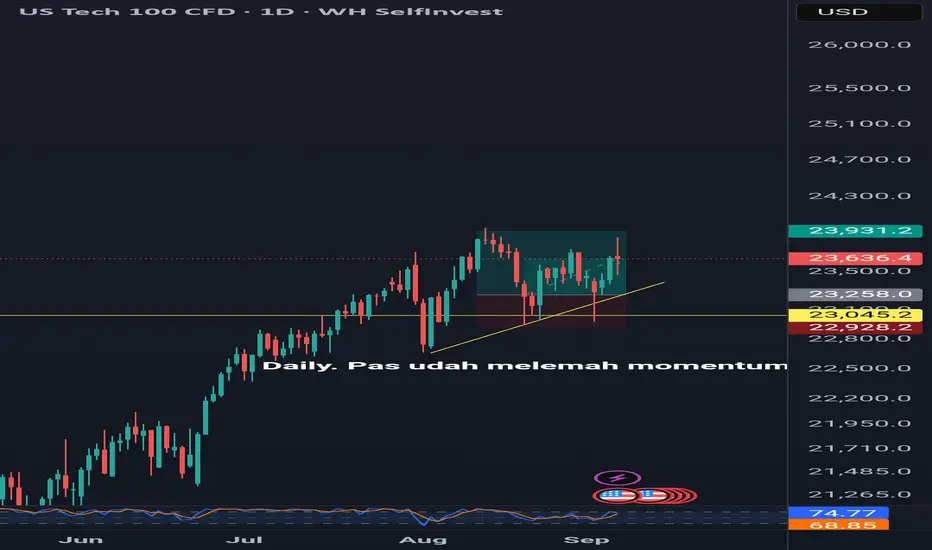
Bottoming, chart patternWe see Nasdaq already hit bottom in price of USD 23.258. We have been entry in that price (althought it has been muted by tradingview because we use indonesia language in description)
My reason for entry is l, he has hit the bottom and see rejection. My TP is in old ATH and my SL in half of my pips.
Three possibilities my setup not in my favor
1. The fed cut interest rate
2. Technically, its reversion pattern
3. It is what it is.
Understanding Consolidation & Trading itWhat Consolidation Is
Consolidation is a market phase where price moves sideways within a defined range, showing indecision or balance between buyers (bulls) and sellers (bears).
Characterized by low volatility, overlapping candles, and no clear trend direction.
Often occurs after strong moves (as the market pauses) or before breakouts (accumulation/distribution).
Impact on Bulls & Bears
Bulls: View consolidation near highs as accumulation (buyers building positions before a breakout upward).
Bears: View consolidation near lows as distribution (sellers unloading before a breakdown).
Both sides place stop orders outside the range → creating liquidity pools that smart money hunts.
How Traders Can Take Advantage
Range Trading – Buy near support of the range, sell near resistance, until breakout occurs.
Liquidity Strategy – Wait for fakeouts beyond consolidation, then trade in the opposite direction (stop hunt setup).
Consolidation Across Timeframes
Lower Timeframes (1m–15m):
Looks like noise but is often where scalpers range trade.
Breakouts can give small but quick moves.
Mid Timeframes (1H–4H):
Shows clear accumulation/distribution phases.
Useful for intraday & swing traders.
Higher Timeframes (Daily–Weekly):
Represents major market indecision.
Breakouts from these zones often fuel massive trend moves.
✅ Summary:
Consolidation = sideways range = balance of bulls & bears.
Inside range → fade the extremes.
Outside range → trade support & resistance or liquidity sweep.
On different timeframes → the same consolidation can be noise on 5M, but a critical accumulation on the Daily chart.

NAS100 At Major Resistance - Breakout or Reversal?NAS100 Technical Analysis: 🚀 At Major Resistance - Breakout or Reversal? 📉
Asset: NAS100 (NASDAQ 100 CFD)
Analysis Date: September 5, 2025
Current Closing Price: 23,639.8 (as of 12:59 AM UTC+4)
Timeframes Analyzed: 1H, 4H, D, W
Executive Summary & Market Outlook 🧐
The NAS100 is at a critical technical juncture, testing a formidable resistance zone between 23,600 and 23,800. 📊 The index is in a clear long-term bullish trend but shows signs of short-term exhaustion after a powerful rally. This is a classic "make-or-break" level. A decisive breakout above 23,800 could ignite a new leg up towards 24,500, while a rejection here may trigger a significant corrective pullback towards 22,800. This analysis provides a roadmap for both intraday traders 🎯 and swing traders 📈.
Multi-Timeframe Technical Analysis 🔍
1. Trend Analysis (Daily & 4-Hour Chart):
Primary Trend: 🟢 Bullish. Price is above all major Daily Moving Averages (200, 100, 50 EMA), which are aligned bullishly.
Short-Term Trend: 🟡 Bullish but Overextended. The rally has been near-vertical, suggesting the market is ripe for a pause or pullback.
2. Key Chart Patterns & Theories:
Resistance Confluence Zone 🧱: The current price is battling a massive resistance cluster. This zone includes:
A prior major swing high (Price Action Resistance).
The 127.2% and 161.8% Fibonacci extension levels from the last significant correction.
A potential Bullish Cypher pattern's Potential Reversal Zone (PRZ).
Elliott Wave Theory 🌊: The rally from the last major low is best counted as a powerful Impulse Wave. We are likely in the final stages of Wave 5 or a complex Wave 3 extension. This implies that while the trend is up, a larger Wave (4) correction is increasingly probable. Typical retracement targets for a Wave 4 are the 38.2% Fib level near 22,800.
Ichimoku Cloud (H4/D1) ☁️: Price is trading high above the Cloud on daily charts, confirming the strong bullish trend. The Lagging Span (Chikou Span) is also well above price, indicating sustained buying pressure. However, such extreme extensions often precede consolidation.
Gann Theory ⏳: The 23,600-23,800 area represents a key mathematical resistance zone. A daily close above this could open the path to the next Gann angle target.
3. Critical Support & Resistance Levels:
Resistance (R1): 23,800 - 24,000 (Key Psychological & Technical Ceiling) 🚨
Resistance (R2): 24,500 (Projected Target)
Current Closing Price: ~23,640
Support (S1): 23,200 - 23,400 (Immediate Support & 21-period EMA) ✅
Support (S2): 22,800 - 23,000 (Major Support - 38.2% Fib & Prior Breakout Zone) 🛡️
Support (S3): 22,200 (200-Day EMA & 50% Fib)
4. Indicator Consensus:
RSI (14-period on 4H/D): Reading is above 70 on both timeframes, signaling severely overbought conditions. 📛 This is a warning against chasing longs at these highs. A bearish divergence is forming on the 4H chart, hinting at weakening momentum.
Bollinger Bands (4H) 📏: Price is consistently riding the upper band, a sign of a strong trend. However, a move back towards the middle band (20-period SMA) is a common next step after such extensions.
Moving Averages: The bullish alignment (EMA8 > EMA21 > EMA50) is intact. The EMA 21 on the 4H chart (~23,400) is critical immediate support.
Volume & VWAP: Volume has been declining on the most recent push higher, a potential bearish divergence 📉 suggesting a lack of conviction at these highs.
Trading Strategy & Forecast 🎯
A. Intraday Trading Strategy (5M - 1H Charts):
Bearish Scenario (Rejection Play) ⬇️: This is the preferred setup given overbought conditions. Look for bearish reversal candlestick patterns (e.g., Bearish Engulfing, Evening Star 🌟) at or near the 23,800 resistance.
Entry: On confirmation of rejection.
Stop Loss: Tight, above 23,850.
Target: 23,400 (TP1), 23,200 (TP2).
Bullish Scenario (Breakout Play) ⬆️: If buyers overpower and we get a strong 1H close above 23,850, a momentum long could be viable.
Entry: On a small pullback to ~23,780 (re-test as support) or on the breakout.
Stop Loss: Below 23,650.
Target: 24,200 (TP1), 24,500 (TP2).
B. Swing Trading Strategy (4H - D Charts):
Strategy: WAIT FOR A PULLBACK. The risk/reward for new long entries at this resistance is poor. 🚫 The optimal strategy is to wait for a healthy correction to key support zones to add long positions.
Ideal Long Zones: 23,200 (shallow pullback) or 22,800 (deeper correction). ✅
Bearish Risk: A daily close below 22,800 would signal a much deeper correction is likely underway, potentially targeting 22,200.
Risk Management & Conclusion ⚠️
Key Risk Events: High-impact US economic data (e.g., NFP, CPI) and Fed policy announcements are paramount. 🔥 Any hawkish surprises could be the catalyst for a sharp tech-led selloff.
Position Sizing: The potential for increased volatility demands conservative risk management. Never risk more than 1-2% of your account on a single trade.
Conclusion: The NAS100 is bullish but exhausted. 🥴 The current resistance zone is a high-risk area for new longs and a high-probability area for a pullback. 🎯 Swing traders should be patient for a better entry. Intraday traders can play the range between 23,200 and 23,800 until a decisive break occurs. The overall trend remains up, but a period of consolidation or correction is the most probable outcome in the near term.
Overall Bias: 🟢 Bullish above 22,800 | 🟡 Neutral/Bearish below 23,200
For individuals seeking to enhance their trading abilities based on the analyses provided, I recommend exploring the mentoring program offered by Shunya Trade. (Website: shunya dot trade)
I would appreciate your feedback on this analysis, as it will serve as a valuable resource for future endeavors.
Sincerely,
Shunya.Trade
Website: shunya dot trade
Disclaimer: This post is intended solely for educational purposes and does not constitute investment advice, financial advice, or trading recommendations. The views expressed herein are derived from technical analysis and are shared for informational purposes only. The stock market inherently carries risks, including the potential for capital loss. Therefore, readers are strongly advised to exercise prudent judgment before making any investment decisions. We assume no liability for any actions taken based on this content. For personalized guidance, it is recommended to consult a certified financial advisor.

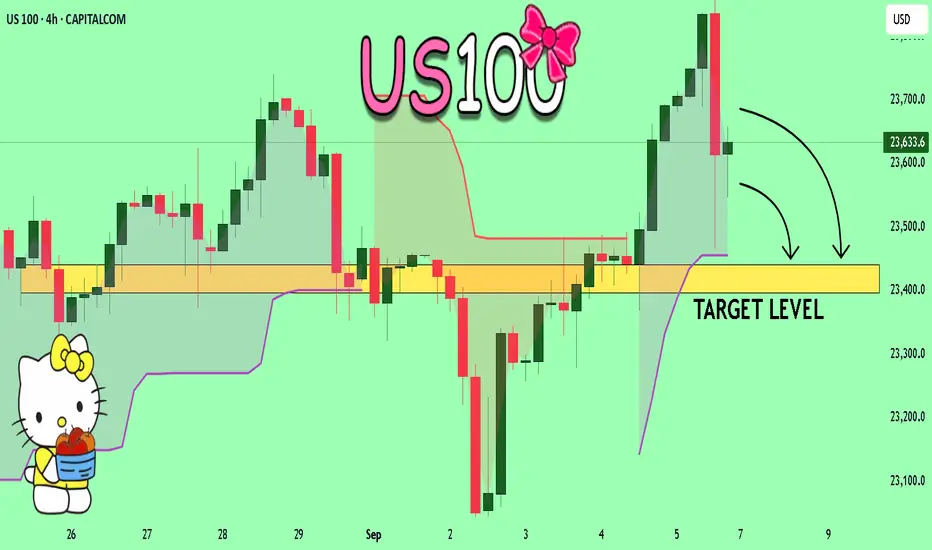
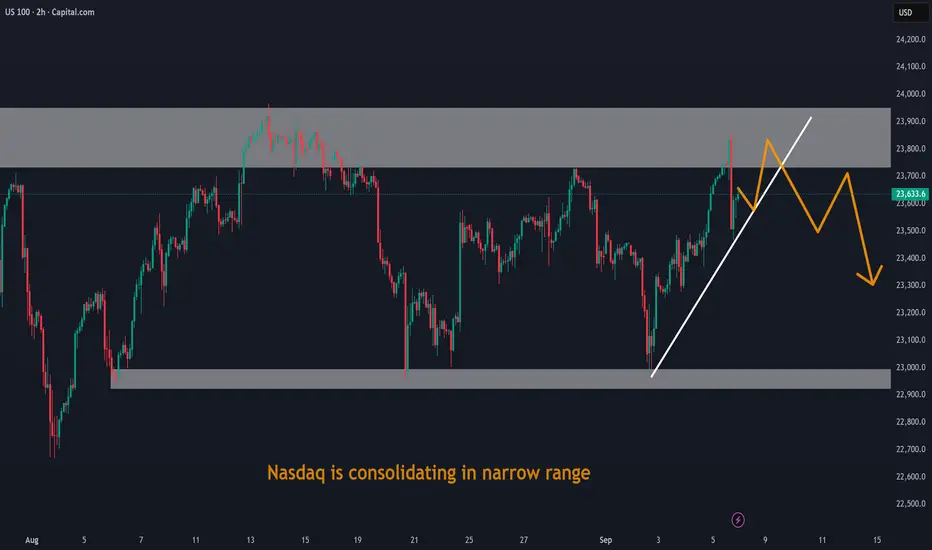
Nasdaq is consolidating in narrow rangeNasdaq is consolidating in narrow range. Waiting for some big fundamental news for breakout
NASDAQ - Bullish Flow into Highs
Bias: Bullish
HTF (4H Overview):
From the bird’s-eye view, structure remains bullish. Liquidity is being targeted across the 30M–4H multi-timeframe play, with strong bullish intent confirmed by volume printing to the upside.
LTF (30M / 5M Confirmation):
A proper CHoCH has been established. Once the trend shift occurs, we wait for the pullback before attending longs.
Entry Plan:
Look for entry after the courtyard liquidity is collected and demand is mitigated (slash zone).
Targets:
Initial: 5M highs
Extended: 30M highs, depending on market delivery.
Mindset Note:
Patience—let liquidity do its job before striking.

NasDaq Bullish analysisThough the market made a quick sell, I still think the market will continue to the upside and will break the previous structure.
NAS100 OUTLOOOKPrice is within August Range, therefore it can either take the buy side liquidity/sell side liquidity before it can actually give us a significant move.
Within this August's Range, it started taking out previous weekly Buy side liquidity, therefore the price is expected to go to the relevant equal lows

Nas100 Trade Set Up Sep 5 2025FX:NAS100
www.tradingview.com
Price switched to bullish structure yesterday and is now making HH/HL so i will be looking for a pullback into 15m FVG followed by a 1m IFVG to target higher BSL

US NAS100Preferably suitable for scalping and accurate as long as you watch carefully the price action with the drawn areas.
With your likes and comments, you give me enough energy to provide the best analysis on an ongoing basis.
And if you needed any analysis that was not on the page, you can ask me with a comment or a personal message.
Enjoy Trading ;)

Nasdaq shortA nice smt has formed .
Targeting the asian lows .
Let us see if the news will have an impact on this chart .
Chart looks bearish.
