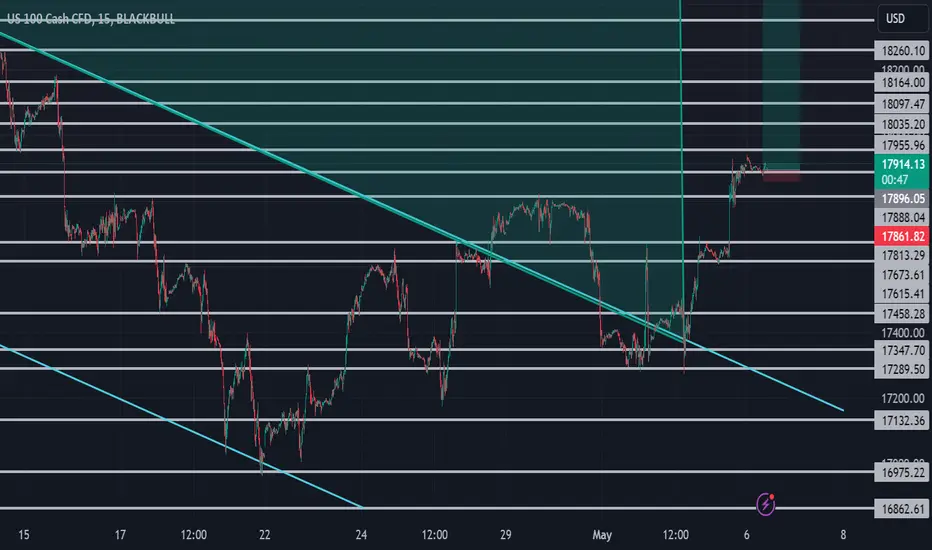
LONG is the way to goEasy money, the market is going to explode like a rocket after we hit the 18k line.
US100 trade ideas

NASDAQPair : NASDAQ
Description :
Completed " 12345 " Impulsive Waves
RSI - Divergence
Break of Structure
Bullish Channel as an Corrective Pattern in Short Time Frame
Fibonacci Level - 78.60%


5/6/2024 NASDAQ PerspectivePOI areas for today. I'm waiting for price to take liquidity and react to these areas. I shall personally take entries dependent on how price reacts in these zones. If price takes liquidity on the 1m timeframe in any area and shoots towards a POI, then that POI is more then likely invalidated. If price slows down before reaching a POI, then it's more then likely valid. Trade at your own risk. Good luck today!

NAS100...New Zig RequiredDo not sleep on a bullish market...
Sells are only retracements...
Historically bullish moves on the biggest timeframes
Every Zag needs a Zig
Every Zig needs a Zag
You have been warned....
#patience
#auberstrategy
#zigzagtheory
#whywewait

NAS100USDWe can attempt to buy NAS100USD from specified level as it break last LH , also there is bullish divergence indicate that it move upward.
SL , TP mention in chart.


In all its a buy...but a retracement is possibleIn all its a buy...but a retracement is possible, as for monday, I expect the price to go a bit down before uptrend goes further

just asking the Lordplease tell me what do you see in the chart?
I need some help to publish ideas please

NAS100 possible shortPossible short position on Nas100, after buyside liquidity is taken price should then take out the sell side liquidity where take profit is set. Risk management is key here
Strategy as follows:
One trade per week.
Risk 1% on funded account.
Minimum 1:2 risk to reward.

A sell for a short timeA retracement might happen, SL as shown. All the luck to the traders out there

NAS100-Weekly Setup/ideaAfter an ugly couple of weeks, the NQ has been able to recover
flawlessly above all support levels, and is looking poised to continue higher here.
If the Nasdaq can continue to hold onto 17000 in the future, expect a test of 18080-18200 in
the near future. Anything above 18500 would open the door to higher targets at
18650/19000/19200/19550 and higher.
If the NQ cannot hold onto 17000 this week, expect a move lower to test supports at
16500-15600/15250. Anything under 15250 and targets would be 15000/14750/14500/14250-14000 in the future.

Nasdaq 100 forming Gartley Bearish ReversalA possible short entry can be taken as per Gartley Bearish Reversal Pattern is forming. This is nota financial advice just DYOR

NAS100We looking for selling opportunities as we have reached the resistance of the trend should we not break it that will results in sells

nas100Companies included in the index are some of the largest in the world, such as Microsoft, Apple, Amazon, Tesla, and Meta. The Nasdaq 100 is an index, so it cannot be directly invested in, but investors can gain exposure to the index through exchange-traded funds (ETFs), mutual funds, futures and options, and annuities.

NASDAQ - Daily ready to fall?The NASDAQ has ascended for a second leg and is now poised for a potential deep pullback to test the support zone. This support area aligns with a key weekly level that typically needs to be retested before the index can mount a continued rise. You should keep a close eye on this trend, as it could present a significant opportunity in the coming period.

NAS100 update on the nas100 from my previous post,price played out as predicted,still more upside to follow in the upcoming week,updates to follow as price plays out


Nas100 In case of retracement and continuation upPlease see my previous idea
As my previous idea, I mentioned the next nas100 movements.
Where we are now?
As you can see from the picture, Friday we touched liv 0.786 Fibonacci (17917.60).
On the RSI indicator an overbought position in multiple TF.
Appl on RSI indicator shows overbought in multiple TF.
This calling an obviously down from now. I advise to all that don’t have a positions open now, To open a Short position.
Green LH red HL
Nas100 will aim surely to
0.618 fib level (17529.90)
0.786 fib level ( 17418.40)
If stop the downtrend on those levels and will start to back up, we will consider the downtrend in large Tf invalid and a continuation up, possibly on the ATH.

NAS100 just a retracement or short continuation?Analysis 06/05
Nasdaq just a retracement or Short?
As my previous idea, I mentioned the next nas100 movements.
Where we are now?
As you can see from the picture, Friday we touched liv 0.786 Fibonacci (17917.60).
On the RSI indicator an overbought position in multiple TF.
Appl on RSI indicator shows overbought in multiple TF.
This calling an obviously down from now. I advise to all that don’t have a positions open now, To open a Short position.
Green LH red HL
Nas100 will aim surely to
0.618 fib level (17529.90)
0.786 fib level ( 17418.40)
If stop the downtrend on those levels and will start to back up, we will consider the downtrend in large Tf invalid and a continuation up, possibly on the ATH.
To be honest I’m more likely on the second scenario. I’m showing you right now.
As mentioned as cut rates will not appearing so far, and other circumstances as war and inflation. I’m expecting a continuation of downtrend in a large Tf.
Instead respecting the retracement I will expect a continuation down, we will see breaks down m the previous HL on (17276.50) followed a retracement up and a continuation down. Find the pic attached.
Also as there are not any others important news, I’m see a clear sky of the second scenario.
I still have my sell position open from 17400
. Im consider both scenarios valid but likely 30% (1 scenario) and 70% (2 scenario).
In case of the first one I will wait the retracement for closing my position and open a buy position.
Use your money as tool and don’t be fear of the market.
Happy trading

