Flat to bullishi dont know what are they doing, but as far a yesterday's move we are into longs. so, flat to bullish buy every retracement. Still given the premarket, well have to wait for the open.
US100 trade ideas

Looking for Clues on the Nas100 Index (a short-term outlook)Uncertainty looms as the Nas100 Index currently hovers in unchartered areas of historic highs. We scale down to the lower 15m TF to get a hint of where price could possibly head next.
We personally do not intend to take any long trades until there is a significant retracement into one of the areas of interest on a higher TF as we expect choppy price action due to the uncertainty both buyers and sellers now seem to have concerning market direction.
Price did a major reaction to news on the 15m TF, soaking up areas of internal liquidity to the downside but still did not take out a significant levels of sellside liquidity. Price however, respected initially bearish orderflow and just now tapped back into the orderblock in the 18,750 price region. Due to this, we expect short-term bearish activity over the next few hours that could possibly lead to the downside retracement needed for good market entry in the coming days.
(update) more reactions and volatility on the low TF as price action now violated the previously respected bearish orderflow. We continue to enjoy our view from our seats at ringside while buyers and sellers battle it out in the quest for supremacy.

Nasdaq sellStay connected this order stay with Stop-loss and TP it will hit sure ... just book the order and sleep well ... see the result tomorrow

USNAS100 (Bullish Movement)USNAS100 New Forecast
The price remains under bullish pressure, aiming for further gains to record a new all-time high.
As long as it trades above 18660, the bullish trend is expected to continue towards 18790, 18950, and 19100. However, if the price reverses and stabilizes below 18600, it indicates a correction down to 18435.
pivot line: 18660
Resistance Price: 18790, 18950, 19100
Support price: 18555, 18435, 18230
Its range for Today will be between Support 18550 and Resistance 18880
Previous idea:

CHART BREAKDOWN NASDAQ: Key Levels, Targets and Thoughts!🎯Brief Description🖊️:
The chart provides insights into critical market levels, emphasizing an essential demand zone (low-risk buy zone) spanning from 18330 to 18315, respectively, are highlighted.
Things I Have Seen👀:
Important Demand Zone🟢: Identified between 18330 and 18315, serving as a low-risk buy.
Bullish Targets📈:
18400: Possible retracement area.
18500: Possible retracement area.
18580: Possible retracement area.
18670: Area with a lot of liquidity.
What's Important Now❗
Currently, the crucial approach is to wait and observe the price action at this level. We need to assess how the market reacts before considering any decisive moves. Stay observant and responsive to real-time developments in the market.


USNAS100 (More Bullish Pressure)USNAS100 New Forecast
The price remains under bullish pressure, aiming for further gains to record a new all-time high.
As long as it trades above 18650, the bullish trend is expected to continue towards 18790, 18950, and 19100. However, if the price reverses and stabilizes below 18600, it indicates a correction down to 18435.
pivot line: 18655
Resistance Price: 18790, 18950, 19100
Support price: 18555, 18435, 18230
Its range for Today will be between Support 18550 and Resistance 18790

CHART BREAKDOWN NASDAQ: Key Levels, Targets and Thoughts!🎯Brief Description🖊️:
The chart provides insights into critical market levels, emphasizing an essential demand zone (low-risk buy zone) spanning from 18330 to 18315, respectively, are highlighted.
Things I Have Seen👀:
Important Demand Zone🟢: Identified between 18330 and 18315, serving as a low-risk buy.
Bullish Targets📈:
18400: Possible retracement area.
18500: Possible retracement area.
18580: Possible retracement area.
18670: Area with a lot of liquidity.
What's Important Now❗
Currently, the crucial approach is to wait and observe the price action at this level. We need to assess how the market reacts before considering any decisive moves. Stay observant and responsive to real-time developments in the market.

US100- CONTINUATION PARTERNNOTE:
Broke previous 4 year high and made a 2 Month Pin. The Pin have been broken and re-tested.
See a 1-2 RTM pattern on Daily as one of the Confirmations.
2HR/4HR: Divergence of the 3 pushes:
Buys in order, and breakout of 1 week Wick fill should be addition to the position a


NAS100 Analysis: Bullish Momentum HoldsHello Everyone,
The NAS100 has adhered closely to our recent analysis. Currently, it's testing the daily support level, which is showing robust resilience. Presently, all indicators suggest further bullish momentum unless the daily pivot point consistently functions as resistance, potentially leading to a retest of the weekly pivot point.
TradeWithTheTrend3344

Balanced Price RangePrice is bearishly respecting multiple H1 imbalances in the same area looking to take price to the imbalance located in the discount or lower if possible

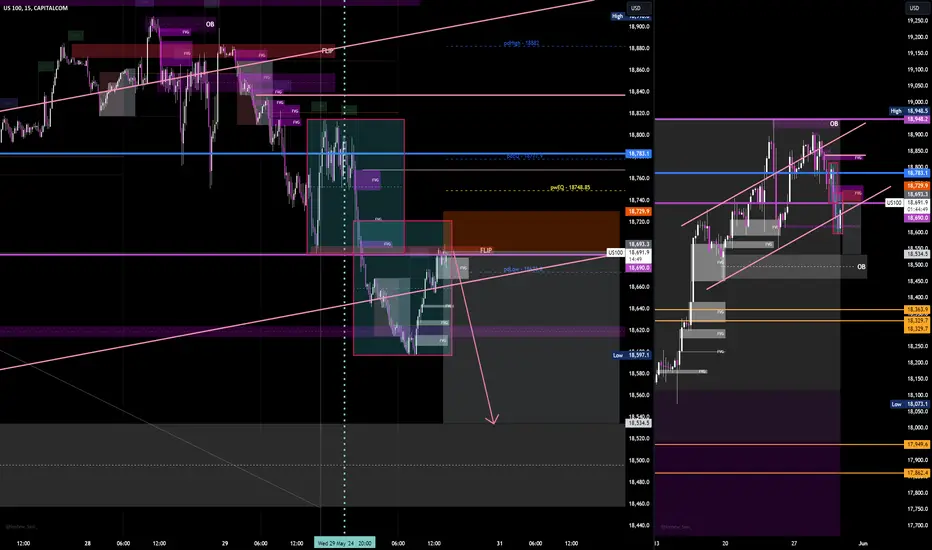
US100 final leg down to begin the panic?Entry on the previous day low FLIP zone with stop loss slightly above oberbalance.
Be aware of the news ahead and New York Killzone.
So far today we have seen a nice retrace by Europe session, but there is a possibility things are changing now and we might see a return to downtrend - with a trigger news event at 2:30 CET.
This is just for smaller positions and risky approach, as a part of a general short position I posted 2 days ago.
BUY NASQADAs you can see on the chart, the price now came out of the strongest zone of the volume profile and heading up to the IC in which you'll get a short entry.
This might be a risky trade, manage your risk!

NAS100 Possible short term bearish market?1h head and shoulders on nas100 with a choch, might be an indication that price wants to correct a bit before continuing it's overall bullish trend

US100 WEEKLY ANALYSISHello, traders here is an analysis of US100 as you can see the price has been in a bullish form for the past weeks so I have conducted support and resistance setup to predict the price direction in the next coming days/weeks, as you can see the price have just broken a resistance zone and now I will look for a pullback to that zone then look for long opportunities.

NASDAQ, S&P 500 Trying to Rebound From Q2 LowsOn Wednesday, volatility surged back into the market, with the CBOE Volatility Index (VIX) spiking 9% after hitting nearly three-year lows last week. The yield on the 30-year Treasury note, a crucial benchmark for mortgage rates nationwide, soared to 4.74%, rising more than 15 basis points over two sessions and nearing its highest close since May 2. As yields climbed, bond prices dropped, with the iShares 20+ Year Treasury Bond ETF falling 1.3%. Investors fear that the Fed will not cut interest rates more than once by the end of the year and not before November, as suggested by current Fed futures pricing.
All major U.S. equity indices and all eleven sectors traded in the red, with the U.S. dollar effectively playing its safe haven role. The Invesco DB USD Index Bullish Fund ETF rose 0.5%, marking its strongest day in a month. Rising yields and a stronger dollar pressured commodities, with gold prices down 1%, oil down 1.3%, and natural gas down 5%.
Semiconductor giant NVIDIA Corporation has been surging in value and could soon be the most valuable company in the world. The strong gains for Nvidia and other Magnificent 7 stocks have helped boost several major stock indexes, but also show significant weighting for a small basket of stocks. The top five holdings in the S&P 500, which is tracked by the SPDR S&P 500 ETF Trust, are Microsoft, Nvidia, Apple, and Amazon.com Inc., which are all Magnificent 7 stocks.
Analysts predict Nvidia shares will trade higher in the coming months with strong optimism for new products and continued artificial intelligence growth opportunities. However, the concern for investors could be the high weighting the seven companies have on a composite index that is supposed to represent the overall U.S. stock market. With 500 stocks represented in the SPDR S&P 500 ETF Trust, the fact that the top seven companies make up 31%, means that 493 stocks make up around 69% of the weighting.

breathernothing to do but to sell, hopefully with the Lords blessing well have a good day.
flat to bearish.

Short Term Buying Opportunity in NASDAQThis is a very short-term idea for a long trade in the NASDAQ: double bottom in the OBV in an overriding uptrend. The liquidity wick at the previous high is a good price target.

Small caps will continue to underperformSmall caps have under performed for 20 years and will continue to do so. Don't take the bait that "they're cheap, Fed rate cuts blah blah".


