NASDAQ Indext Chart in the 15 min time frameshort position
By checking the #NASDAQ Indext Chart in the 4-hour time frame, we see that the price is close to an important supply range
US100 trade ideas

NAS100 Weekly Analysis 5/7 5/6 @ 7:46 pm EST
1. Beach Levels
M 7/8 17500
W BTW 6 & 7 @ 18084 CMP
D 6/8 18125
4H 8/8 18125
1H 8/8 18125
M30 8/8 18125
2. Waves
Day: OB Buying; O Mid Buying
4H: OB Buying
1H: OB Selling (Bear Divergence)
M30: OB Selling
3. Channels
M- Bullish; Near top
W- Bullish; Middle
D- Bullish; B/o downside w r/t
4H- Bearish; Top
1H- Bullish; Top
M30- Bullish; Bottom
4. Fib
Day Buy Zone
50 @ 16240.7
61.8 @ 15738.9
4H Buy Zone
50 @ 17366.6
61.8 @17103.3
Reached 23.6 after 61.8.
1H Sell Zone
50 @ 17684.8
61.8 @ 17839.1
Reached 23.6 after 61.8. Looking for price to push down to 11.5.
M30 Buy Zone
50 @ 17746.6
61.8 @ 17663.6
Looking for sells due to waves and beach levels on 4H/1H/M30. Wait for price to break out of M30 channel to the downside or below 18056.4. Possible TPs @18024 @17968.8 @17890.6 @17812.5 @17734.4 @17656.3.
If price breaks above 18195, look for buys up to @18250 @18281.3 @18334.2.
Opinion: This analysis is for education purposes only and is just my opinion, this is not a trade idea.


US100 SELLThe above-mentioned technicals clearly indicate the dominance of sellers on the market. I recommend shorting the instrument, aiming at 17280.9 level.


USNAS100 (Consolidation Movemnt)USNAS100 New Forecast
The price has a senstive movement between 18030 and 18090 till breaking
stability under 18030 means will try to touch 17940 as well, and under it will continue the bearish trend till 17795
otherwise stability above the trend line about 18100 means will continue the bullish trend till 18250
pivot line: 18090
Resistance Price: 18250, 18320, 18390
Support price: 17940, 17795, 17670
Its range for Today will be between Support 17940 and Resistance 18250

5/7/2024 NASDAQ PERSPECTIVEPOI areas for today. I'm waiting for price to take liquidity and react to these areas. I shall personally take entries dependent on how price reacts in these zones. If price takes liquidity on the 1m timeframe in any area and shoots towards a POI, then that POI is more then likely invalidated. If price slows down before reaching a POI, then it's more then likely valid. Trade at your own risk. Good luck today!

Us100 SellPremium 1 hour Order block above 18200. I'll be looking for signs of a structural shift for potential shorts to above 17700 or even short down to the ordeblock around 17400.
Happy Trading! ✌️😀

Nasdaq 100 Index (D1) Bullish Technical and Fundamental AnalysisHey traders, if you know the power of 3, then you know that price is in an accumulation state in bullish right now and I expect to see hitting at 19150 and 2054 above as manipulation before the price distributes. Let's patiently wait for the price to play and provide a clear signal. Let's not make impulsive trades, let's wait for price to hit significant / psychological levels to execute and let's be patient. Follow me for more weekly forecasts and thumbs up, comment and share!
----------------------------------------------------------------------------------------------------------------------
** Like 👍, FOLLOW ✅, SHARE 🙌 and COMMENT ✍ if you like this idea! Also share your point of view on diagrams and comment in the comments section below! This is the best way to keep it updated, support me, keep the content free and let the idea reach as many people as possible. **.
----------------------------------------------------------------------------------------------------------------------

Quick Midweek Outlook☝️Do not act based on my analysis, do your own research!!
The main purpose of my resources is free, actionable education for anyone who wants to learn trading and improve mental and technical trading skills. Learn from hundreds of videos and the real story of a particular trader, with all the mistakes and pain on the way to consistency. I'm always glad to discuss and answer questions. 🙌
☝️ALL ideas and videos here are for sharing my experience purposes only, not financial advice, NOT A SIGNAL. YOUR TRADES ARE YOUR COMPLETE RESPONSIBILITY. Everything here should be treated as a simulated, educational environment. Important disclaimer - this idea is just a possibility and my extremely subjective opinion. Do not act based on my analysis, do your own research!!

AI bubble is just beginningI posted this chart 2 years ago....we are starting the defined of the AI bubble, a near 30% YoY compounding growth cycle
The Bubble cycle
1) First comes the Infrastructure
2) Then comes the Startups
3) Then comes the Services
Don't get left behind, as the Fed spends the next 2-3 years cutting rates fueling the bubble, we are just getting started.

4H Inverted Cup & Handle NAS100Analyzing NAS100: Identifying Long-Term Trends and Potential Selling Positions
Introduction:
In this video, we'll dive into a long-term analysis of NAS100, uncovering key patterns and trends that could inform our trading decisions. By examining the inverted cup and handle pattern and the emerging downtrend on the 4-hour timeframe, we aim to provide clarity on potential selling positions and assess the overall sentiment in the market.
Identifying the Inverted Cup and Handle Pattern:
The inverted cup and handle pattern is a classic technical formation characterized by a downward price movement followed by a consolidation period resembling a cup, followed by another downward movement forming a handle. This pattern often signals a bearish reversal, indicating a shift in sentiment from bullish to bearish.
Spotting the Forming Downtrend on the 4H Timeframe:
On the 4-hour timeframe, we observe the formation of a downtrend, marked by consecutive lower highs and lower lows. This trend suggests sustained selling pressure and reinforces the bearish outlook for NAS100 in the near term.
Target Levels for Selling Positions:
Based on our analysis, we have identified multiple levels that could serve as potential targets for selling positions. These levels are strategically chosen based on key support and resistance zones, Fibonacci retracement levels, and other technical indicators. Traders may consider these levels as entry points for short-selling NAS100, aiming to capitalize on the anticipated downward movement.
Clarity of Stance on NAS100:
Our analysis leaves no room for ambiguity regarding our stance on NAS100. The convergence of the inverted cup and handle pattern with the forming downtrend on the 4-hour timeframe strengthens our conviction in the bearish outlook for NAS100. This clarity enables traders to make informed decisions aligned with the prevailing market dynamics.
Signs of Bullish Euphoria Waning:
Finally, it's essential to acknowledge the signs indicating that the bullish euphoria in the market may be losing steam. Market sentiment plays a significant role in driving price movements, and recognizing shifts in sentiment can be invaluable for traders. As we assess the technical landscape of NAS100, we remain vigilant for further indications of a weakening bullish bias.
In conclusion, our analysis of NAS100 underscores the importance of understanding long-term trends and patterns in shaping trading strategies. By leveraging technical analysis tools and staying attuned to market dynamics, traders can navigate the markets with confidence and precision. Thank you for watching.

NASDAQ still on Recovery MOOD
i already telling you is good chance
but i know we have false breakdown. thats why i telling you not to put much risk on the trade. control your money management. it will help you to become mature trader
(please dont risk more than 2% in trade)
watch your risk management. Good Luck.
i try to always we will keep you all updated . Please don't forget to like, comment and follow to support me, i really appreciate you support !
Goodluck
i'll help you to have a great trade.
Please using good money management.
dont take any emotional trade.
Note:
Dont risk more than 0.2% on trending market
Dont risk more than 1% on ranging market
Wish good luck for all people.
Please help support me by Clicking like button, and if you like my ideas please follow me and support me. i Relly Appreciate it!
i'll make more and more great analysis if this chanel grows.
on Gold, eurusd, gbpusd and oil specially.
what do you think?
please comment and rate below.
Thankyou.


Very bearish on NAS100Pretty clear weekly candle here. Price often retreats to around 3/4ths of the wick before any support is found. I will target 17400 and try to catch a runner to 17000, 16400 after that. As long as we are under the weekly high Im bearish as can be on this. Possible 16400 levels. I will put trades in profit at +1 pips as soon as possible so as not to leave anything on the table.

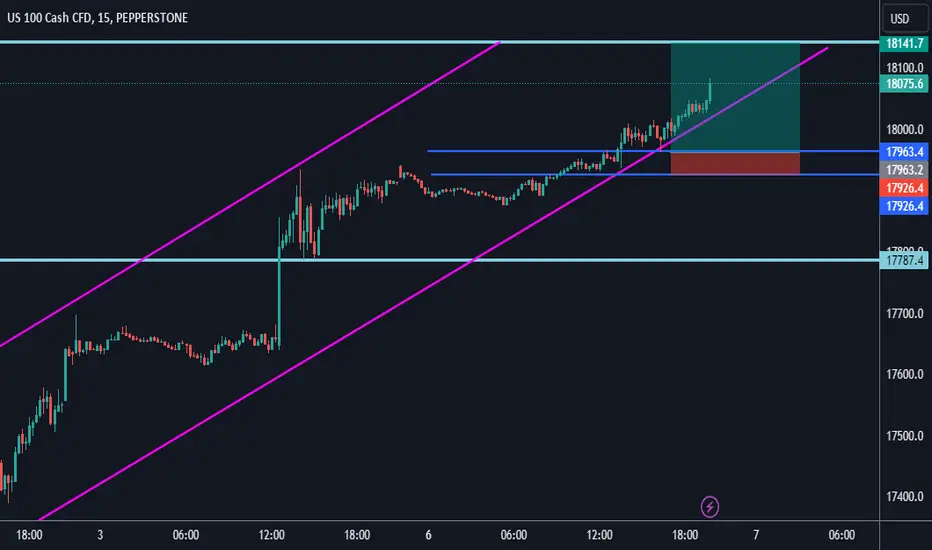
Tight consolidation-bull flag, sign of breakout?There is a very tight volatility on Nas, possible sign of break out towards 18300. If you decide to trade this idea PLEASE DO NOT ENTER NOW OR LOWER. Wait for right moment to enter, which is the retest of broken bull flag. Just if retest HOLDS, then enter to trade and set your SL. I will update this trade if-when entry conditions are met. Wish you good luck.


NDQHello dear traders, NDQ
has pulled back towards the upside. To touch the extreme Order block that remains in the price decline. I have simplified and clarified the analysis for you to easily understand my point. Use
the 15-minute confirmation for entering the trade.
#Smart Money Concept
#Liquidity
#Hunter

Nasdaq Bulls in control !!!Price has broken out of an ascending channel pattern on higher time frames created 5 min order block/demand zone, waiting for retest to look for an entry during London or New York session.

NAS100 as predicted 2 weeks ago, price was moving sideways gathering orders, took out the sellers tricking them price will continue heading down , and then turned around targeting the buyers now, this is what they call a signature move, love seen this type of setups really powerful and you can hold those type of trades for days and weeks


NAS100 Short IdeaNAS100 looks brearish on bigger POV, as it broke through last HLs and made new LL. For Now the price is in discounted range we can build our positions in sell side have SL on the top of the swing.
