USNAS100 – New All-Time High as Tech Headlines Fuel MomentumUSNAS100 – Overview
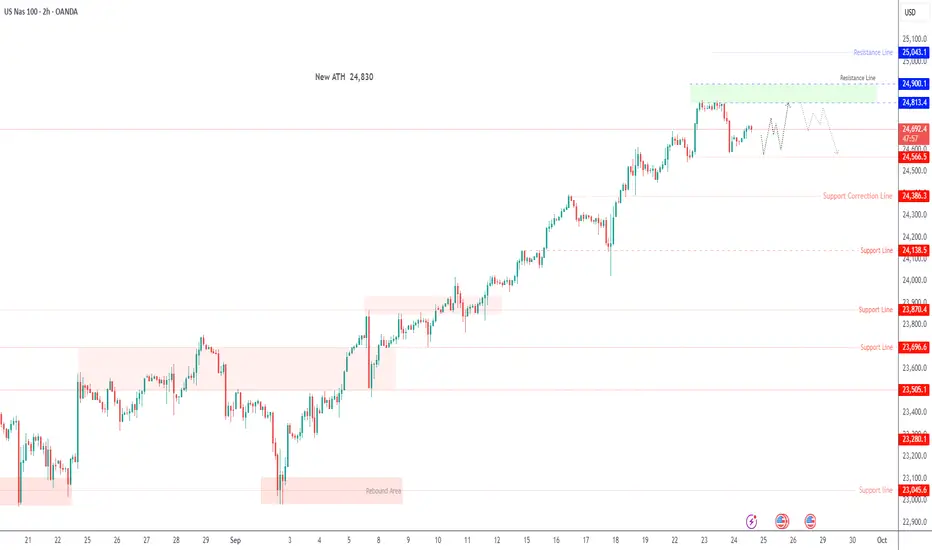
The Nasdaq 100 recorded a new all-time high (ATH) near 24,820, extending its bullish run as markets continue to digest upbeat tech headlines.
Investor sentiment remains supported by Nvidia’s plan to invest up to $100 billion in OpenAI, with the first data-center gear expected in 2026, and by anticipation of September flash PMIs, which will test U.S. economic resilience amid tariffs and ongoing Fed commentary.
Bullish Scenario
The index maintains strong bullish momentum while trading above the 24,780 – 24,710 pivot zone.
Targets: A sustained move above current highs could drive price toward 24,900 → 25,045.
An hourly close above 24,900 would reinforce upside momentum, potentially opening the way to fresh highs beyond 25,045 if tech sentiment strengthens.
Bearish Scenario
A confirmed 1H close below 24,710 would signal the start of a corrective move.
Targets: 24,570 → 24,460, with deeper losses possible if profit-taking accelerates after recent ATHs.
Key Levels
Pivot Zone: 24,780 – 24,710
Resistance: 24,900 – 25,045
Support: 24,570 – 24,470
US100 trade ideas
USNAS100 – Powell Caution Keeps Nasdaq in Tight RangeUSNAS100 – Overview
Futures tied to the S&P 500 and Nasdaq edged slightly higher on Wednesday as investors weighed measured comments from Fed Chair Jerome Powell and looked ahead to key U.S. economic data later this week.
Powell acknowledged that asset prices appear highly valued, while maintaining a cautious tone on the labor market. He avoided taking sides between Fed officials calling for deeper cuts to support jobs and those urging restraint to avoid inflation risks, emphasizing instead the delicate balancing act between growth and price stability.
📊 Technical View
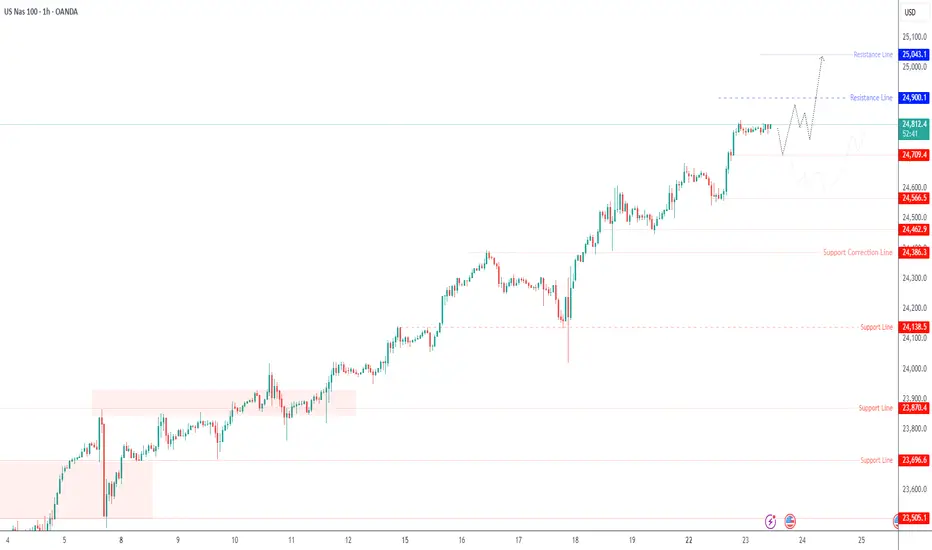
The Nasdaq100 is showing range-bound price action, with consolidation likely to continue until a clear breakout occurs.
Bearish Scenario:
Price is expected to test the resistance zone around 24,810 before pulling back toward 24,560.
🔻 A confirmed 15-min close below 24,560 would expose deeper supports at 24,380 → 24,140.
Bullish Scenario:
A decisive break above 24,900 would invalidate the bearish setup and open the way toward 25,040.
An hourly close above 24,900 would confirm renewed bullish momentum.
Key Levels
Pivot: 24,660
Resistance: 24,810 – 24,900 – 25,050
Support: 24,560 – 24,380 – 24,150
USNAS100 – Nasdaq Awaits GDP Data as Bears Hold ControlUSNAS100 – Overview
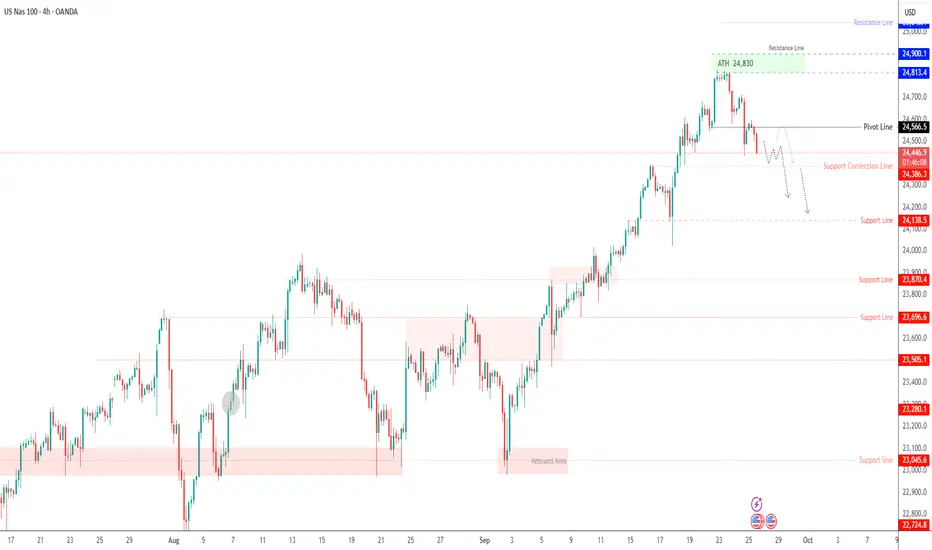
The Nasdaq 100 holds a bearish bias ahead of today’s key U.S. GDP release, with price action leaning lower as traders brace for potential volatility.
A stronger-than-expected GDP print would likely reinforce downside momentum by reducing Fed rate-cut expectations, while weaker data could provide a bullish lift for tech indices.
Technical View
Bearish Scenario:
The index remains bearish while trading below the 24,560 pivot zone.
Immediate downside targets are 24,385 → 24,140 → 23,870.
🔻 A confirmed 1H close below 24,385 would strengthen momentum toward deeper supports.
Bullish Scenario:
A confirmed 1H close above 24,570 would invalidate the bearish setup and support a move toward 24,660 → 24,810.
Key Levels
Pivot: 24,500
Resistance: 24,570 – 24,660 – 24,810
Support: 24,380 – 24,140 – 23,870
The Nasdaq remains in a data-driven range, with GDP results likely to decide whether price breaks below 24,385 to extend losses or rebounds above 24,570 to retest higher resistance.
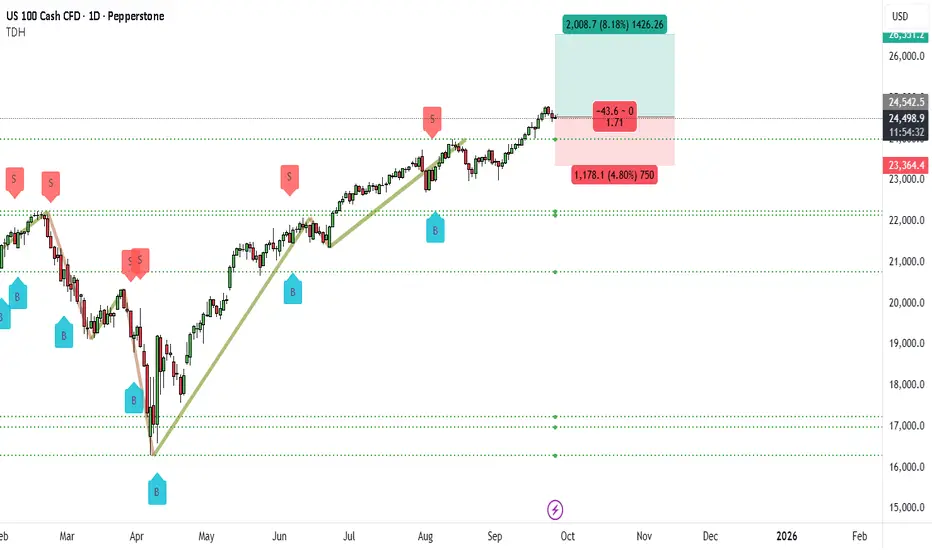
NAS100 Bullish Scenario, Will The Trend Be Followed?The US100 (NASDAQ) daily chart shows a very strong bullish structure. Since April, the index has been in a steady uptrend, creating higher highs and higher lows. Recently, price broke through the important 24,000 zone and is now consolidating just under 24,542. This consolidation at the highs is a healthy sign of strength, suggesting buyers are preparing for the next leg up.
The zone between 24,000 and 24,200 is now a major support base. As long as the market holds above this region, the bullish outlook remains intact. The next major target sits near 26,551, which lines up with an 8% projected upside move. Momentum remains with the bulls, and dips toward support are likely to be bought up quickly.
📌 Trade Setup (Bullish)
• Entry: 24,500 (current market or on breakout above 24,542)
• Stop-Loss: 23,364
• Take-Profit: 26,551
• Risk/Reward: ~1:1.7
NAS100 ShortElite Analysis
Price accumulation
Asian liquidity was taken out
Price action in lower time frames read as bearish
Targeting lower liquidity pools

NAS100Success in forex and stocks comes from a combination of knowledge, discipline, and patience. Understanding market trends, economic factors, and company
fundamentals is crucial, but equally important is controlling emotions and sticking to a well-planned strategy. Continuous learning, adapting to changing conditions, and managing risk wisely can turn opportunities into consistent growth over time.
Consistency, not luck, separates successful traders from the rest.

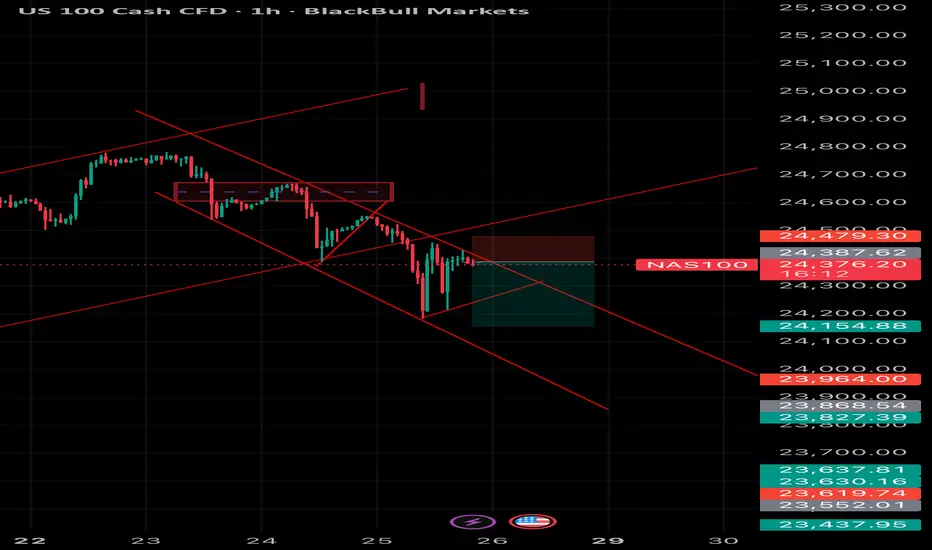
NAS100 Technical Analysis 1 Hour Chart📉 NAS100 Technical Analysis (1H Chart)
NAS100 is trading around 24,374 and continues to respect a strong descending channel, signaling bearish momentum.
• Trend: Price rejected the previous supply zone (24,470 – 24,500) and failed to break above resistance, confirming sellers are still in control.
• Entry Zone: The retest of broken support turned resistance around 24,387 – 24,479 shows bearish rejection with downside continuation likely.
• Target Levels:
• First target: 24,154 (mid-channel support)
• Next target zone: 23,960 – 23,827 (lower channel support)
• Invalidation: A clean 1H close above 24,500 would invalidate this bearish structure and could trigger a corrective move higher.
👉 Short-term bias remains bearish while under 24,500 with room for continuation toward 24,150 – 23,900.
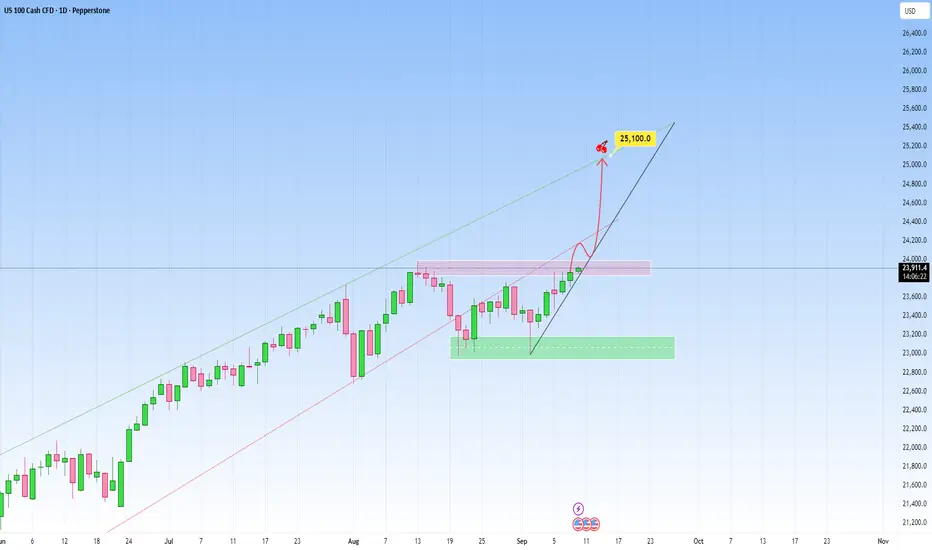
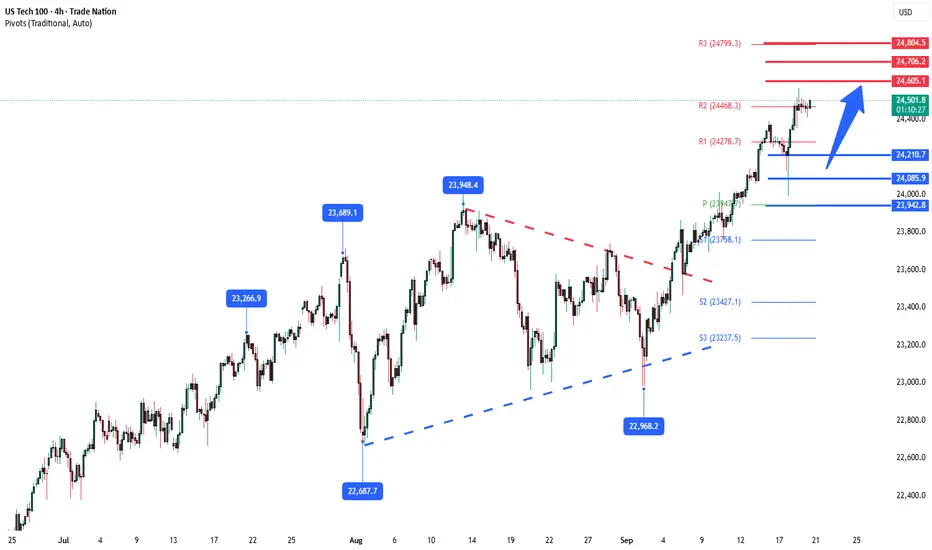
NAS100 Outlook: Recent rise has been steady!Market context on NAS100 remains bullish clearly. The most recent move saw a steady recovery, heading towards the upper boundary of the newly projected channel. And this right here is another great opportunity to get involved.
The market is likely in the early stages of a new impulsive leg to the upside right here.
We could also have short-term consolidation or pullback, then a continuation toward the upper boundary but I believe the latter is more plausible.
My target will be at 25,100.
NASDAQ | Diagonal resistance | GTradingmethodGood morning Traders,
I hope everyone has had a winning week so far :)
The US100 is sitting at a pivotal point. Price is currently at all-time highs but also testing two key diagonal resistance levels — one medium-term and one short-term. These resistance lines are intersecting right now, which adds extra weight to this resistance zone.
The big question:
👉 Will the US100 break through resistance and push higher into uncharted territory, or are we about to see a short-term correction from here?
📊 Trade Plan:
Not entering a trade just yet — waiting for confirmation of either a breakout with retest or rejection and reversal.
Very keen to hear what everyone thinks, let me know please :)
Peace
G

US100 – Bearish Pressure Below 24,768 | Targeting 24,600US100 is showing downside momentum after rejecting the 24,768 zone.
Bears are pushing price lower, with immediate support seen at 24,700.
A clean break below this level could extend the move toward 24,600, which is my near-term target.
If buyers manage to defend 24,700, a short-term bounce is possible, but overall sentiment remains weak.
👉 Do you expect US100 to hit 24,600 this week, or will bulls defend the zone? Share your thoughts below.

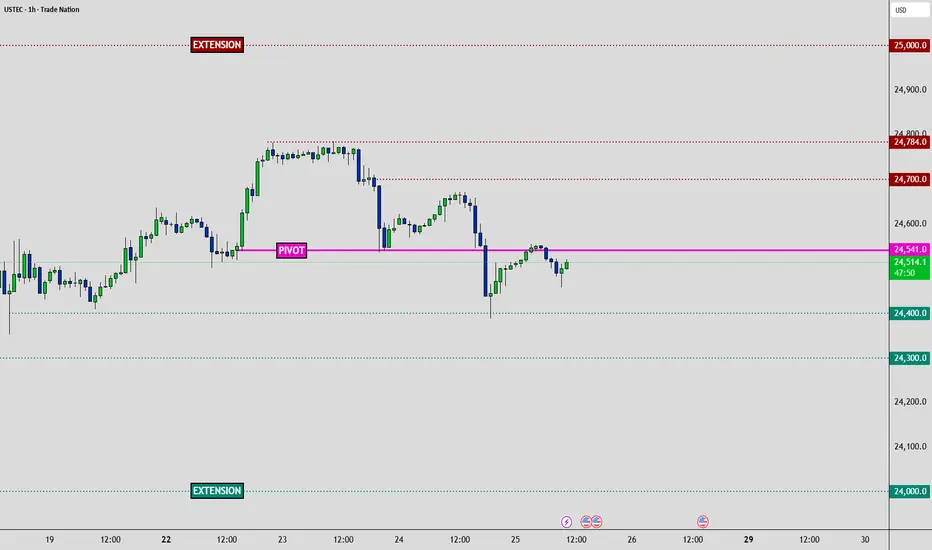
USTEC - 2 Day Traders Edge📈Technical:
MARKET BIAS: Neutral (consolidating at HVN pivot, high-rate sensitivity)
PIVOT ZONE: 24,541 (Exact HVN level)
🥇 Traders Edge - Actionable & Tactical
TRADE SETUPS:
🟧 Risk Warning: Core PCE surprise = 200+ point moves
🟧 Special Risk: High beta to rate moves via PCE
↕️ Bias Flip: Break below 24,400 (bearish) | above 24,700 (bullish)
🟢Long Setup:
• Entry above Pivot | Stop 24,450 | TP: 24,650 | 24,750 | 24,850 - Extended Breakout
🔴Short Setup:
• Entry below 24,400| Stop Above Pivot | TP: 24,300 | 24,000 - Extended Breakdown
🎯KEY LEVELS:
• Strong Resistance: 24,700 | 24,784
• Strong Support: 24,400 | 24,300 | 24,100 | 24,000
🎯PRICE TARGETS:
• Bullish Path: 24,700 → 24,784 → 25,000 (Extended breakout)
• Bearish Path: 24,400 → 24,300 → 24,000 (Extended breakdown)
🚨HIGH-IMPACT EVENTS (48H): (NY Time Zone)
• Sep 25 | 08:30 GDP Q2 Final: 3.3% vs -0.5% → Growth supports tech multiples
• Sep 26 | 08:30 Core PCE MoM: 0.2% vs 0.3% → TECH RATE SENSITIVITY
• Sep 26 | 08:30 Personal Spending: 0.5% vs 0.5% → Tech demand proxy
• Sep 26 | 10:00 Michigan Sentiment: 55.4 → Growth stock appetite
🛑 MASTER RISK EVENT
🟧Friday September 26 | 08:30 (NY Time Zone)
🟧 Core PCE Price Index (MoM) - Forecast: 0.2% vs Previous: 0.3%
🟧 Critical Impact: Fed's preferred inflation gauge determines rate path and USD strength
• Gold: Collapse risk if hot print
• Equities: Rate repricing volatility
• Sectors: Tech rotation sensitivity
⚠️ RISK MANAGEMENT PROTOCOL
• Reduce position sizes before Friday 08:30 EDT
• USD strength reversals impact Gold heavily
• Tech high beta to rate repricing
• Month-end flows amplify volatility
________________________________________
Analysis based on Session Volume POC clusters and HVN methodology
Nasdaq bullish trendThe Nasdaq trend is quite bullish, but we must be very cautious in selling positions and not take trades against the trend. The best ranges for buying MPLs have been identified.

NSDQ100 volatility, triple-witching could exaggerate swings.Nasdaq 100 Trading Drivers
Macro backdrop:
US data came in strong:
Jobless claims fell to 231k (vs. 240k exp; prior 264k).
Continuing claims declined to 1.92m (vs. 1.95m exp).
Philly Fed survey surged to 23.2 (vs. 1.7 exp), an 8-month high.
This eased US slowdown fears and reinforced risk-on sentiment.
Equities:
Nasdaq +0.94% → new record high.
Tech/semis led: Intel (+22.8%) strongest S&P performer after Nvidia’s $5bn investment and US gov’t stake news. Philadelphia Semiconductor Index +3.6%.
Momentum broadened → Russell 2000 +2.5%, first record high since 2021.
Rates:
Treasuries sold off on strong data → 10yr yield +1.7bps to 4.11%, 30yr +3.4bps. Higher yields a potential headwind if sustained.
Event risk:
Trump–Xi call (9 a.m. ET): key for TikTok’s US future & broader trade tone. Risk of mixed headlines given tensions (China soybeans skip, Gaza criticism, Taiwan aid freeze).
BoJ surprise: announced unwind of $4.2bn/year ETF holdings → dampened global risk tone.
US triple-witching: options/futures expiries today → elevated intraday volatility likely.
Nasdaq 100 Trading Takeaway
Bullish momentum intact: record highs fueled by tech & semiconductor leadership.
Short-term watchpoints: Trump–Xi headlines and BoJ shift may inject volatility; triple-witching could exaggerate swings.
Key risk: rising US yields may cap upside if bond sell-off deepens.
Bias: Still risk-on / buy dips near-term, but position sizing should account for headline-driven volatility today.
Key Support and Resistance Levels
Resistance Level 1: 24600
Resistance Level 2: 24710
Resistance Level 3: 24800
Support Level 1: 24210
Support Level 2: 24085
Support Level 3: 24940
This communication is for informational purposes only and should not be viewed as any form of recommendation as to a particular course of action or as investment advice. It is not intended as an offer or solicitation for the purchase or sale of any financial instrument or as an official confirmation of any transaction. Opinions, estimates and assumptions expressed herein are made as of the date of this communication and are subject to change without notice. This communication has been prepared based upon information, including market prices, data and other information, believed to be reliable; however, Trade Nation does not warrant its completeness or accuracy. All market prices and market data contained in or attached to this communication are indicative and subject to change without notice.
US NAS100Preferably suitable for scalping and accurate as long as you watch carefully the price action with the drawn areas.
With your likes and comments, you give me enough energy to provide the best analysis on an ongoing basis.
And if you needed any analysis that was not on the page, you can ask me with a comment or a personal message.
Enjoy Trading ;)

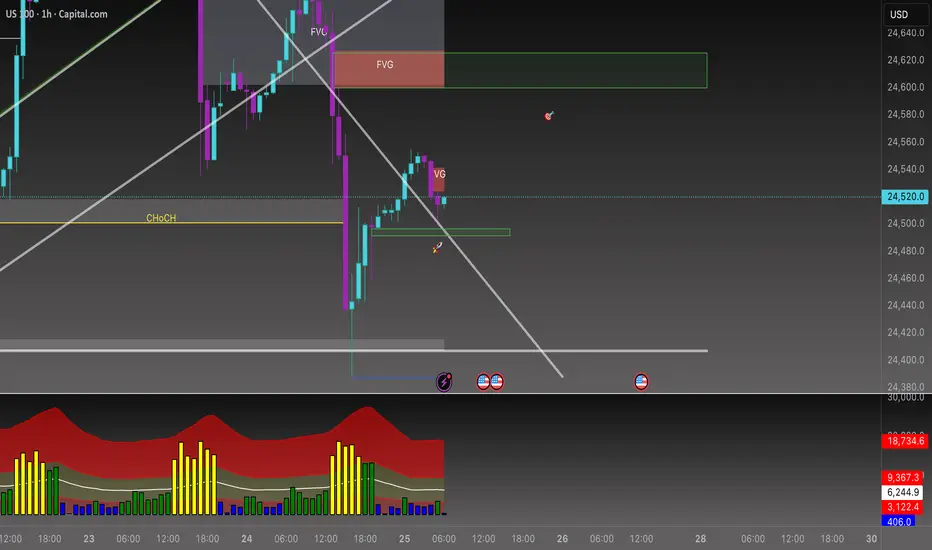
Beyond the Chart - NAS100 Through Technicals & FundamentalsNAS100 has just completed its move into the Discount PD Array zone I highlighted yesterday. On the 1H timeframe, I pointed out the prevailing bearish trend and marked this area as a key target. Once price tapped the zone, sellers lost momentum and buyers stepped in, shifting market control.
Now we’re seeing an inverse Z formation, with a Fair Value Gap (FVG) and a Breaker Block (BB) cutting across the structure. If buyers step in again, as they did in the earlier PD Array, my upside target will be 24,580.
NAS100 - Stock Market, After the Fed Meeting!The index is above the EMA200 and EMA50 on the one-hour timeframe and is in its long-term ascending channel. If the drawn ascending trend line holds, we can expect the continuation of its previous upward path, but in case of a valid break, its downward path will be smoothed to the indicated support area.
A week filled with significant events in global markets came to an end, with the Federal Reserve’s decision to cut interest rates by 25 basis points standing out as the most important development. Although this move temporarily boosted the U.S. dollar, it failed to reverse its multi-day downtrend. Fed Chair Jerome Powell sought to frame the decision as a “risk management” measure, but the dot plot indicated that policymakers hold a different outlook, keeping the possibility of further cuts by year-end alive.
Meanwhile, Paul Atkins, Chairman of the U.S. Securities and Exchange Commission (SEC), announced that in response to President Donald Trump’s request, he would propose a rule change to replace quarterly corporate reporting with semiannual reporting. In an interview with CNBC, he said this matter has been placed on the SEC’s immediate agenda. With Republicans holding a 3-1 majority on the commission, such a change could be approved by a simple majority vote. This move would disrupt the traditional reporting and disclosure cycle, making investors wait longer intervals for corporate financial information.
In a Truth Social post, Trump wrote: “This change will cut costs and allow executives to focus on running companies properly instead of worrying about quarterly reports.” He also added: “You’ve heard people say China takes a 50- to 100-year perspective on corporate management, yet we run our companies quarter by quarter. That’s not good at all!” Atkins stressed that the matter remains only a proposal for now and requires review, meaning it is not yet finalized. Significant lobbying efforts are expected around this issue.
Following a week dominated by central bank decisions, markets in the coming days will shift their attention to a wide range of inflation, industrial, and housing data. Alongside these releases, the speech of Steven Miran, the newly appointed Fed member, is set to be a pivotal moment for investors.
Monday will be packed with monetary policy remarks, with Andrew Bailey and Huw Pill from the Bank of England, Rogers and Kozicki from the Bank of Canada, and Williams, Musalem, Barkin, and Harker from the Fed scheduled to speak. Nevertheless, the spotlight will be on New York, where Miran will deliver a speech at the Economic Club at noon local time. Having consistently advocated for faster and deeper rate cuts, his comments are being watched closely by markets.
On Tuesday morning, the release of the preliminary S&P Global PMI for September will coincide with Jerome Powell’s first remarks following the recent FOMC meeting. A day later, U.S. new home sales data will be published.
Thursday will bring the Swiss National Bank’s monetary policy decision. At the same time, markets will receive final U.S. Q2 GDP figures, durable goods orders, weekly jobless claims, and existing home sales data.
The week will conclude on Friday morning with the release of the Personal Consumption Expenditures (PCE) price index for August, the Fed’s preferred inflation gauge. On the same day, the revised University of Michigan consumer sentiment survey for September will also be released, offering a fuller picture of consumer confidence.
Currently, many leading financial institutions expect further consecutive rate cuts in the Fed’s two remaining meetings of 2025. In this context, upcoming speeches from key Fed members could shape expectations. Markets are particularly focused on comments from Waller and Bowman, who previously opposed Miran’s proposal for a 50-basis-point cut. On the political side, it is anticipated that President Trump will once again direct sharp criticism at Powell, a factor that could weigh further on market sentiment.
Separately, Berkshire Hathaway, led by Warren Buffett, has fully exited its investment in Chinese automaker BYD, ending a 17-year-long position. The divestment followed a gradual reduction of shares starting in 2022, and according to Berkshire’s energy unit, the investment had fallen to zero value by the end of Q1 2025.
A company spokesperson confirmed that the position was fully closed. Meanwhile, BYD’s head of public relations expressed gratitude for Berkshire’s long-term support since 2008, noting that the ownership stake began shrinking in 2022 and fell below 5% by mid-2024. This investment is regarded as one of Berkshire’s most successful ventures in Asia.

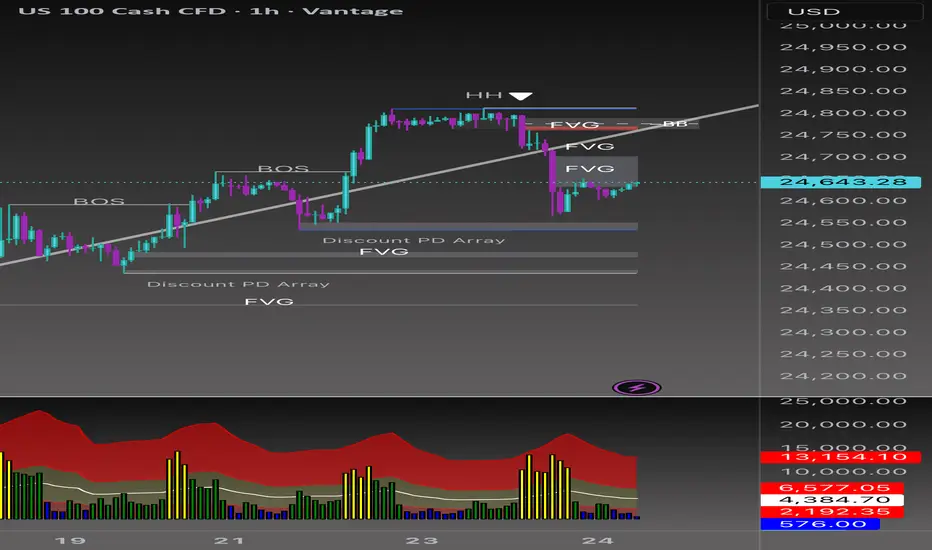
Beyond the Chart - NAS100 Through Technicals & Fundamentals📉 NAS100 VANTAGE:NAS100
Short Bias Analysis (1H Chart)
The market recently formed a Higher High (HH) followed by a Break of Structure (BOS) to the downside, suggesting a potential bearish shift. This move left behind multiple Fair Value Gaps (FVGs), now acting as supply zones.
Key Points
• Liquidity grab above the HH, followed by strong bearish momentum.
• Two FVGs aligning with short bias.
• Current retracement into inefficiencies offers a potential short entry.
• Downside targets: Discount PD Array and lower FVGs (24,480–24,440).
Trade Idea
• Entry Zone: 24,700–24,750 (upper FVG)
• Stop Loss (SL): Above 24,800 (invalidates bearish idea)
• Take Profit 1 (TP1): 24,560
• Take Profit 2 (TP2): 24,440
Risk management remains key 🔑 if price closes above the upper FVG/BB zone, short bias is invalidated.
NAS100 Buy Entry’s Clean, R:R 2.00 — Setup Locked & Loaded!Hey traders,
Here’s my NAS100 setup based on the 1-hour chart:
🟢 Buy Entry: 23998.77
🔴 Stop Loss: 23884.81
🎯 TP1: 24045.42
🎯 TP2: 24097.67
🎯 TP3: 24225.56
Risk/Reward Ratio: 2.00
Every like you drop is pure fuel for me to keep sharing these setups.
Big thanks to everyone standing by and showing support.

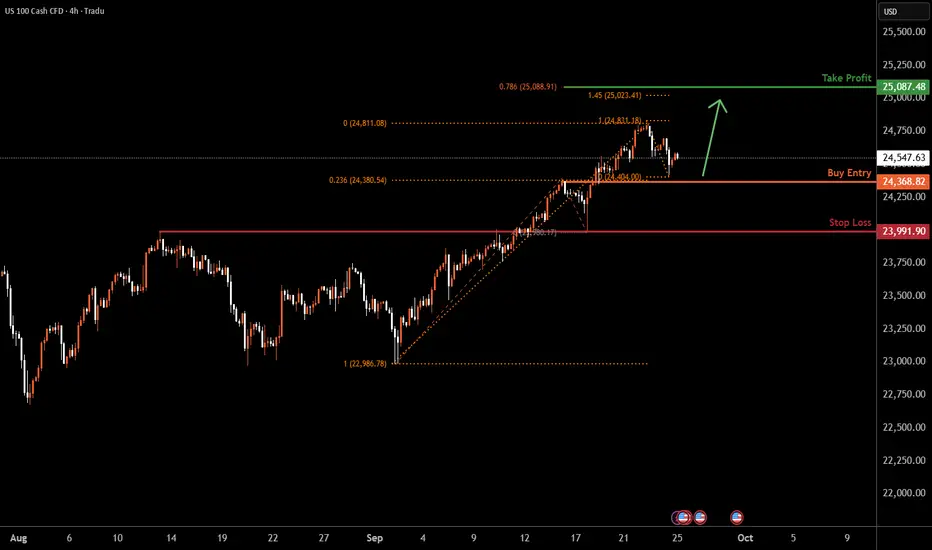
NAS100 H4 | Bullish momentum to extend?NAS100 is falling towards the buy entry at 24,368.82, which is a pullback support that aligns with the 23.6% Fibonacci retracement and could bounce from this level to the upside.
Stop loss is at 23,991.90, which is an overlap support.
Take profit is at 24,087.48, which aligns with the 78.6% Fibonacci projection and the 161.8% Fibonacci extension.
High Risk Investment Warning
Trading Forex/CFDs on margin carries a high level of risk and may not be suitable for all investors. Leverage can work against you.
Stratos Markets Limited (tradu.com ):
CFDs are complex instruments and come with a high risk of losing money rapidly due to leverage. 65% of retail investor accounts lose money when trading CFDs with this provider. You should consider whether you understand how CFDs work and whether you can afford to take the high risk of losing your money.
Stratos Europe Ltd (tradu.com ):
CFDs are complex instruments and come with a high risk of losing money rapidly due to leverage. 66% of retail investor accounts lose money when trading CFDs with this provider. You should consider whether you understand how CFDs work and whether you can afford to take the high risk of losing your money.
Stratos Global LLC (tradu.com ):
Losses can exceed deposits.
Please be advised that the information presented on TradingView is provided to Tradu (‘Company’, ‘we’) by a third-party provider (‘TFA Global Pte Ltd’). Please be reminded that you are solely responsible for the trading decisions on your account. There is a very high degree of risk involved in trading. Any information and/or content is intended entirely for research, educational and informational purposes only and does not constitute investment or consultation advice or investment strategy. The information is not tailored to the investment needs of any specific person and therefore does not involve a consideration of any of the investment objectives, financial situation or needs of any viewer that may receive it. Kindly also note that past performance is not a reliable indicator of future results. Actual results may differ materially from those anticipated in forward-looking or past performance statements. We assume no liability as to the accuracy or completeness of any of the information and/or content provided herein and the Company cannot be held responsible for any omission, mistake nor for any loss or damage including without limitation to any loss of profit which may arise from reliance on any information supplied by TFA Global Pte Ltd.
The speaker(s) is neither an employee, agent nor representative of Tradu and is therefore acting independently. The opinions given are their own, constitute general market commentary, and do not constitute the opinion or advice of Tradu or any form of personal or investment advice. Tradu neither endorses nor guarantees offerings of third-party speakers, nor is Tradu responsible for the content, veracity or opinions of third-party speakers, presenters or participants.
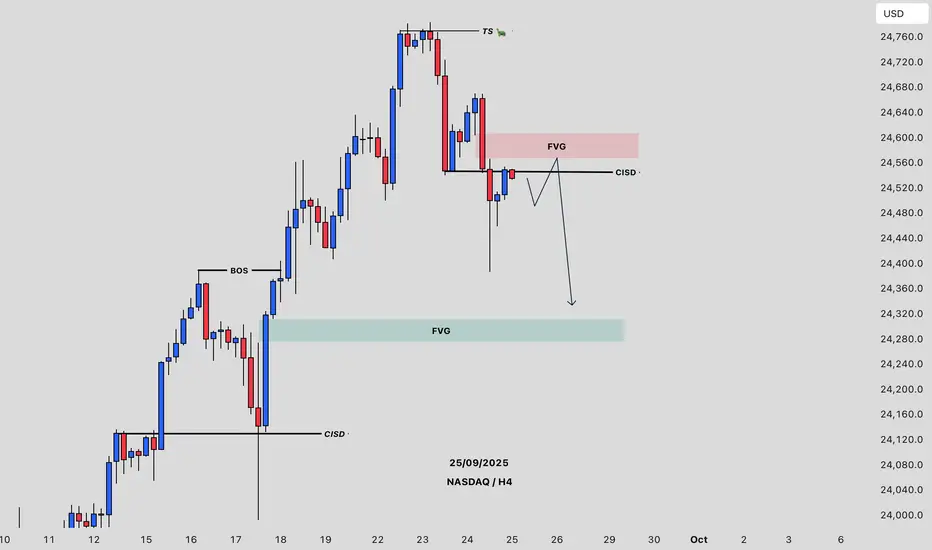
Nas100 Trade Set Up Sep 25 2025Price is clearing in a bearish trend now with price breaking PDL, SSL and daily FVG so i will look for sells from the 1h FVG towards lower SSL
www.tradingview.com

US100 Swing trade Sell position
Bearish pattern formed at the top.
Take-profit (TP) is defined on the chart.
If you wish to hold further, move stop-loss (SL) to breakeven.

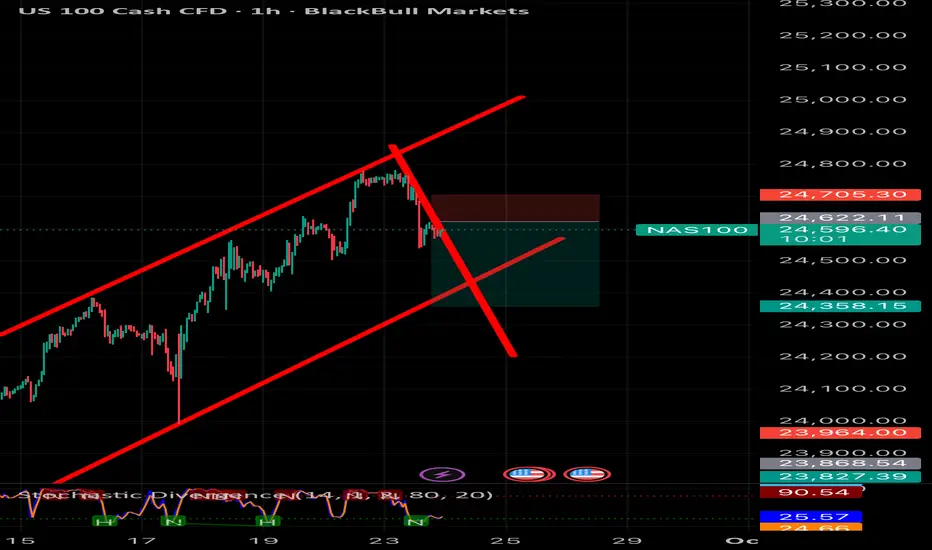
NAS100 rising wedge breakdown short setup The NAS100 recently broke down from a rising wedge formation on the 1H chart, signaling potential bearish momentum. After failing to hold above 24,700, price rejected the upper channel and is now trading below the wedge support.
Here’s my thought process:
• Pattern: Rising wedge, a bearish reversal pattern.
• Rejection Zone: Price failed at 24,705 resistance, confirming sellers stepped in.
• Breakdown Confirmation: A clean break below wedge support increases bearish bias.