NAS100 Technical Breakdown | Bearish Play in MotionWe're currently observing a strong 1H bearish imbalance (FVG) rejection zone that aligns perfectly with the recent 15m resistance block, leading to a swift rejection in price.
Price action has respected the HTF liquidity zones and is now following through on the anticipated drop towards 1H Support 📉.
The confluence of the descending momentum, HTFL levels, and FVG fill strengthens the case for continued bearish movement in the short term.
📌 Key Levels to Watch:
Resistance Zone: 24,940 – 24,975
Mid Support: 24,793 – 24,780
Major Support: 24,712 – 24,699 (potential liquidity sweep zone)
⚠️ Watch for reaction at the trendline and lower HTFL levels – they may offer a potential bounce or continuation setup depending on the momentum.
🧠 Trade Smart: Wait for confirmation before entering. Don't chase – let price come to your levels.
💬 What’s your bias on NAS100 this week? Drop your thoughts below! 🔽
Greetings,
MrYounity
US100 trade ideas

NAS100USD Technical AnalysisThe NAS100 has been in a strong bullish structure, creating higher highs and higher lows. After recently tapping 24,800.0 resistance, price rejected and is now pulling back toward the 24,583.1 area, which is acting as short-term support.
Support at: 24,583.1 🔽 / 24,393.3 🔽 / 24,099.2 🔽
Resistance at: 24,800.0 🔼
🔎 Bias:
🔼 Bullish: If buyers defend 24,583.1 and push price back toward 24,800.0, a breakout could open the way for continuation higher.
🔽 Bearish: A clean break below 24,583.1 exposes 24,393.3, and failure there could invite a deeper correction toward 24,099.2.
📛 Disclaimer: This is not financial advice. Trade at your own risk.

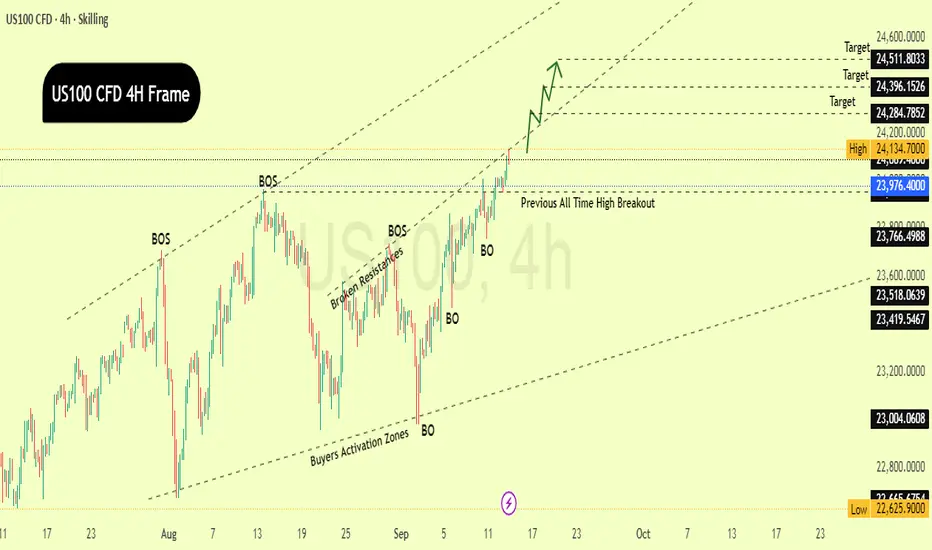
US100 Breaks All-Time High – Bullish Targets Ahead!This 4-hour chart of the US100 (Nasdaq) shows a strong bullish trend supported by multiple breakouts (BO) and break of structure (BOS) signals over the past few weeks. After retesting and bouncing from key buyer activation zones, the price has consistently broken through previous resistance levels.
Most notably, the index has just broken above its previous all-time high around 23,976, signaling strong momentum and potential for further upside. The price is currently hovering near 24,089, with key short-term targets marked at:
Target : $24,284
Target : $24,396
Target : $24,511
These targets align with the upper boundary of a rising parallel channel, suggesting the bulls are in control for now.
The chart projects a continuation of this bullish move, with a stair-step rally expected if the current breakout holds. As long as the price stays above the breakout zone and respects the structure, the upside targets remain in play.
In short: US100 is showing solid bullish strength, breaking above its previous highs with clear upside potential.
Educational Idea.

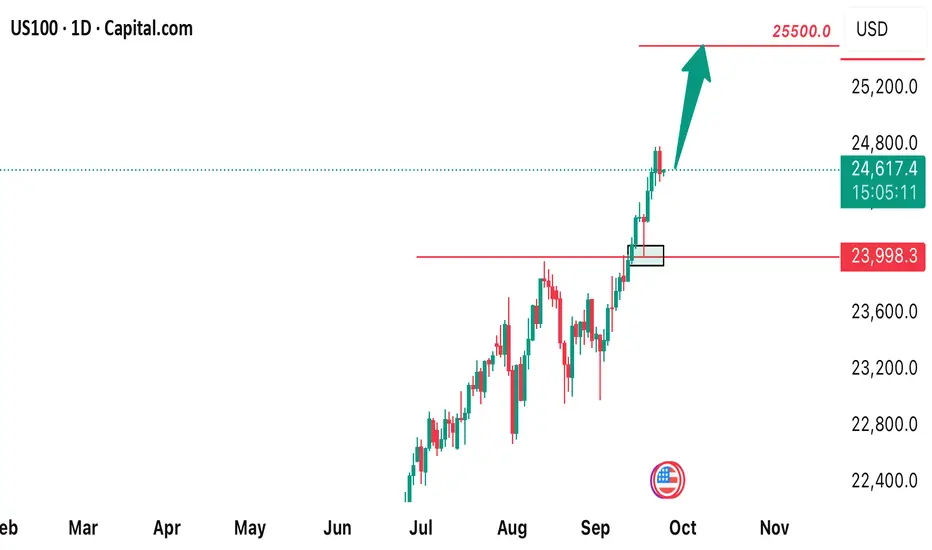
US100 BULLISH CONTINUATION IDEAWe’re currently on a strong bullish trend! We are continuing to long this pair till it get to all time high price of 25500 that’s our overall buy target. Opt in for a buy and take advantage of this opportunity!
NAS100Nasdaq-100 (NAS100) Performance on September Options Expiration Days (2015–2024)
Based on historical data for the Invesco QQQ ETF (which tracks the Nasdaq-100), below is the daily performance on the third Friday of September each year—the standard options expiration day. The result is "Rise" if the closing price increased from the previous trading day's close, or "Fall" if it decreased. Data is sourced from reliable financial records, including adjusted closing prices.
- 2015: Fall (-0.45%)
- 2016: Rise (+0.32%)
- 2017: Rise (+0.62%)
- 2018: Fall (-0.20%)
- 2019: Rise (+0.11%)
- 2020: Fall (-1.18%)
- 2021: Fall (-1.25%)
- 2022: Fall (-1.69%)
- 2023: Fall (-1.13%)
- 2024: Fall (-0.19%)

Buy Nas100Nas is bullish and will continue buying. There are two possible buy entries, being the demand zone, or the liquidity grab zone. Do not enter a trade on the demand zone unless there is another confirmation on lower time frames. Remember it is Friday tomorrow, and the market can be very manipulative on Friday. Do not force trades, there is nothing wrong with not having a trading day. Trade what you see, and not what you feel.

NAS100 longits broke weekly resistance and i think its going to go up from this current price, since its the stockmarket the tp is high cause of how it moves. long term swing.

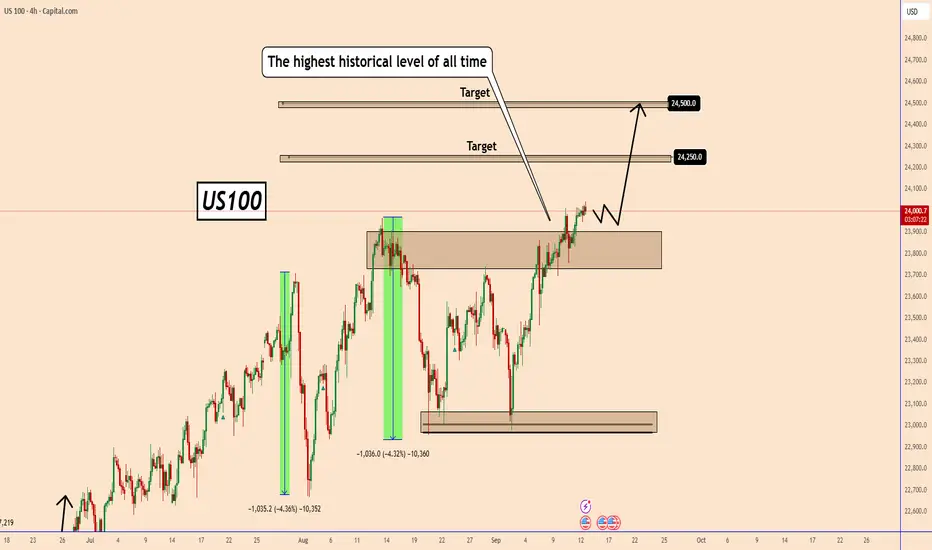
US100 Hits All-Time HighUS100 Hits All-Time High
Yesterday, US100 reached a new record high at 24040, confirming the strength of its bullish trend.
With U.S. inflation cooling, the market is now expecting the Federal Reserve to cut interest rates, possibly starting this cycle and continuing in the months ahead.
Lower rates tend to support stocks and indices, giving the economy room to breathe after a long period of tight monetary policy.
I expect US100 to continue rising toward 24500, with intermediate targets at 24250 and 24500 in the coming week.
You may find more details in the chart!
Thank you and Good Luck!
❤️PS: Please support with a like or comment if you find this analysis useful for your trading day❤️

Short term idea for NAS100Simplicity is the best, I am using any complicated way of trade. Just draw some lines and do the trade.


NSDQ100 awaits Fed rate decision supported at 23940Nasdaq 100 Trading Takeaways
Fed in focus: Markets expect a 25bp cut today, though risks of larger/smaller moves exist with potential dissents on both dovish and hawkish sides. Trump’s newly sworn-in appointee Miran may push for 50bp, while Schmid could dissent hawkishly. This adds event risk and volatility for tech stocks.
Macro backdrop: Trump state visit to the UK highlights investment pledges and a potential US-UK tech partnership, which could support sentiment in large-cap tech.
Market moves:
S&P 500 (-0.13%) pulled back from record highs.
Nasdaq leadership held firm: Magnificent 7 (+0.55%) hit a new record, showing resilience even as breadth weakened.
Broader weakness evident – third straight day of more decliners than advancers.
Sector divergence: Energy (+1.73%) outperformed on higher Brent crude (+1.53%), but tech still provided upside leadership.
Implication for Nasdaq 100:
Short-term: Expect heightened sensitivity to Fed outcome – dovish signals/50bp risk would boost mega-cap tech, while hawkish dissent could trigger profit-taking.
Medium-term: Tech remains the relative outperformer, with new highs in the Magnificent 7 signaling continued defensive growth positioning despite weaker breadth.
Key Support and Resistance Levels
Resistance Level 1: 24470
Resistance Level 2: 24600
Resistance Level 3: 24800
Support Level 1: 23940
Support Level 2: 23760
Support Level 3: 23430
This communication is for informational purposes only and should not be viewed as any form of recommendation as to a particular course of action or as investment advice. It is not intended as an offer or solicitation for the purchase or sale of any financial instrument or as an official confirmation of any transaction. Opinions, estimates and assumptions expressed herein are made as of the date of this communication and are subject to change without notice. This communication has been prepared based upon information, including market prices, data and other information, believed to be reliable; however, Trade Nation does not warrant its completeness or accuracy. All market prices and market data contained in or attached to this communication are indicative and subject to change without notice.

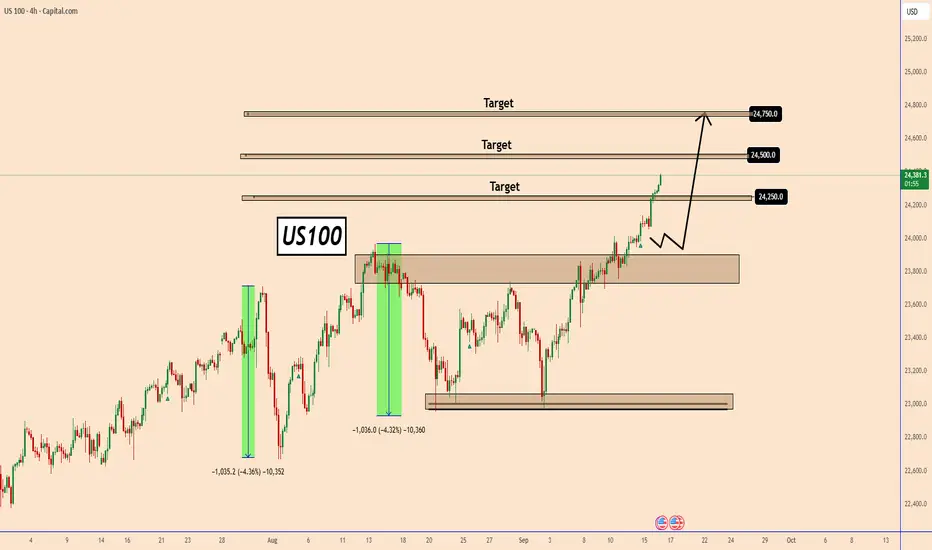
US100 Rally Supported by Fed Expectations and Cooling InflationUS100 Rally Supported by Fed Expectations and Cooling Inflation
From our last analysis, indices have continued to rise. The US100 already hit the first target and is now close to the second one.
With the market expecting multiple Fed rate cuts this year, bullish momentum stays strong and shows no clear signs of reversal.
This outlook is also backed by easing inflation data. Still, we should be cautious — since the move has already played out, it may be wise to secure profits before the FOMC meeting.
The US100 could rise further once the outlook becomes clearer, but it may also take some time before reaching new highs.
Next targets: 24,500 and 24,750.
You may find more details in the chart!
Thank you and Good Luck!
❤️PS: Please support with a like or comment if you find this analysis useful for your trading day❤️
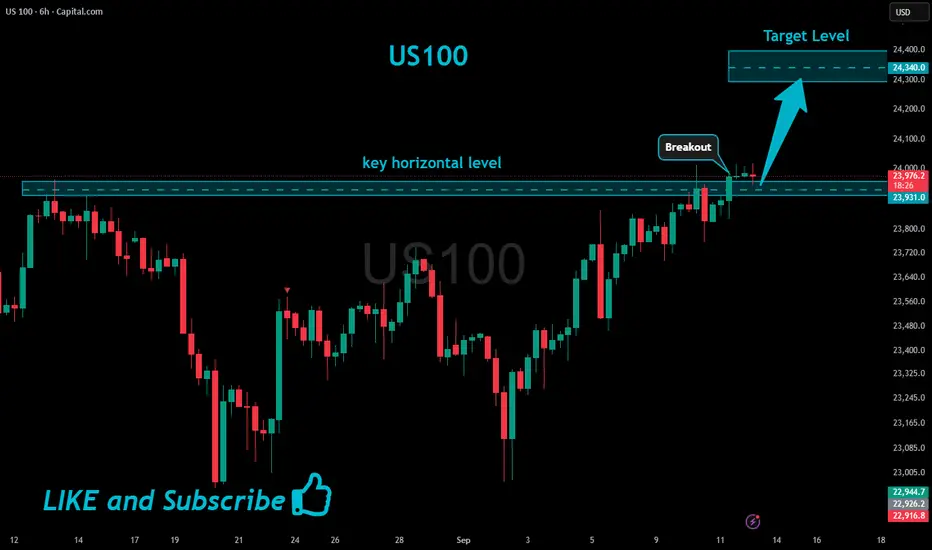
US100 Will Keep Growing!
HI,Traders !
#US100 is trading in an
Uptrend and the index broke
The key horizontal level
Around 23931.0 and the
Breakout is confirmed so
We are bullish biased
And we will be expecting a
Further bullish move up !
Comment and subscribe to help us grow !
NAs100 ShortElite Analysis
Confirmation met
Price reacting off structural liquidity
Targeting lower liquidity pools

3rd Short term trade with NASDAQAfter two consecutive profits on the NASDAQ, I hope this third trade will also yield satisfactory result. A good risk-reward ratio is crucial in trading.

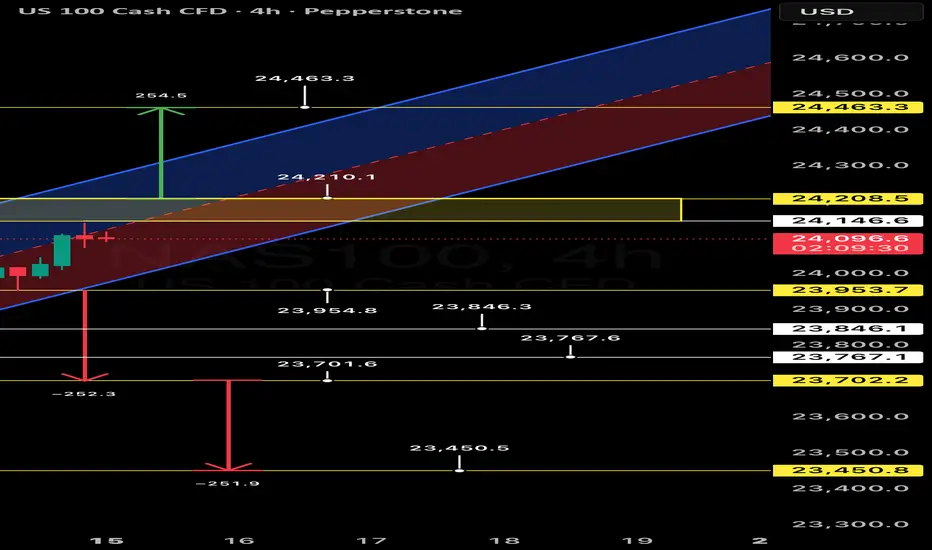
NASDAQ 100: A Tipping Point on the 4H ChartKey Takeaway
NASDAQ 100 (NAS100) is at a critical juncture, hovering at a potential inflection point around the 24,000 level. A clear breakout above or breakdown below this psychological and technical area will likely dictate the next major move for the index, presenting distinct opportunities for both bulls and bears.
Macro View
NASDAQ 100 has been in a strong rising trend channel for the medium to long term, indicating persistent investor optimism. The overall technical outlook remains positive. However, recent price action on the 4hour chart suggests a period of indecision, with the index consolidating just below its recent highs. This consolidation, combined with the emergence of a potential head and shoulders pattern, signals that a significant move is imminent.
Bearish Outlook: A Breakdown Scenario
A breakdown below the key support level at 23,800 would be a significant bearish signal. This level is crucial as it marks the lower boundary of the current consolidation zone.
• Target 1: 23,700 A move below the first key support could quickly see the index test the 23,700 level, which has acted as a previous point of interest.
• Target 2: 23,450 A break of the 23,700 support would confirm a deeper correction, with the next major target being 23,450. This level coincides with a significant volume node and previous support, making it a strong magnet for price.
Risk Management: A stoploss should be placed just above the resistance to mitigate risk in a false breakdown.
Bullish Outlook: A Breakout Scenario
The bullish case is contingent on the index successfully holding the 24,000 psychological level and breaking above the key resistance at 24,208.5.
• Target 1: 24,463 A confirmed breakout would likely propel the index toward the upper boundary of the rising channel, with a primary target of 24,463. This level represents a key extension of the current trend.
• Target 2: 24,600 A decisive move beyond 24,463 would suggest a continuation of the bullish momentum, with a secondary target at 24,600. This level aligns with a major extension and could see the index set new all-time highs.
Risk Management: A stop loss should be placed just below the support to protect against a trend reversal.
Conclusion
NASDAQ 100 is at a pivotal moment. Traders should watch for a clear break in either direction before entering a position. The 24,000 level is a critical pivot, and the ensuing price action will provide a clear roadmap for the market's next move.
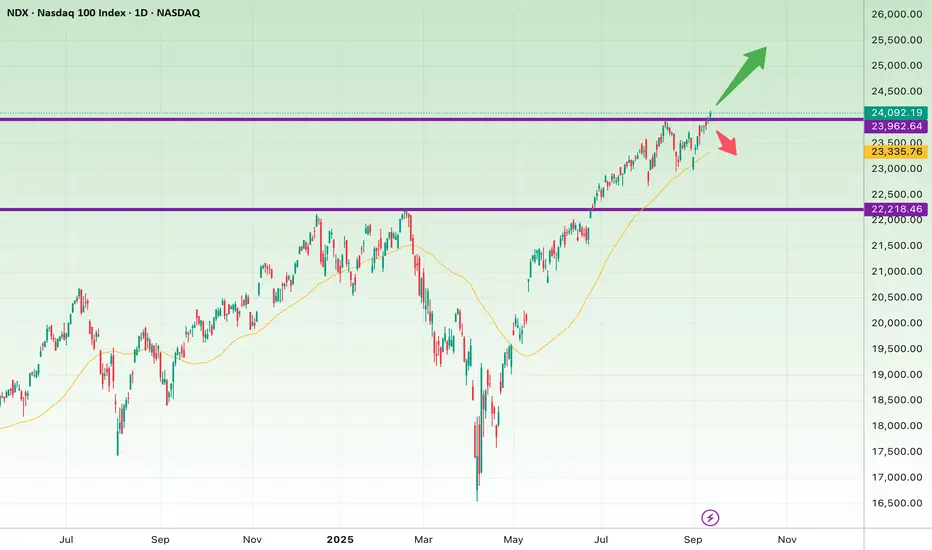
Professional Analysis of Nasdaq 100 Index (NDX) – Daily Timefram
The NDX chart shows that after a strong rally from the 22,200 support zone, the index is now testing a key resistance around 23,950 – 24,100.
Bullish Scenario:
If the daily or weekly candle closes firmly above 24,100, the path opens toward 24,800 – 25,000. Breaking this resistance could trigger a new wave of buying momentum.
Bearish Scenario:
If the index fails to break higher and sellers step in, we may see a pullback toward 23,500 and possibly 22,200.
The 50-day moving average (yellow line) near 23,300 – 23,400 will act as an important mid-term support.
Conclusion:
The market is at a decisive turning point. A breakout above 24,100 signals continuation of the bull run, while rejection here could trigger a deeper correction.
USNAS100 Braces for Fed Decision – Key Pivot at 24,300USNAS100 – Overview
The Nasdaq is set for a highly volatile session as markets await the Federal Reserve’s rate decision later today.
Traders widely expect a 25 bps cut, but a surprise 50 bps cut—though less likely—would signal stronger confidence in stable inflation and U.S. economic health, fueling a strong bullish rally.
Even if the Fed delivers the expected 25 bps cut, the key market mover will be Chair Powell’s press conference and the updated dot plot, which could reshape expectations for future easing.
Technical Outlook
📉 Bearish scenario
While trading below 24,300, price shows potential for a pullback toward 24,115.
A confirmed break below 24,115 would extend the bearish move toward 23,870 → 23,700.
📈 Bullish scenario
Stabilization above 24,115 keeps the broader uptrend intact.
A breakout above 24,300 would confirm bullish momentum, targeting 24,550 → 24,700 → 24,850.
📌 Market Context:
50 bps cut + dovish Powell → strong bullish breakout above 24,300 toward 24,550+.
25 bps cut + cautious guidance → moderate moves; price may remain range-bound or retest 24,115 before resuming higher.
Hawkish tone → deeper correction toward 23,870 or lower.
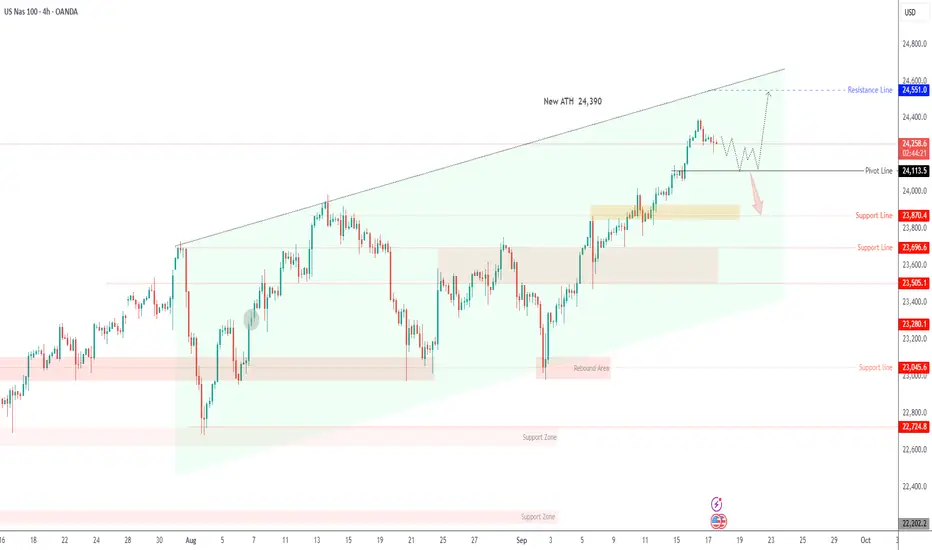
Nasdaq 100 Eyes 24,550–25,050 if Fed Signals Dovish ToneUSNAS100 – Technical Overview
The Nasdaq remains in focus as traders await the Federal Reserve’s rate decision later this week.
Markets largely expect a 25 bps cut, but the key driver will be Chair Powell’s tone on inflation, labor-market weakness, and tariff risks.
Earlier record highs across U.S. indexes were fueled by tech strength and optimism over U.S.–China trade talks, while gold’s surge to new highs underscores strong safe-haven demand.
Technical Outlook
📉 Correction phase
Price is expected to retest 24,240 → 24,115 before attempting another bullish leg.
A sustained drop below 24,110 would expose deeper support at 23,870.
📈 Bullish continuation
Holding above 24,240 – 24,115 keeps the broader uptrend intact.
Once consolidation is complete, a renewed rally targets 24,550 → 24,800, with a potential extension to 25,050 if the Fed delivers a more dovish message.
Key Levels
Pivot: 24,380
Resistance: 24,550 – 24,800 – 25,050
Support: 24,240 – 24,115 – 23,870
📌 Market Context:
A 25 bps Fed cut may offer moderate support for tech-heavy indices, while a more aggressive 50 bps cut could accelerate the next breakout toward fresh ATHs. Conversely, a hawkish tone from Powell could trigger a deeper correction before the next leg higher.

US NAS 100Preferably suitable for scalping and accurate as long as you watch carefully the price action with the drawn areas.
With your likes and comments, you give me enough energy to provide the best analysis on an ongoing basis.
And if you needed any analysis that was not on the page, you can ask me with a comment or a personal message.
Enjoy Trading ;)

US NAS100Preferably suitable for scalping and accurate as long as you watch carefully the price action with the drawn areas.
With your likes and comments, you give me enough energy to provide the best analysis on an ongoing basis.
And if you needed any analysis that was not on the page, you can ask me with a comment or a personal message.
Enjoy Trading ;)
