NAS100 Pullback into Fibonacci Zone: Watching for Bullish Break📊 NASDAQ 100 (NAS100) Update 📊
The NAS100 is in a strong bullish trend 🟢📈, clearly visible on the 4H chart ⏰ with consistent higher highs and higher lows 🔼🔼.
Currently, price has pulled back 🔽 right into my optimal entry zone 🎯 based on the Fibonacci retracement 🔢. From here, I’ll be watching closely for a bullish break of structure (BOS) 🔓 on the 15M timeframe ⏰ — that would be my signal to look for a long entry 🚀.
⚠️ This breakdown is educational only and not financial advice. 📚
US100 trade ideas

NDX SHORT 1HHarmonic Bearish Divergence at D Point.
Expeting it will break its HL and make start printing few LL LH

NAs100 ShortElite Analysis
Confirmation met
Price reacting off structural liquidity
Targeting lower liquidity pools

NASDAQ INDEX (US100): To the New Highs!
US100 index successfully broke and closed above a major
daily resistance cluster on Friday.
The index will likely grow more and reach new highs soon.
The next resistance is 24300
❤️Please, support my work with like, thank you!❤️
I am part of Trade Nation's Influencer program and receive a monthly fee for using their TradingView charts in my analysis.

Futures steady ahead of Fed cutFutures steady ahead of Fed cut
U.S. stock futures held flat on August 15 ahead of the Sept. 17–18 Fed meeting, where a 25-bps cut is widely expected. Markets price about 70 bps of easing by year-end, though Powell may highlight inflation risks to temper dovish bets. Retail sales Tuesday will be the last key data before the decision.
Global markets were subdued: oil ticked higher on Ukraine-Russia tensions, the dollar eased, and Asian stocks firmed with South Korea’s Kospi hitting records. The Bank of Canada may also cut this week, while the BoE and BoJ are likely to stay on hold.
Traders are watching today’s Empire State manufacturing survey (8:30 AM EDT), the Senate vote on Fed nominee Stephen Miran, speeches from ECB’s Lagarde and Schnabel, and EU Council President Costa’s visit to Cyprus ahead of its 2026 presidency.
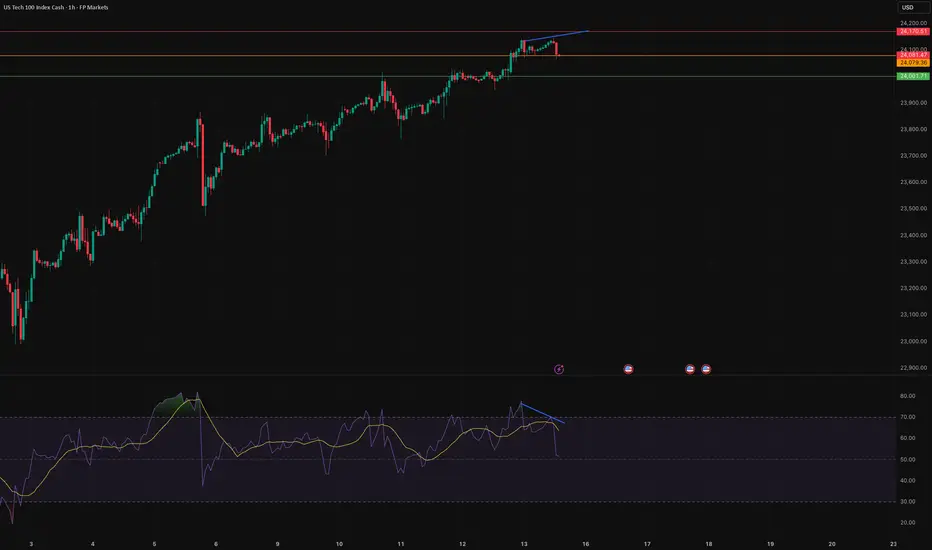
US100 Bearish reversalUS100 BEARISH REVERSAL
There is a divergence at 1H TF and now big juicy red candle has confirmed it so we might see some selling pressure.
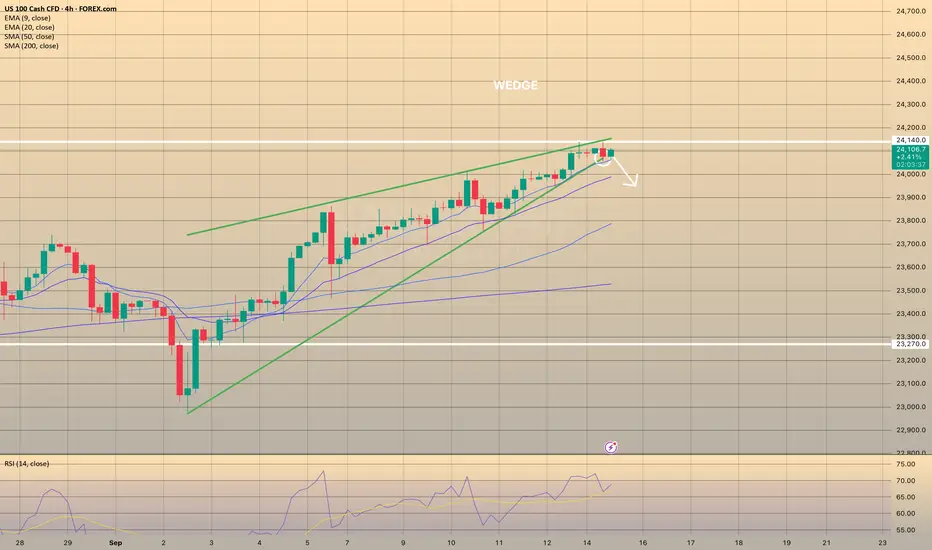
NAS100 - Stock market awaits Federal Reserve meeting!The indicator is above the EMA200 and EMA50 on the one-hour timeframe and is in its long-term ascending channel. If the drawn upward trajectory is maintained, I can expect the future to continue as it has in the past. In case of a valid breakdown, its downward path is to the specified range, which can be approached with a reward for buying.
Last week’s economic data painted a mixed picture of the U.S. economy. On the one hand, new jobless claims rose to 263,000, above the market forecast of 235,000, signaling labor market weakness. On the other hand, the August inflation report came in hotter than expected, though most of the increase stemmed from housing costs rather than tariff pressures. Rents rose 0.34%, marking the fastest gain since December 2024, while shelter costs climbed 0.39%, the sharpest jump since January 2025. Still, real-time housing indicators suggest that prices are adjusting, which will likely be reflected in official data in the coming months.
Meanwhile, the yield on the U.S. 10-year Treasury fell below 4% for the first time since April—a sign that markets are reacting more to labor market weakness and the prospect of Fed rate cuts than to inflation concerns.
CIBC, analyzing the August Consumer Price Index (CPI) report, stated that while the data came in slightly above expectations, it was not strong enough to dissuade the Federal Open Market Committee (FOMC) from delivering a 25-basis-point cut next week. Ali Jafari, an economist at the bank, wrote: “There was little in the report to prevent a September rate cut. More importantly, the labor market needs support, and a weaker jobs market implies softer demand-side inflationary pressures ahead.”
On a yearly basis, core inflation held steady at 3.1%, while headline inflation rose two-tenths to 2.9%, both in line with forecasts. More troubling, however, are signs that price increases are spreading into new sectors. The report noted: “Tariff pass-through effects intensified this month, with core goods prices rising at the fastest pace since broad tariffs were imposed. Today’s report also showed the first notable increase in new car prices, suggesting that tariff impacts may now be extending to higher-ticket items, though overall car price gains remain modest.”
CIBC expects the Fed to cut rates in September and October, pause afterward, and then deliver two additional cuts in the first half of next year. The bank added: “The overall U.S. inflation picture remains notably above target, but the Fed is willing to tolerate this for now, given growing concerns about a weakening economy and a labor market showing signs of fatigue.”
Separately, U.S. President Donald Trump once again criticized the Fed in an interview with Fox News, saying the central bank “always acts late on interest rates.” He added: “We have the best stock market in history. Inflation has come down, equities are climbing, so rates should be lower.”
These comments come as the Fed is widely expected to cut rates at Wednesday’s meeting. While such a move could reduce borrowing costs in the short term, analysts caution that lower short-term rates do not necessarily translate into lower long-term yields.
Morgan Stanley now projects that the Fed will cut rates by 25 basis points at each of the three remaining meetings this year—an upgrade from earlier forecasts of only September and December cuts. The bank also expects three additional 25-basis-point cuts in January, April, and July of 2026.
At the same time, Standard Chartered has revised its outlook and now anticipates a 50-basis-point cut in September—double its previous forecast. The shift followed weak August jobs data showing employment growth had slowed sharply and unemployment rose to 4.3%, the highest since late 2020. The bank described labor market conditions as “dramatic,” noting that in just six weeks the market shifted from “strong” to “weak.” It characterized the larger cut as a form of “catch-up” to align monetary policy with economic realities.
This week is set to be pivotal for global markets, with a series of central bank decisions and key economic releases. Monday will see the Empire State manufacturing index, followed by Tuesday’s August retail sales report. On Wednesday, housing starts and building permits will be released, along with the Bank of Canada’s rate decision. The highlight of the week, however, will be the Fed meeting and Jerome Powell’s press conference.
On Thursday, the Bank of England will announce its policy decision, followed by U.S. jobless claims and the Philadelphia Fed manufacturing survey. The busy week will conclude Friday with the Bank of Japan’s policy announcement.

Downtrend Analysisafter we get a retest back to the new all time highs this is one of the set ups I can see setting up on nas. In order for us to confirm the sells I am interested in looking for lower high entries only as we start to make the retest back to the main higher low from last week which is at 23986. im expecting a full retest here due to the federal fund rates

NAS100 Breakout – Eyeing New HighsPrice is breaking out of range. Aggressive: retest of range top toward trend line. Conservative: deeper pullback to 50% of range with stops outside.

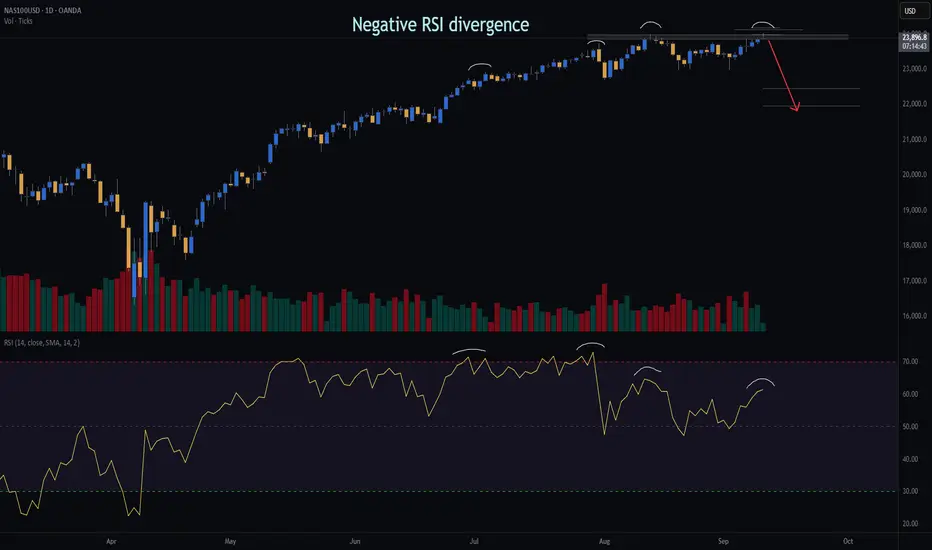
NASDAQ | Daily Double Top | GTradingMethodHello Traders 👋
🧐 Market Overview:
I’ve opened a short on the NASDAQ based on a clear double top setup that formed yesterday. Several of my key variables aligned, giving this trade a high-probability edge:
Negative RSI divergence → showing weakening buying momentum
Lower volume on the second top → indicating exhaustion
Daily candle closure within threshold → confirming structure validity
📊 Trade Plan:
RR: 9.1
Entry: 23 931
Stop Loss: 23 178
Take Profit 1 (50%): 22 453
Take Profit 2 (50%): 21 969
💡 GTradingMethod Tip:
When trading reversal patterns like double tops, I always wait for confirmation across multiple variables (momentum, volume, candle structure). This increases probability and reduces false entries.
🙏 Thanks for checking out my post!
Follow me for more setups and let me know — do you see this double top holding, or is there more upside left in the NASDAQ?
📌 Disclaimer:
This is not financial advice. This content is to track my trading journey and for educational purposes only.
buy nas100Nothing much to say, just buy nas100 and close trade 10 minute before market closes tonight

NASDAQ | H2 Double Top | GTradingMethodHello Traders! 👋
🧐 Market Overview:
CPI is out today — and it could be the spark the NASDAQ needs. Price is stalling at the previous all-time high, and that’s where I’m watching closely.
I’ve been tracking a double top on the daily for a while now, and today the H2 chart is starting to show the same structure. That kind of multi-timeframe alignment doesn’t happen often.
📊 Trade Plan:
I’ve entered a starter short on the daily structure. If the H2 confirms, I’ll scale in with a second position.
Risk/Reward:
Entry:
Stop Loss:
Take Profit 1 (50%):
Take Profit 2 (50%):
💡 GTradingMethod Tip:
Double tops work best when paired with other signals. In my system, I look for:
- RSI negative divergence
- Lower volume on the second top
- A confirmation candle close within my entry range
This reduces false signals and adds conviction.
🙏 Thanks for reading! Do you trade double tops?
📌 Disclaimer:
This is not financial advice. This content is to track my trading journey and for educational purposes only.

NAS100 Buy Setup – Sept 12, 2025🚀
Tapped 4H POI 🔑 + weak rejections 📉 = buyers stepping in 💪.
Looking for buys above 23,985 → targets 24,000+ 🎯📈

Nasdaq Eyes 24,240 ATH as PPI LoomsUSNAS100 – Overview
The Nasdaq 100 maintained bullish momentum, retesting support at 23,695 before pushing higher again.
Technical Outlook:
📈 As long as price trades above the 23,870 pivot, bullish momentum is expected to continue toward a new ATH at 24,090 → 24,240.
📉 If the PPI release comes in hotter than expected, it may weigh on the index. A confirmed stabilization below 23,860 would open the way for a pullback toward 23,690.
Key Levels:
Pivot: 23,870
Resistance: 24,090 – 24,240
Support: 23,695 – 23,510
Bias: Bullish above 23,870; bearish correction only if price stabilizes below 23,860, with deeper downside toward 23,690

Beyond the Chart - NAS100 Through Technicals & FundamentalsCAPITALCOM:US100 Update 📉
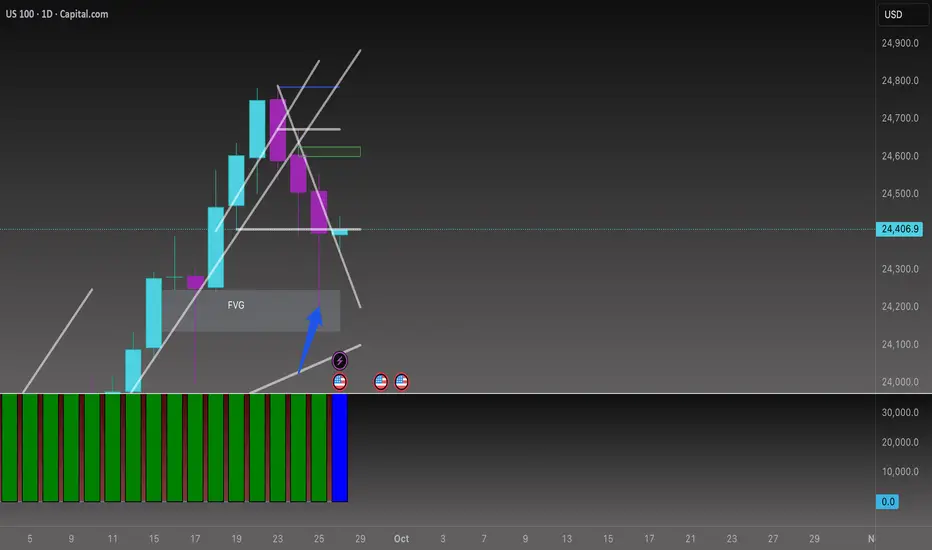
The trendline I drew yesterday played out perfectly. After the Bearish FVG + rejection, the trend broke and a second Bearish FVG formed right after.
NASDAQ Daily Analysis 📊
On the daily chart, the FVG formed on Sep 15th has been revisited, but price couldn’t hold in this zone and was quickly rejected. The trendline I’ve drawn is still active and guiding the move.
👉 If a bullish candle forms above the trend, I’ll be looking at 24,543 as a buy point.
👉 If sellers take control and push price below the trend, we could see a move down toward the FVG region at 24,340.
⚡Bottom line:
• If Core PCE cools off → bullish continuation fits.
• If Core PCE runs hot → expect sellers to take control.
Nas100 Trading ZonesZone 1 – Shallow Overhead Supply
This area has acted as resistance, but with limited data at all-time highs, its reliability is questionable. Sellers may step in here, yet it should be treated as a soft reference point rather than a strong supply zone. Any breakout could easily invalidate it.
Zone 2 – Fragile Support / Momentum Pivot
This level has shown price reactions, but lacks the characteristics of a strong buy zone. It’s better viewed as a short-term pivot area. If broken, it could attract further selling pressure, but traders should avoid relying on it as solid support.
Zone 3 – Yesterday’s Low / Liquidity Pocket
Yesterday’s low provides a natural liquidity zone where buyers may attempt to step in. Still, the strength of this level is limited. Reactions may be sharp but unstable, and a clean break lower could fuel further downside momentum.
The sharp pullback in the Nas100 yesterday looks to be driven by profit-taking after the Fed’s rate cut, combined with Powell’s cautious tone on inflation and growth. With the index trading at record highs, volatility was elevated and many traders used the news as an opportunity to lock in gains. For now, the move appears more like a healthy correction within an uptrend, but key support zones will need to hold to prevent a deeper reversal.

NasdaqToday's price action can tell us a lot about the trend and future movements. After the drop to 24200, an uptrend line formed and resistance at 24470. If this trend continues, we can expect a breakout of this resistance and the key 24500 level. After confirmation, the Nasdaq could reach its highs again. Remember that on the daily chart, we are still in a strong bullish trend. Happy trading!

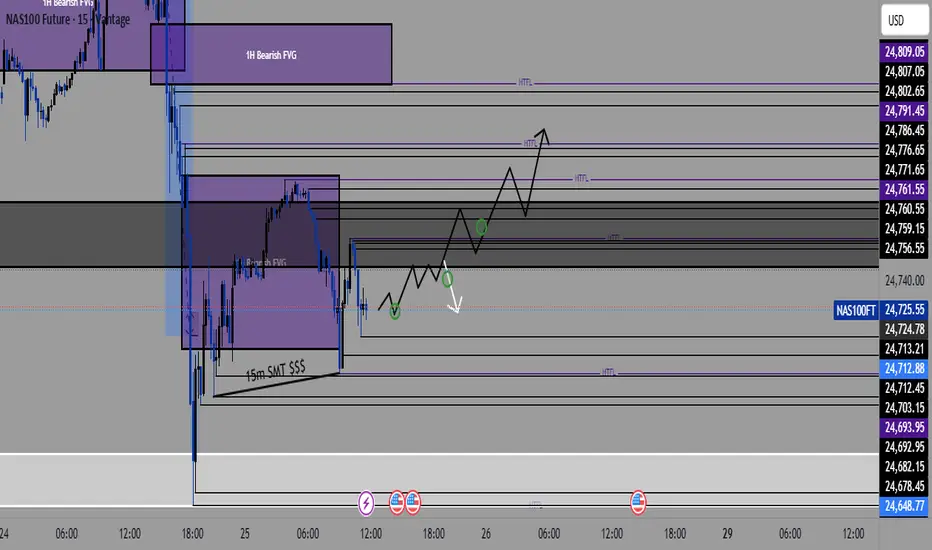
NAS100 (15-Minute Timeframe)🔍 Key Levels to Watch:
Bullish Setup 👇: After a dip in price, we've seen potential accumulation at the 15-minute FVG (Fair Value Gap), setting up for a possible bounce. 🟢
Bearish Resistance ⬆️: Price is currently interacting with a 1-hour Bearish FVG, with potential for further downside if resistance holds. ⛔️
🔵 Potential Trade Plan:
Look for a Pullback: Price could retrace to the higher time-frame resistance zones around 24,791.45 (HTFL) or 24,786.45.
Key Entry Points: Focus on price action near the 15-minute FVG, which may give us a clearer bullish confirmation. 🟢
Target Zones: Aiming for 24,791.45 and higher based on overall momentum.
🔥 Stay alert and trade wisely! Always use proper risk management.
Greetings,
MrYounity
RR=2.5 Sell ideaBearish butterfly pattern + RSI divergence + PRice bounced back on resistance
: Expecting the price to correct , potential target 61.8% fib retracement
PS : never risk more than 2% of your capital per trade


Nas100 Trade Set Up Sep 24 2025I will want to see price sweep SSL followed by a 1m IFVG/CISD to take higher to 4h FVG/Supply
www.tradingview.com

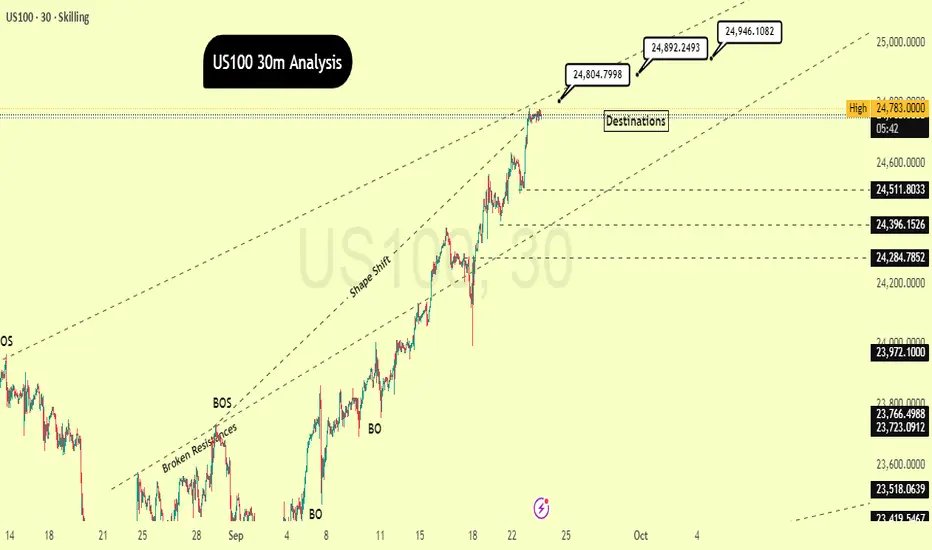
"Reaching Our First Target: What's the Next Step?"By scrutinizing the US100 chart on the30-minutes timeframe, it's evident that the price has initiated a powerful uptrend after surmounting several resistance zones. This is substantiated by the explicit "BOS" (Break of Structure) points, signaling that the market is consistently forging new, higher peaks. The "Shape Shift" noted on the chart indicates a transformation in market character, transitioning from a period of consolidation or a downtrend into a fresh, vigorous bullish impulse.
The price is currently nearing a pivotal resistance point around 24,783.0000. Should the price manage to breach and maintain a position above this threshold, we can anticipate a continuation of the upward trajectory. The prospective targets, labeled as "Destinations," are, 24804.7998, 24,892.2493 and , with an additional high-level objective at 24,946.1082.
I'd appreciate it if you could show your support through likes and comments to encourage me to share more analysis with you, and please share your perspective on the potential direction of this chart with me!
With Respect:
SimarEdgeTrading