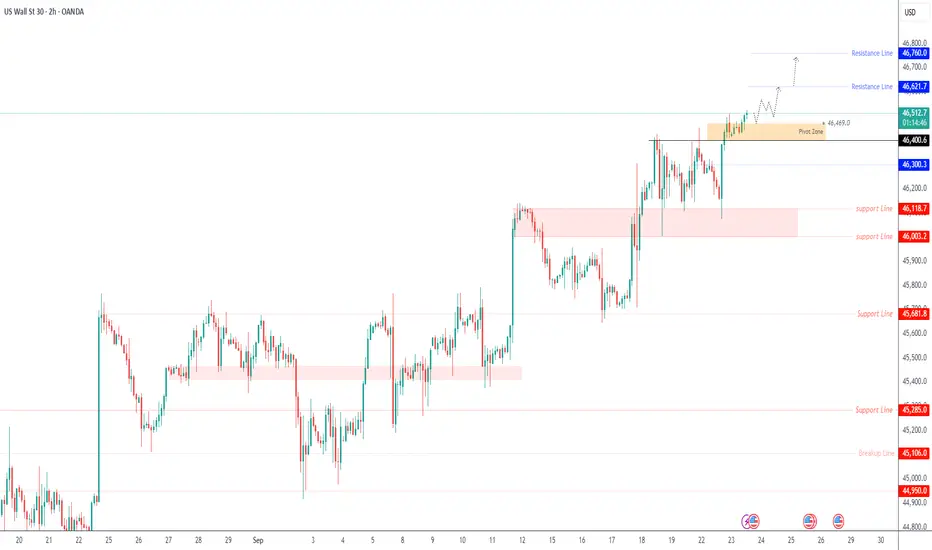
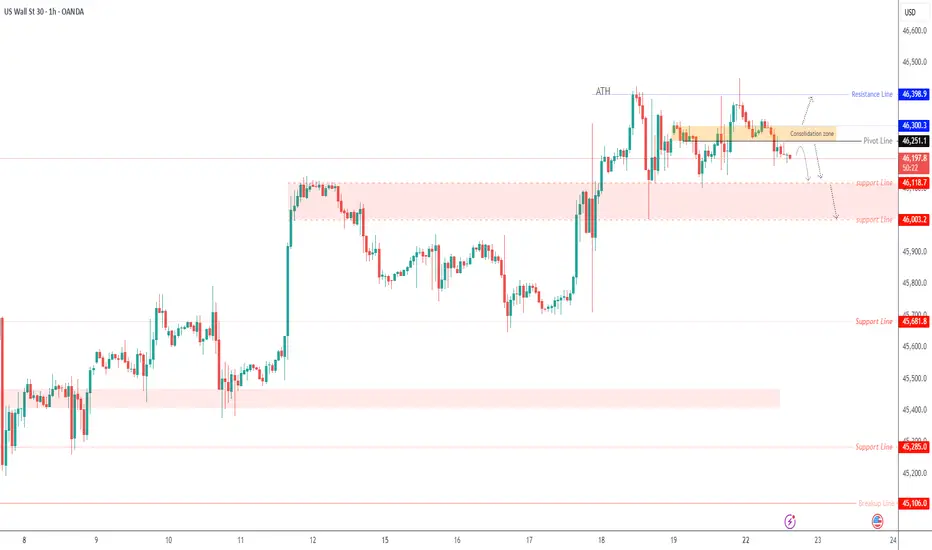
Bullish continuation?Dow Jones (US30) is reacting off the pivot which acts as an overlap support and could bounce to the 1st resistance which has been identified as a swing high resistance.
Pivot: 46,123.56
1st Support: 45,765.51
1st Resistance: 46,704.98
Disclaimer:
The above opinions given constitute general market commentary, and do not constitute the opinion or advice of IC Markets or any form of personal or investment advice.
Any opinions, news, research, analyses, prices, other information, or links to third-party sites contained on this website are provided on an "as-is" basis, are intended only to be informative, is not an advice nor a recommendation, nor research, or a record of our trading prices, or an offer of, or solicitation for a transaction in any financial instrument and thus should not be treated as such. The information provided does not involve any specific investment objectives, financial situation and needs of any specific person who may receive it. Please be aware, that past performance is not a reliable indicator of future performance and/or results. Past Performance or Forward-looking scenarios based upon the reasonable beliefs of the third-party provider are not a guarantee of future performance. Actual results may differ materially from those anticipated in forward-looking or past performance statements. IC Markets makes no representation or warranty and assumes no liability as to the accuracy or completeness of the information provided, nor any loss arising from any investment based on a recommendation, forecast or any information supplied by any third-party.
US30 trade ideas

Short Position On Us30"Shorted Dow Jones ⚡ Risk managed. Once +100 pts hit, we go risk-free. Protect the bag, let the trade run. #TradingDiscipline #DowJones"
US30 – Fresh Record High with Bulls Targeting Higher LevelsUS30 – Overview
The Dow Jones Industrial Average recorded a new all-time high (ATH) at 46,520, extending its rally as markets continue to digest supportive macro drivers.
Optimism around Federal Reserve rate-cut expectations, along with strong corporate earnings and upbeat U.S. economic data, keeps investor sentiment constructive.
Focus now turns to upcoming Fed commentary and economic releases, which could provide the next catalyst for fresh highs or a short-term pullback.
Bullish Scenario
Price remains in a strong bullish trend as long as it trades above the 46,470 pivot zone.
Targets: 46,620 → 46,760.
A confirmed 1H close above 46,620 would signal continuation toward higher extensions if momentum strengthens further.
Bearish Scenario
To shift momentum lower, price would need to close at least a 1H candle below 46,400.
Targets: 46,300 → 46,120 on sustained selling pressure.
Further weakness could follow if Fed officials adopt a more hawkish tone or if key data surprises to the upside, reducing rate-cut bets.
Pivot: 46,470
Resistance: 46,620 – 46,760
Support: 46,400 – 46,300 – 46,120
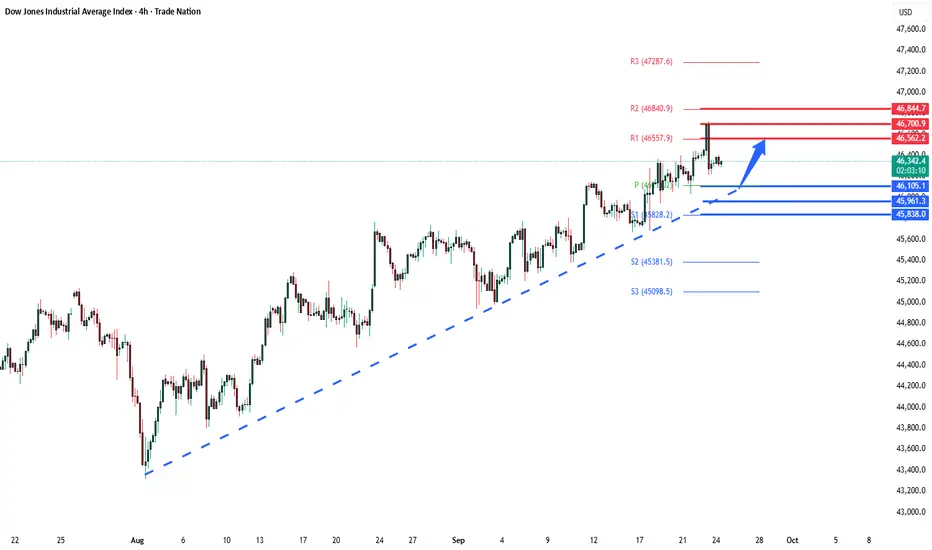
Dow overbought corrective pullback supported at 46100Key Support and Resistance Levels
Resistance Level 1: 46560
Resistance Level 2: 46700
Resistance Level 3: 46845
Support Level 1: 46100
Support Level 2: 45960
Support Level 3: 45840
This communication is for informational purposes only and should not be viewed as any form of recommendation as to a particular course of action or as investment advice. It is not intended as an offer or solicitation for the purchase or sale of any financial instrument or as an official confirmation of any transaction. Opinions, estimates and assumptions expressed herein are made as of the date of this communication and are subject to change without notice. This communication has been prepared based upon information, including market prices, data and other information, believed to be reliable; however, Trade Nation does not warrant its completeness or accuracy. All market prices and market data contained in or attached to this communication are indicative and subject to change without notice.
US30 ShortElite Strategy
Waiting price to come tap OB twice to confirm OB to TOB
Execute in smaller time frame
Targeting lower liquidity pools
Main target Structural liquidity
Questions about the Macro environments $DJIthe recession succeeding the great depression all lacked scale and were distinct to the great depression. As long as the government doesn't begin seizing assets we should be alright to continue the bullish macro trends.

US30 – Key Pivot Zone Signals Next MoveUS30 – Overview
The Dow Jones remains under bearish momentum while trading below the 46,250 – 46,300 pivot zone, keeping pressure toward key supports.
📉 Bearish Scenario
Price targets a move toward 46,120 as long as it stays below 46,250 – 46,300.
🔻 A confirmed 1H close below 46,120 would strengthen the bearish trend, opening the path to 46,000.
📈 Bullish Scenario
If price pushes higher and achieves a 1H close above 46,300, bullish momentum would return, with upside targets at 46,400 and beyond.
Key Levels
Pivot: 46,250
Resistance: 46,300 – 46,400
Support: 46,120 – 46,000
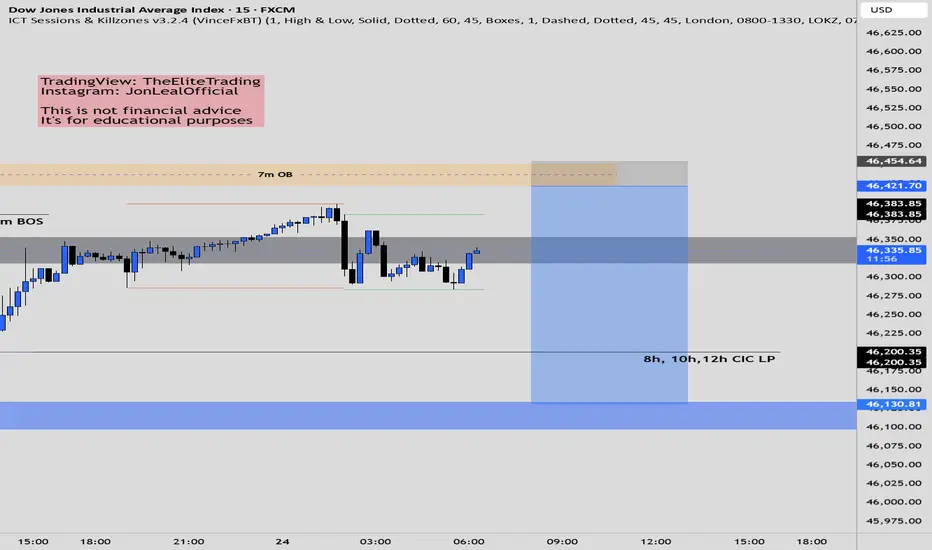
US30 ShortElite Analysis
Confirmations met, to make this A+ we need a 30m BOS
Targeting lower liquidity pools

US30 hits new all-time high amid robust AI fever
US equities rallied to fresh record highs, fueled by the Fed’s rate cut, resilient US economic data, and optimism over progress in US-China trade negotiations. Ongoing enthusiasm for AI also boosted technology stocks.
Nvidia (NVDA) drove the strongest market reaction after announcing a \$5 bln purchase of more than 4% of Intel (INTC). Sentiment was further buoyed by reports that Chinese regulators halted their antitrust probe into Google (GOOGL), ending a long-running investigation into Android’s dominance.
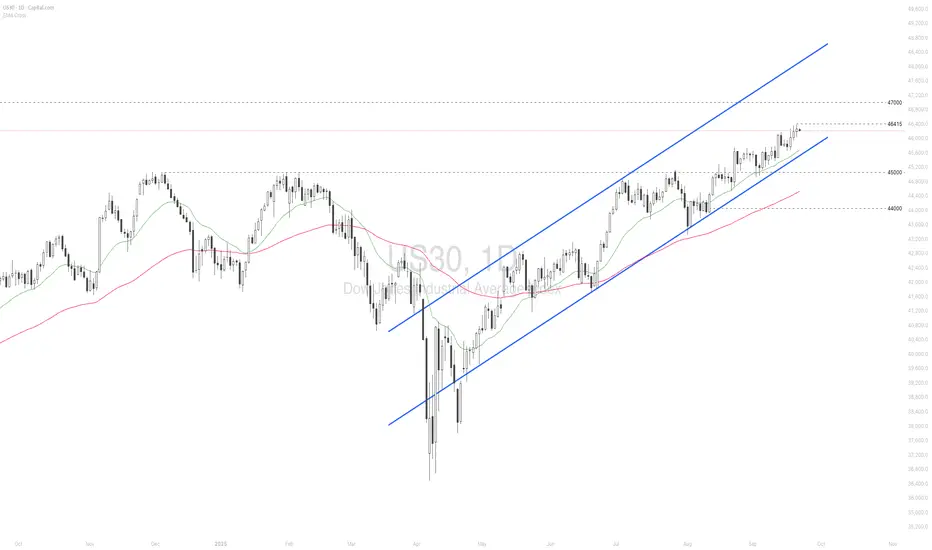
US30 maintained a solid uptrend within the ascending channel, setting a new high. The index holds above both EMAs, indicating the potential continuation of the bullish momentum. If US30 breaches above the 46415 high, the index may gain upward momentum toward the psychological resistance at 47000. Conversely, if US30 breaks below EMA21 and the channel’s lower bound, the index could retreat toward 45000.
US 30 Index – Preparing for the End of Q3Historically, September is usually a poor month for US stock indices but, so far at least, this year it’s different. The US 30 index, which opened the month at 45609, is up around 850 points, trading close to new all time highs of 46465 recorded yesterday (time of writing 0800 BST). That’s a monthly gain of 1.8%.
Some of the reasons for this positive performance lie in last Wednesday’s 25bps (0.25%) interest rate cut from the Federal Reserve (Fed), which included in the accompanying statement the potential for another 2 more 25bps cuts into the end of the year, if the incoming US labour market data suggests it is necessary, and the incoming inflation data is subdued enough to permit it. Two potential sticking points when considering whether this move high can continue.
Looking forward on the scheduled events front, traders receive updates on the health of the US economy in the form of the September Manufacturing and Service activity PMI surveys today at 1445 BST. Any reading above 50 = economic expansion, while below 50 = economic contraction. The focus may be the Services print which has been the main driver of US growth in 2025, with traders comparing Septembers performance against expectations (53) and the strong August print (54.5).
Fed Chairman Powell is also due to speak today on the economic outlook at an event in Warwick at 1735 BST. This could hold the attention of traders later in the day and is an important risk event to be negotiated.
Then, on Friday, the US PCE index is released at 1330 BST. This is the Fed’s preferred inflation gauge and with traders extremely sensitive to the direction of US inflation and its potential knock-on implications for the viability of future Fed interest rate cuts, this update could create extra volatility for the US 30 index into the weekend.
One final consideration for could be the upcoming end of the third quarter on Tuesday September 30th. Q3 has seen the US 30 index gain an impressive 5.2% from opening levels at 44073 on July 1st to 46420 this morning, leading to the question, Could investors decide to lock in these gains over the next 7 trading days or are they happy to hold positions, preparing for a further rally into the end of 2025?
Technical Update: Uptrend Bias Remains In Force
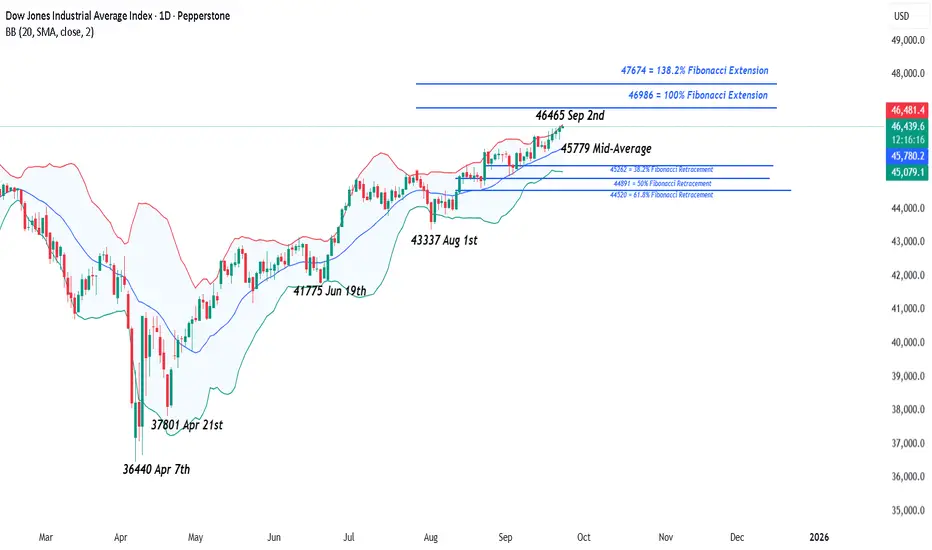
It’s difficult to ignore an asset that consistently posts new all-time highs, which is the case for the US 30 index. As the chart below shows, Monday registered another new upside extreme of 46465.
It could be argued this pattern of higher price highs and higher price lows materialising since the 36440 April 7th downside extreme reflects positive investor sentiment. Traders currently appear happy to pay a higher price each time a sell-off is seen, with this buying support then able to close above resistance marked by the previous high.
This is of course no guarantee that this price action will extend further over coming sessions, but it could mean that assessing what may be the potential support and resistance levels to monitor in the week ahead could be helpful in case an increase in volatility materialises.
Possible Resistance Levels:
Having encountered selling pressure at the 46465 new all-time high on Monday, this level could mark the first resistance focus for the coming week. A closing break above 46465 might well be interpreted by traders as opening scope to maintain the uptrend pattern to higher levels.
Such moves could then see tests of 46986, which is equal to the 100% Fibonacci extension level, and if this gives way, even potentially towards 47674, which is the higher 138.2% extension.
Possible Support Levels:
During the latest phase of the US 30 index advance, it has been the rising Bollinger mid-average that acted as support to price setbacks, limiting declines and enabling the move to resume upside strength. Therefore, with the average currently standing at 45779, this level could well mark the first support focus.
Closing breaks below 45779, if seen, could lead to the possibility of further price declines, opening potential to test the next support at 45262, which is the 38.2% Fibonacci retracement of August to September 2025 price strength (see chart above).
The material provided here has not been prepared accordance with legal requirements designed to promote the independence of investment research and as such is considered to be a marketing communication. Whilst it is not subject to any prohibition on dealing ahead of the dissemination of investment research, we will not seek to take any advantage before providing it to our clients.
Pepperstone doesn’t represent that the material provided here is accurate, current or complete, and therefore shouldn’t be relied upon as such. The information, whether from a third party or not, isn’t to be considered as a recommendation; or an offer to buy or sell; or the solicitation of an offer to buy or sell any security, financial product or instrument; or to participate in any particular trading strategy. It does not take into account readers’ financial situation or investment objectives. We advise any readers of this content to seek their own advice. Without the approval of Pepperstone, reproduction or redistribution of this information isn’t permitted.
US30 - Trading Edge TodayDear Friends in Trading,
🎯Trading Edge:
Following USTEC leadership but needs independent breakout above 46,450 for confirmation
Key Level: 46,450 (breakout confirmation)
Pivot: 46,200 – 46,350
Bias: Bullish above pivot
Bull target: 46,500 → 46,700
Bear target: 46,100 → 45,900
Correlation: +88% with USTEC (2–3-Hour lag), +48% with Gold
Risk Assets Alignment:
GOLD🔄USTEC🔄US30
✅Gold + USTEC + US30 all bullish above pivots = Fed dovish trade confirmed
✅Unusual Gold/equity positive correlation suggests monetary policy driving both higher
Assets Overbought:
🔴USTEC - 4HR Overbought Divergence Detected
I sincerely hope my point of view offers a valued insight.
Thank you for taking the time study my analysis.

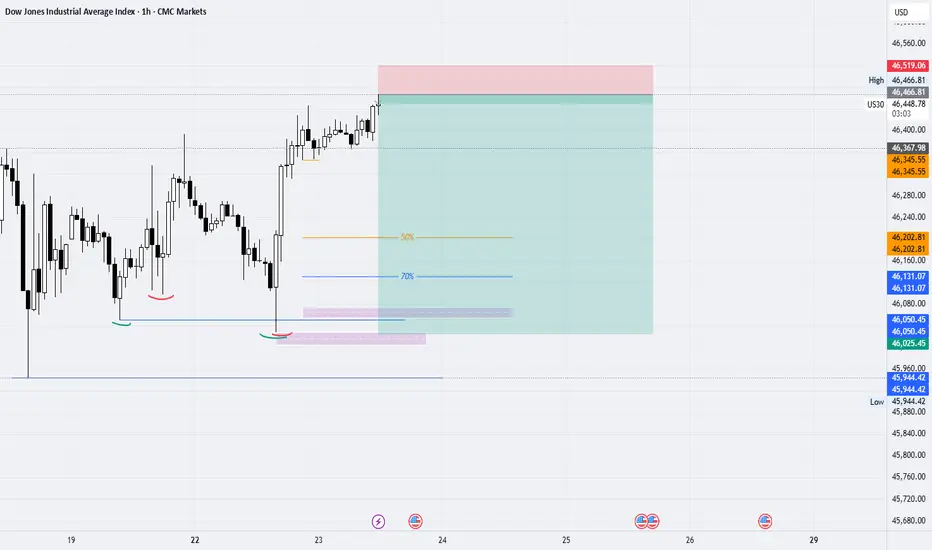
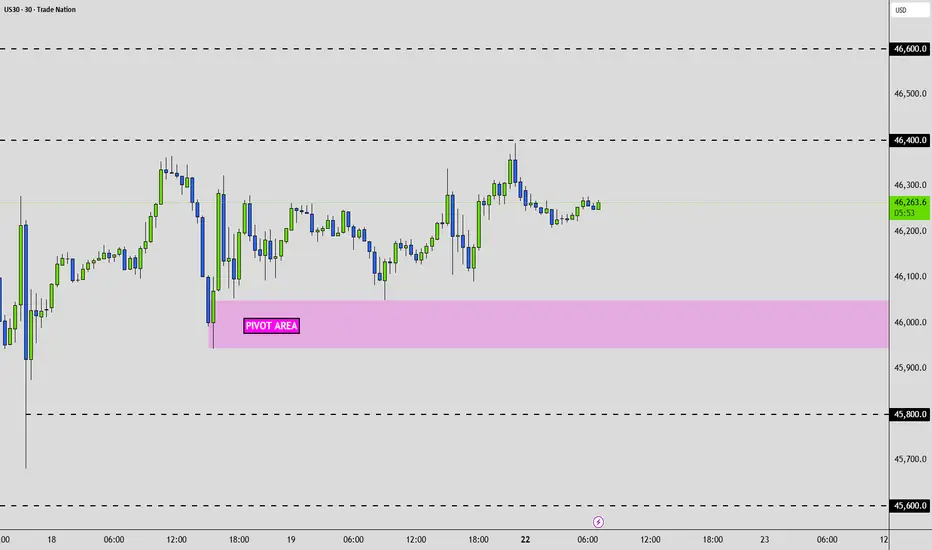
Dow Jones - US30: Trading Edge TodayDear Friends in Trading,
Experimental Test Phase Week:
Correlation Logic & Daily Efficiency - GOLD🔄NASDAQ🔄DOW JONES
🔎 Previous Week Observations -
Price built a volume base / cluster around 45,950 – 46,050 last week (multiple rotations here).
Breakout rallies on the 18th and 19th pushed price above 46,200, which is now acting as resistance/acceptance.
Current level (~46,273) is sitting right at this balance edge.
🎯US30 - 22Sept:
Pivot Area: 46,000 ± 50
Bias: Neutral-Bullish above pivot
Bull targets: 46,400 → 46,600
Bear targets: 45,800 → 45,600
👉 Gold and indices are inversely correlated intraday; if one pivots, the other confirms.
Dow showing slower but steady grind.
Needs >46,400 to confirm breakout continuation.
I sincerely hope my point of view offers a valued insight.
Thank you for taking the time study my analysis.
"Trade setup on US30 for a weekly sell"We have a market with a bullish accumulation that has been attracting buyers with an upward sentiment. What I’m looking for is a downward manipulation to shake buyers out of this accumulation, as you can see in this flag. It’s an accumulation that is breaking through highs, and banks usually look to break liquidity zones in order to generate their sales. In addition, the price needs to find stability since it has been rising too much. I see this sell opportunity as possible with this trading pattern I look for: problem, reaction, and solution.
DJIA Long Position Dow Jones has broke and retested my Resistance which is the previous Higher High so now im anticipating a target at $50.000.

US 100Dow Jones ( DJI )
- Completed " 123 " Impulsive Waves
- Break of Structure
- Change of Characteristics
- Bullish Channel as an corrective pattern in Short Time Frame and Long Time Frame
- Resistance Level

$DJI📊 Key Market Predictions This Week
1️⃣ NY Fed Inflation Data (Tuesday): Prices in NY are already climbing inflation is back in the market.
2️⃣ Fed Meeting Minutes (Wednesday): Expect signals that the Fed is trying to better manage the economy. With the government shutdown, money and policy are being rearranged.
3️⃣ Powell Speaks (Thursday): His tone could set the stage for how aggressive or cautious the Fed will be moving forward.
4️⃣ MI Consumer Data (Friday): Sentiment may look steady as “buy now, pay later” options continue to keep spending alive.
5️⃣ Jobs Report (Friday, if shutdown ends): We could see a pickup, reflecting that investments are still entering the market despite uncertainty.
Dow updatedLooks like we had too much tequila.Seems hung over now.Buyers could come in and push it up.Lets see what happens

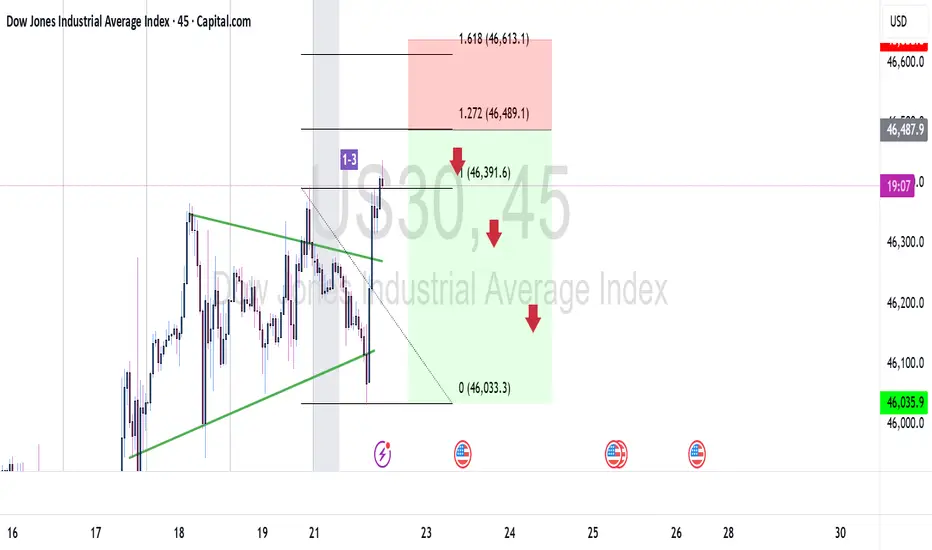
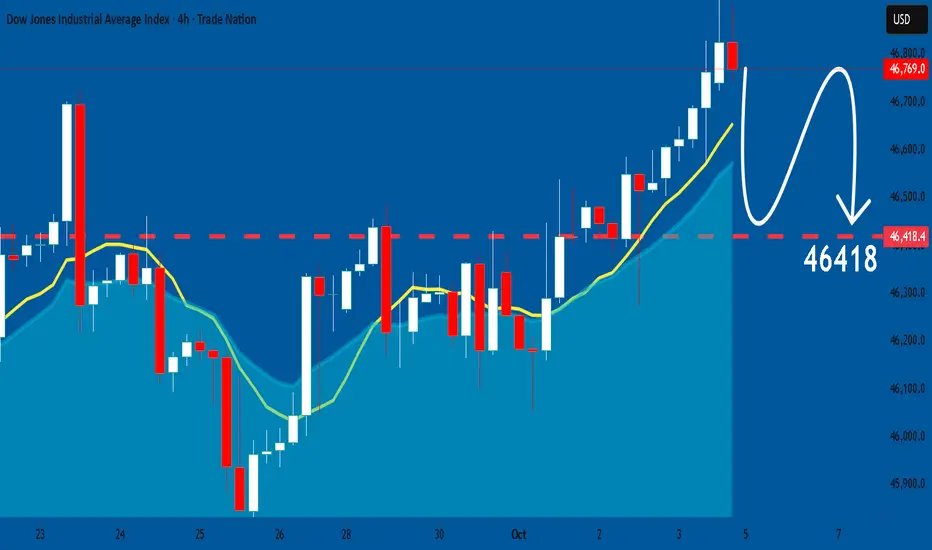
US30: Bearish Continuation is Expected! Here is Why:
Looking at the chart of US30 right now we are seeing some interesting price action on the lower timeframes. Thus a local move down seems to be quite likely.
Disclosure: I am part of Trade Nation's Influencer program and receive a monthly fee for using their TradingView charts in my analysis.
❤️ Please, support our work with like & comment! ❤️
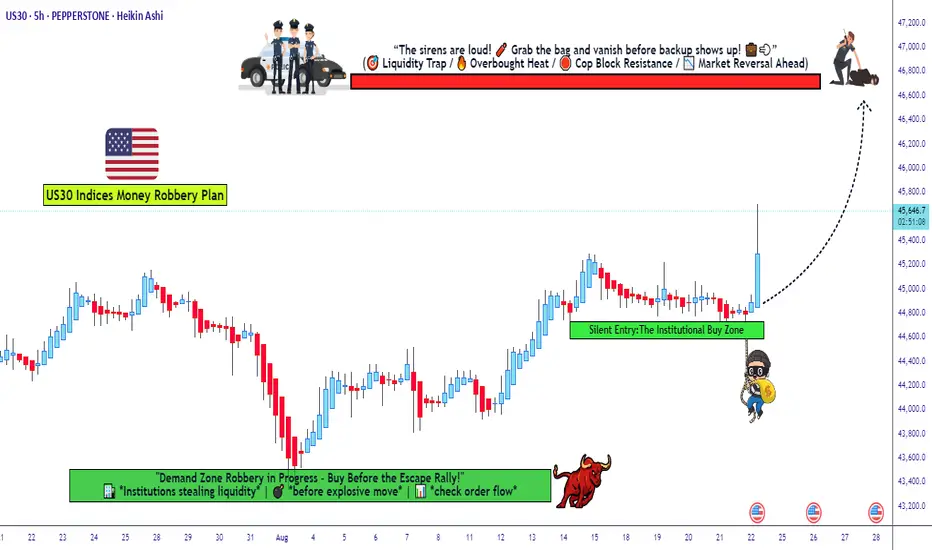
Dow Jones Bulls Preparing Another Robbery — Are You In?🚨💰 US30/DJ30 Index CFD Market Heist Plan 🏦🎭
🕵️ Dear Thief OG’s, Ladies & Gentlemen of the robbery squad… the vault is wide open again! This time we’re sneaking into the Dow Jones (US30) for a Bullish Day/Swing Heist. 🔥
🎯 Robbery Blueprint
Asset: US30/DJ30 Index CFD (Day/Swing Trade)
Plan: Bullish 📈
Entry (Thief Style):
The thief never knocks once… we layer the doors! Multiple buy limit orders 🔐:
Layer 1 → 45,600.0
Layer 2 → 45,400.0
Layer 3 → 45,200.0
(You can expand the layers depending on your risk appetite 🕳️)
Stop Loss (SL) 🛑:
📍 Thief SL @ 44,600.0
(Adjust based on your own risk & startergy – remember, survival is key in every robbery 🏃💨)
Target (TP) 🎯:
🚓 Police barricade spotted @47,000.0! Our sweet escape is planned at 46,800.0 before sirens catch us. 💰
🏆 Thief Strategy
Multiple limit order entries (layering method / scaling in).
Enter at any price level if you’re fast, but layering is the OG Thief move.
Manage your SL & risk like a pro robber – no reckless moves, or you’ll end up behind market bars! 🚔
💡 Why This Heist? 💡
The US30/DJ30 is primed for a bullish run 📈, driven by real-time market signals:
Technical Analysis: Strong support levels holding firm, momentum indicators screaming bullish! 📊
Fundamental Outlook: Check global market data, COT reports, and sentiment analysis for confirmation. 🔗👉
Volatility Watch: Stay sharp for news releases that could spike volatility. 📰⚠️
⚠️ Thief’s Risk Management ⚠️
News Alert: Avoid new trades during major news drops to dodge wild price swings. 🚫
Position Management: Use trailing stops to lock in those sweet profits. 🔐
Risk Control: Adjust lot sizes and SL based on your layered entries and risk profile. 📉
🏆 Join the Heist! 🏆
💥 Hit the Boost Button 💥 to power up our Thief Trader crew! 🚀 Let’s make bank with ease using the Thief Trading Style! 💸😎 Stay tuned for the next heist plan, and let’s keep robbing the markets! 🤑🐱👤
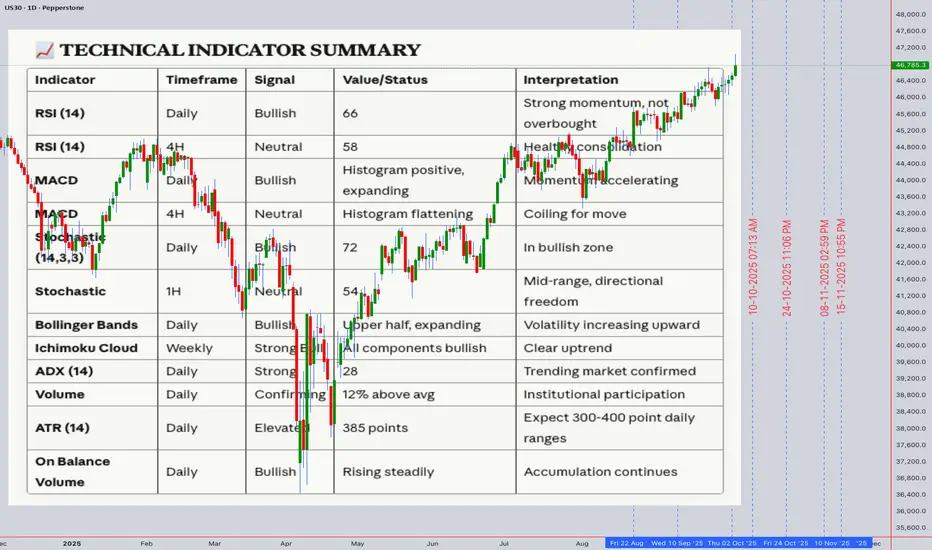
US30 -Dow Jones Industrial Average Technical Analysis & ForecastCurrent Price: 46,785.30 | 4th October 2025, 12:54 AM UTC+4
EXECUTIVE SUMMARY
The Dow Jones Industrial Average is trading at 46,785.30, showing consolidation near all-time highs. Multi-timeframe analysis reveals a bullish trend with caution signals emerging on shorter timeframes. Key resistance at 47,000-47,200 zone presents a critical decision point for continuation versus correction.
Bottom Line: Bullish bias remains intact on daily/weekly charts, but intraday traders should watch for potential pullback to 46,500-46,300 support zone before next leg higher.
MULTI-TIMEFRAME MARKET STRUCTURE
Monthly/Weekly Context (Swing Trading)
Trend: Strong bullish momentum maintained since October 2023 lows
Elliott Wave Count: Potential Wave 5 of larger degree impulse, suggesting final push before correction
Key Levels: Major support at 45,800-46,000 (previous breakout zone); resistance at 47,200-47,500
Daily Chart Analysis
Structure: Higher highs and higher lows pattern intact
Ichimoku Cloud: Price trading above bullish cloud; Tenkan-sen/Kijun-sen bullish cross active
Pattern Recognition: Ascending channel formation with upper boundary at 47,150
4-Hour Chart (Critical Timeframe)
Candlestick Patterns: Recent doji and spinning tops indicating indecision
RSI: Divergence warning - price making higher highs while RSI shows lower highs (bearish divergence)
Volume Profile: Declining volume on recent push higher suggests weakening momentum
1-Hour/30-Minute (Intraday Focus)
Microstructure: Double top formation developing at 46,850-46,900 zone
Bollinger Bands: Price touching upper band with band width expanding
VWAP: Trading 0.2% above daily VWAP (46,692) - moderately extended
TECHNICAL INDICATOR DEEP DIVE
Momentum Indicators
RSI (14):
Daily: 62 (neutral-bullish)
4H: 58 (declining from 72 two days ago)
1H: 54 (bearish divergence present)
Interpretation: Momentum cooling after recent rally; not yet oversold
Trend Indicators
Moving Averages:
20 EMA: 46,580 (immediate support)
50 EMA: 46,200 (critical support)
200 EMA: 44,800 (long-term trend support)
Golden Cross Status: Active and bullish (50 MA above 200 MA)
Volatility Indicators
Bollinger Bands (20,2): Price at upper band; squeeze releasing suggests increased volatility ahead
ATR (14): 285 points (elevated) - expect 250-350 point daily ranges
Volume Analysis
Volume Weighted Average Price: 46,692
Volume Trend: Declining on up-moves (distribution warning)
Anchored VWAP: From October 1st low at 46,450 - price 0.7% above anchor
HARMONIC & PATTERN ANALYSIS
Gann Analysis
Square of 9: Next resistance at 47,088 (90° from current cycle low); support at 46,488
Gann Angles: 1x1 angle from September low projects support at 46,550
Time Cycles: October 8-10 represents potential reversal window (45-48 trading days from last pivot)
Harmonic Patterns
Potential Bat Pattern: Monitoring for completion at 46,950-47,000 (0.886 retracement level)
Fibonacci Confluence: 1.618 extension of recent corrective wave targets 47,150
Wyckoff Analysis
Phase: Appears to be in Distribution Phase B (preliminary supply)
Spring/Shakeout Watch: False breakout above 47,000 could trigger sell-off
Elliott Wave Count
Primary Count: Wave 5 of Intermediate (3), targeting 47,400-47,800
Alternate Count: Wave B corrective triangle forming; expect breakdown if 46,500 breaks
SUPPORT & RESISTANCE FRAMEWORK
Immediate Resistance Zones
46,850-46,900 - Intraday double top / psychological
47,000-47,050 - Major psychological / round number / Gann level
47,150-47,200 - Channel top / Fibonacci 1.618 / weekly pivot
47,500-47,600 - All-time high extension target
Support Zones
46,650-46,700 - VWAP / hourly demand zone
46,500-46,550 - 20 EMA / Gann 1x1 angle / pivot
46,200-46,300 - 50 EMA / gap fill / strong demand
45,800-46,000 - Daily cloud / major breakout point
TRAP SCENARIOS
Bull Trap Alert
Setup: Break above 47,000 with low volume followed by immediate reversal
Confirmation: Close below 46,800 same day with volume spike
Target: Retest 46,300-46,500 zone
Bear Trap Potential
Setup: Quick spike below 46,500 followed by rapid recovery
Confirmation: Close above 46,650 with strong volume
Target: Resume rally toward 47,200+
INTRADAY TRADING PLAN (October 4-11, 2025)
Day Trading Strategy - Scalp Setups
Bullish Scenario (60% Probability)
Entry Criteria:
Pullback to 46,650-46,700 with bullish engulfing or hammer on 15M chart
RSI (15M) reaches 40-45 oversold region
Volume contraction during pullback, expansion on reversal
Trade Setup:
Entry: 46,680-46,720
Stop Loss: 46,580 (100 points risk)
Target 1: 46,850 (130 points, 1.3:1 R/R) - scale out 50%
Target 2: 47,000 (280 points, 2.8:1 R/R) - scale out 30%
Target 3: 47,150 (430 points, 4.3:1 R/R) - let 20% run
Optimal Entry Times:
9:45-10:15 AM EST (post-opening volatility)
2:00-3:00 PM EST (afternoon momentum)
Bearish Scenario (40% Probability)
Entry Criteria:
Rejection at 46,900-47,000 with bearish engulfing on 15M/30M
RSI (15M) overbought above 70
Break below 46,780 (short-term support)
Trade Setup:
Entry: 46,760-46,800 (after break confirmation)
Stop Loss: 46,920 (120-160 points risk)
Target 1: 46,650 (110-150 points) - cover 50%
Target 2: 46,500 (260-300 points) - cover 30%
Target 3: 46,300 (460-500 points) - trail remainder
Optimal Entry Times:
10:30-11:00 AM EST (if morning rally fails)
3:00-3:45 PM EST (late-day profit taking)
SWING TRADING PLAN (1-4 Week Horizon)
Primary Swing Setup - Bullish Continuation
Entry Strategy:
Ideal Entry Zone: 46,300-46,500 (if pullback materializes)
Aggressive Entry: Current levels with 46,450 stop
Pattern: Bull flag/ascending channel continuation
Position Management:
Entry: 46,400 (scale in 30% at 46,500, 40% at 46,400, 30% at 46,300 if available)
Stop Loss: 46,100 (300 points, daily close below)
Target 1: 47,200 (700-800 points) - reduce 40%
Target 2: 47,800 (1,300-1,400 points) - reduce 30%
Target 3: 48,500 (2,000+ points) - trail with 50 EMA
Timeframe: 2-4 weeks
Confidence Level: 65%
Alternative Swing Setup - Mean Reversion Short
Activation Criteria:
Daily close below 46,500 with volume above 20-day average
RSI daily breaks below 50
Break of ascending trendline from September
Trade Setup:
Entry: 46,450-46,500 (after confirmation)
Stop Loss: 46,850 (350-400 points)
Target 1: 46,000 (450-500 points) - cover 50%
Target 2: 45,600 (850-900 points) - cover 30%
Target 3: 45,200 (1,250-1,300 points) - trail remainder
Timeframe: 1-3 weeks
Confidence Level: 35% (lower probability setup)
WEEKLY ROADMAP (October 4-11)
Monday-Tuesday (Oct 6-7):
Expected Range: 46,500-47,100
Bias: Neutral to bullish - watch for pullback completion
Key Level: 46,700 (holding above maintains bullish structure)
Wednesday-Thursday (Oct 8-9):
Gann Time Window: Potential reversal period
Strategy: Reduce position size; let patterns develop
Watch: Economic data releases could spike volatility
Friday (Oct 10):
Weekly Close: Critical for swing positioning
Bullish Confirmation: Close above 46,850
Bearish Warning: Close below 46,600
RISK MANAGEMENT GUIDELINES
Position Sizing
Intraday: Risk 0.5-1% of capital per trade
Swing Trades: Risk 1-2% of capital per trade
Max Portfolio Heat: 4-5% across all positions
Key Risk Levels
Invalidation Point (Bulls): Daily close below 46,100
Invalidation Point (Bears): Daily close above 47,300
Correlation Monitoring
Watch US10Y yields (inverse correlation currently strong)
S&P 500 and Nasdaq leading/lagging analysis
Dollar Index impact on risk appetite
MARKET CONTEXT & EXTERNAL FACTORS
Macroeconomic Considerations
Federal Reserve policy stance remains influential
Q3 earnings season beginning - watch corporate guidance
Geopolitical tensions requiring monitoring (Middle East, US-China)
Sentiment Indicators
VIX below 15 suggests complacency - potential volatility spike risk
Put/Call ratios showing neutral sentiment
Institutional flows appear distributive near highs
Seasonal Patterns
October historically volatile (correction risk)
Year-end rally potential if correction occurs early month
FINAL TRADING RECOMMENDATIONS
For Intraday Traders:
Best Setup: Wait for pullback to 46,650-46,700 for low-risk long entries
Avoid: Chasing above 46,900 without confirmation
Focus Timeframes: 15-minute and 1-hour charts for entries; 5-minute for exits
For Swing Traders:
Patience Required: Current levels are extended; wait for 46,300-46,500 zone
Alternative: Small position at current levels with very tight stops (46,650)
Best Risk/Reward: Appears in the 46,300-46,400 region
Overall Market Outlook:
Bullish bias maintained with 60-65% probability of testing 47,200+ in coming 2-3 weeks. However, near-term consolidation or shallow pullback (5-7%) is healthy and would provide better entry opportunities. The combination of weakening momentum indicators and potential Gann time reversal window suggests patience will be rewarded.
TRADING PSYCHOLOGY NOTES
FOMO Warning: Resist urge to chase at current elevated levels
Discipline: Stick to predefined entry zones even if price continues higher
Flexibility: Be ready to flip bias if key levels break (46,100 bears / 47,300 bulls)
Disclaimer: This analysis is for educational purposes only. Trading involves substantial risk of loss. Always conduct your own research and consult with financial advisors before making investment decisions. Past performance does not guarantee future results.
Next Update: October 7, 2025 (Mid-week review with refined levels)
Analysis combines multiple technical methodologies for comprehensive market perspective. No single indicator should be used in isolation. Confluence of signals increases probability of success.
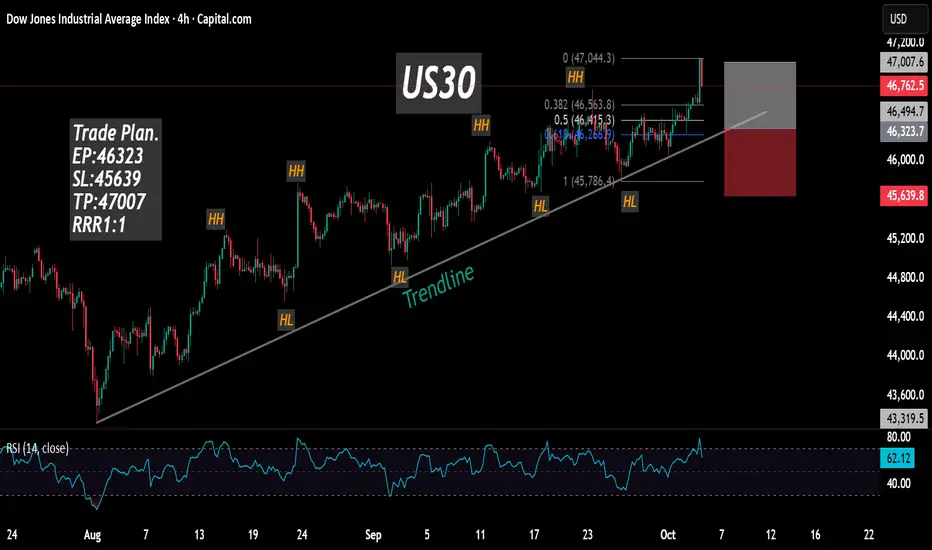
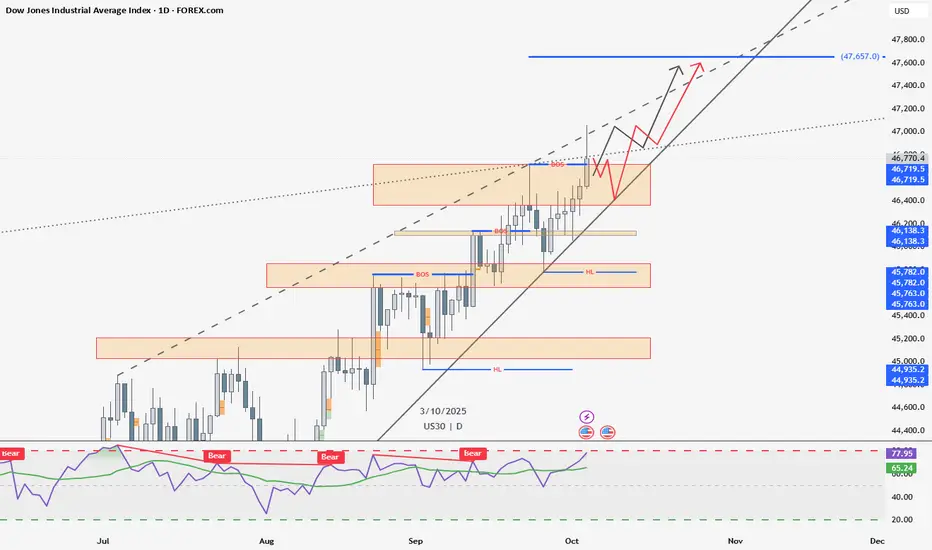
Dow Jones - US30 My Love — US30 💕
On the daily timeframe , the last daily candle closed slightly above the previous Higher High (46719.5) , creating a Break of Structure (BOS) — but it’s still below the trendline resistance (dotted line).
For next week, price could go either way :
Bullish scenario: Break the trendline resistance and continue higher, forming a new Higher High (HH) — possible target around 47,657.
Bearish retrace: Pull back to retest the lower trendline support before attempting another push to create a new HH.
Always fun watching how US30 reacts to trendlines 😄📈
FOREXCOM:US30
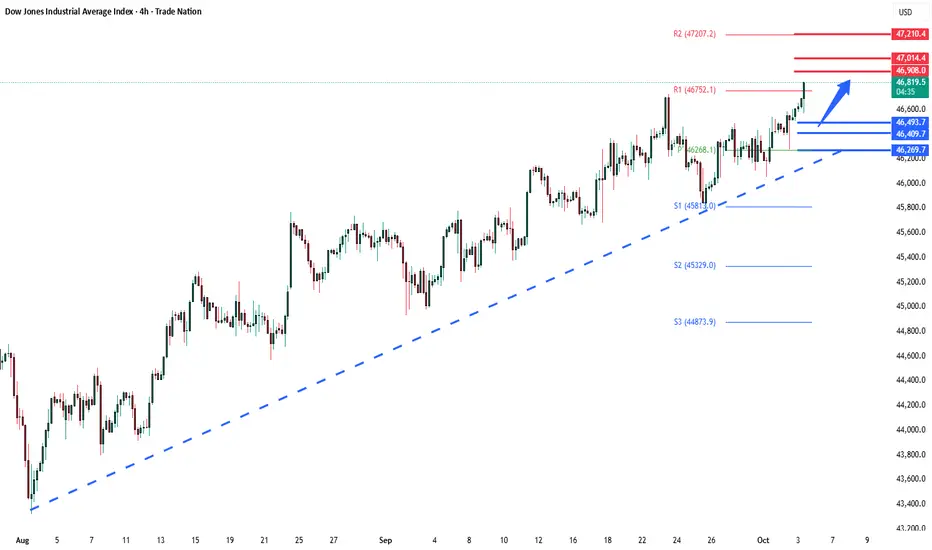
DowJones Key Trading levels Key Support and Resistance Levels
Resistance Level 1: 46900
Resistance Level 2: 47000
Resistance Level 3: 47210
Support Level 1: 46490
Support Level 2: 46410
Support Level 3: 46270
This communication is for informational purposes only and should not be viewed as any form of recommendation as to a particular course of action or as investment advice. It is not intended as an offer or solicitation for the purchase or sale of any financial instrument or as an official confirmation of any transaction. Opinions, estimates and assumptions expressed herein are made as of the date of this communication and are subject to change without notice. This communication has been prepared based upon information, including market prices, data and other information, believed to be reliable; however, Trade Nation does not warrant its completeness or accuracy. All market prices and market data contained in or attached to this communication are indicative and subject to change without notice.