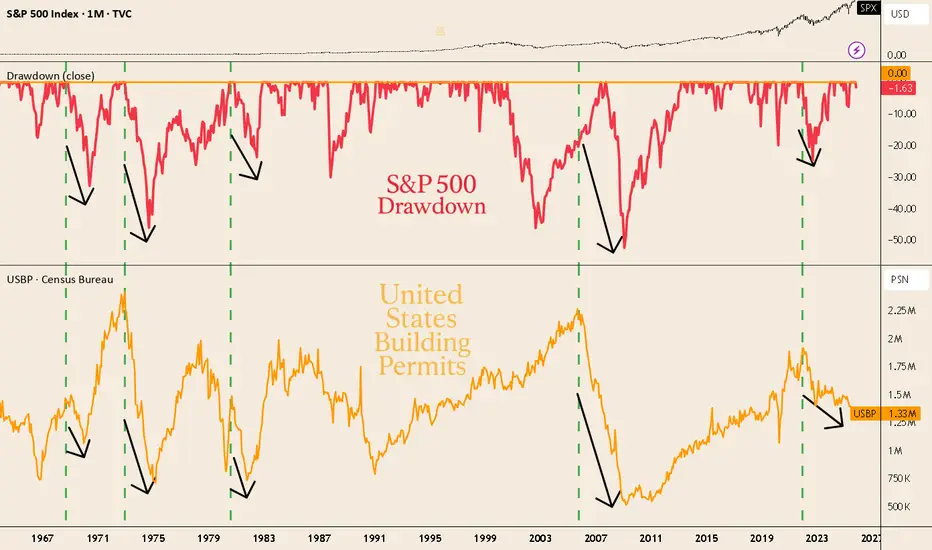
Building Permits: the silent warning behind market cyclesU.S. Building Permits have historically acted as a leading indicator of economic slowdowns.
Each time construction activity cooled — in the 1970s, 2007, and again post-2021 — deep S&P 500 drawdowns followed shortly after.
Today, permits have fallen to 1.33M (−2.3%), while the S&P 500 remains near all-time highs with a minor −1.6% drawdown.
📊 Historically, this kind of divergence doesn’t last long.
When the real economy starts to weaken, the market usually follows.
👉 The housing cycle whispers before the market screams.
Trade ideas
SPX 7000 by 11-20-2025Hello Traders,
Well the bull market continues. We just got done with a nice dip that bounced mid day Friday which appears to be a bottom. We also appear to have a bottom in BTC. I expect us to hit 7000 by 11-20-25..and could go higher before it consolidates into the next Fed decision but the direction is up.... The bull market continues... stay tuned!

The Scariest Divergence In the MarketThe Scariest Divergence In the Market
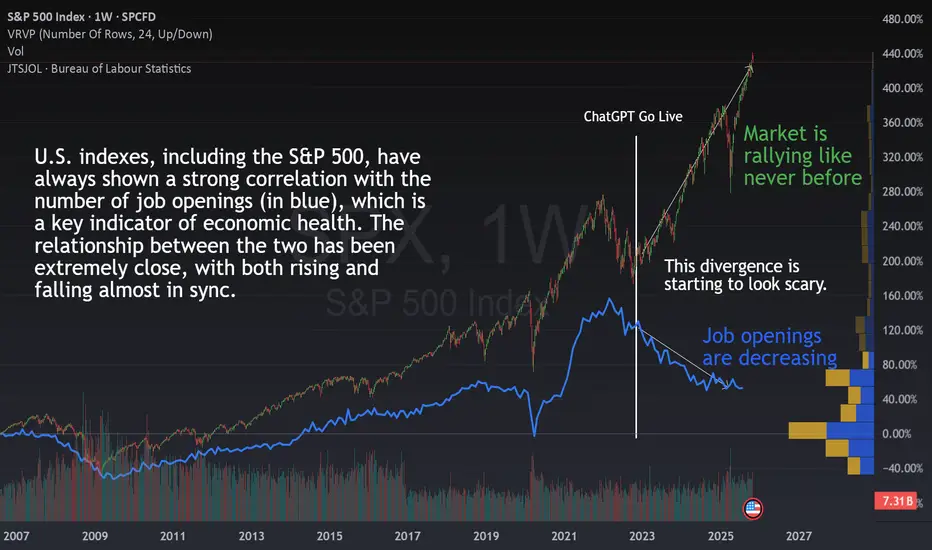
If you look at the chart, you’ll see the TVC:SPX (candles) and U.S. job openings (in blue) plotted together since 2001.
Historically, these two metrics have been highly correlated , both rising and falling almost in sync as the economy expanded or contracted.
But something changed dramatically in November 2022.
That’s when ChatGPT went live, marking the start of the AI boom that has reshaped entire industries and mindsets. From that point on, we can see a massive divergence, the kind we’ve never seen before.
While job openings have kept declining steadily, the market has rallied like never before. This is not logical from a historical point of view.
🤖 Is AI Replacing Workers?
One possible explanation is that the market sees AI as a reason for optimism:
“If companies can do more with less labor, that means higher margins and better efficiency.”
So, fewer job openings might not scare investors anymore, it could even be seen as a sign of progress.
But that raises two key questions:
Is AI really replacing workers ?
If so, what happens to the broader economy and ?
📊 What the Data Says So Far
Surprisingly, unemployment in the U.S. has increased only slightly since AI went mainstream.
It’s a slow, healthy rise not a surge. So i t doesn’t seem like AI is replacing workers at scale just yet.
That’s good news in one sense, if unemployment remains low, consumer demand stays healthy, and the economy keeps running.
However, it also means that companies’ fixed costs haven’t really improved, and their productivity gains from AI are still very moderate , far from the exponential growth that the market seems to be pricing in.
💡 My current View
From my perspective, this chart makes one thing very clear.
The benefits of AI , as of today, are still much smaller than what the market is assuming.
Yes, AI will improve margins and efficiency over time. But if everyone implements it, competition will eventually push prices down again, and margins with them. The very same than internet with the online sales.
The real challenge won’t be for companies that adopt AI, but for those that don’t adapt fast enough , or for those that overspend on AI tools that fail to deliver meaningful returns.
☄️Some AI Stocks Are Starting to Show Doubt
Several major AI-related stocks are also showing concerning patterns . We don’t have confirmation yet , but it’s time to stay alert and be prepared in case the market starts breaking key support levels among the main players.
And the main index, S&P 500 is still in the bull zone but are key levels to watch closely:
🤔 What Do You Think?
Is AI truly transforming company performance as fast as investors believe?
Or are we witnessing a global over-excitement where expectations are running far ahead of reality?
SPX500 – Bearish Momentum Active | Eyes on 6670 SupportSPX500 | Overview
Wall Street futures struggled for traction on Friday, wrapping up a volatile week marked by concerns over the U.S. economic outlook and stretched tech-sector valuations.
After a sharp 1.5% decline yesterday, the index continues to trade under bearish pressure, with potential for a retest before the next move.
Technically:
The price remains volatile, with a retest toward 6754 still possible.
As long as the price stays below 6754, downside momentum could continue toward 6706 and 6670.
A confirmed 1H close below 6706 would strengthen bearish pressure, targeting 6670 → 6626 → 6580.
However, if the price stabilizes above 6754, short-term bullish momentum may return, targeting 6775 and 6814.
Pivot Zone: 6723 – 6706
Resistance: 6754 · 6775 · 6814
Support: 6670 · 6626 · 6580
Outlook:
SPX500 remains bearish while below 6754, with risk of continued correction toward 6670–6626.
Only a 1H close above 6754 would signal recovery toward 6775–6814.

S&P500 Possibly the last buy signal before Bull Cycle ends.The S&P500 index (SPX) has been trading within a 5-month Channel Up and is currently about to complete its latest Bearish Leg. All such pull-back sequences have reached at least the 4H MA200 (orange trend-line) before rebounding and kick-starting the next Bullish Leg, with the 1D MA50 (red trend-line) providing the ultimate Support of this pattern.
As a result, especially since the 4H RSI also hit the 30.00 oversold barrier, we expect the index to initiate the new Bullish Leg and aim for a Higher High near the 2.5 Fibonacci extension. Our Target is 7150.
-------------------------------------------------------------------------------
** Please LIKE 👍, FOLLOW ✅, SHARE 🙌 and COMMENT ✍ if you enjoy this idea! Also share your ideas and charts in the comments section below! This is best way to keep it relevant, support us, keep the content here free and allow the idea to reach as many people as possible. **
-------------------------------------------------------------------------------
💸💸💸💸💸💸
👇 👇 👇 👇 👇 👇

SPX: AI valuation fears grip marketsWithout official US macro data, investors turned their eyes to AI valuations, considering its strong growth during the past years. Words like “AI bubble” are often used in the news in order to explain the current fear among investors regarding valuations of tech companies which are reaching historically highest levels. CEOs of largest US investment banks are openly speaking about expected corrections in the future period, of 10% to 20%, while the International Monetary Fund also expressed its concerns regarding such a course of action in the coming period. Moreover, there has also been the news spread that the most famous so-called “Big short” investor, Michael Burry, placed bets against Nvidia and Palantir, currently two most valued companies in the field of tech industry. It should be also noted that there are analysts and investors who see this short correction as a good buying opportunity.
For the second week in a row, US equity markets are in a corrective mode. The S&P 500 reached its lowest weekly level on Friday at 6.640, however closed the week a bit higher, at 6.728. The performance of companies included in the index is mixed. On one hand, Amazon had a very good week after quarterly results. Its cloud unit, AWS, delivered 20,2% y/y growth in revenue, surpassing estimates. The company announced a multiyear deal with OpenAI, of around $38B, and a rise in its full-year capex outlook to $125B. On the opposite side was Nvidia, which entered into corrective mode, due to concerns of high valuations, of 7,2% w/w. Tesla was also traded lower by 5,8%. Overall, semiconductor companies closed the week lower and were mostly driving the S&P 500 lower.
CEOs of large banks are openly commenting that the volatility should be expected in the coming period, as well as some corrections in valuations. This should be taken into account in the coming period. Certainly, some investors will see these corrections as buying opportunities.

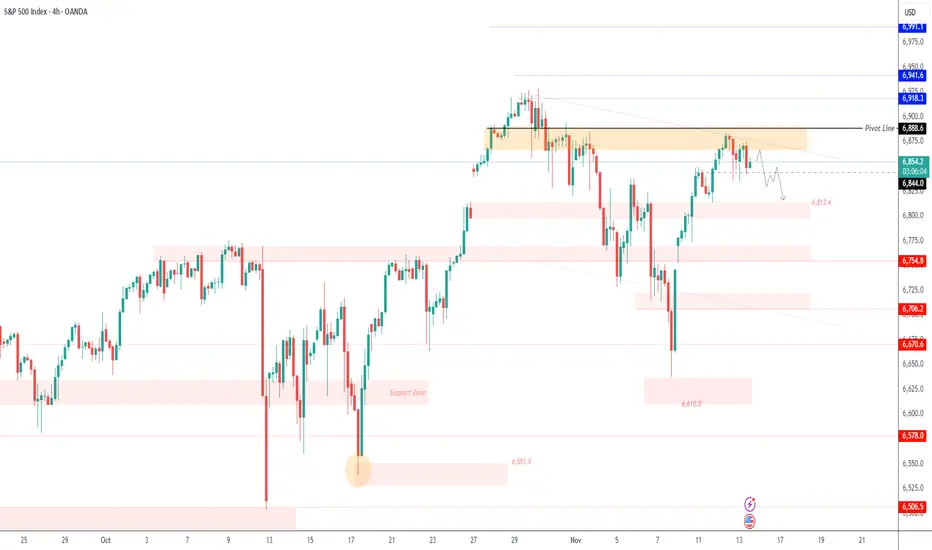
Shutdown Ends, Uncertainty Remains | SPX500 Holds Below 6866SPX500 | Overview
Trump Signs Bill to End Longest U.S. Government Shutdown
U.S. President Donald Trump signed a bill late at night in the Oval Office, officially ending the longest government shutdown in U.S. history, after a dinner with Jamie Dimon and top Wall Street executives.
While markets welcomed the resolution, the White House confirmed that some economic data gaps may be permanent, as October’s employment and CPI reports might never be released—a factor that could influence future Fed decision-making.
Technically:
The SPX500 has stabilized below the pivot zone at 6866, indicating continued bearish momentum with downside potential toward 6844 and 6813.
As long as the price trades below 6866, the bearish bias remains active.
However, a 1H close above 6888 would shift sentiment to bullish, targeting 6918 and a potential new all-time high (ATH) around 6940.
Pivot Line: 6866
Resistance: 6888 · 6918 · 6940
Support: 6844 · 6813 · 6768
S&P 500: Multiple Bearish Signals AlignS&P 500 index chart shows multiple bearish signals on the weekly time frame
1. The price has hit the upside of the long-term uptrend and it was rejected
2. Bearish Reversal Evening Star Candlestick pattern appeared on the top
3. RSI has built the Bearish Divergence as it did not confirm the new peak
There are 3 support levels:
1. Double support of trend channel's mid-line and previous top around $6,147
2. Bottom of the channel between $5,300 and $5,400
3. "Die-hard" multiple support that was built since 2021 around $4,819
What are your thoughts?

The whipsawI still think we completed the B wave today (C of B being the rally). If I'm correct, Monday should be a down day and the week will be dramatically down to 6500 area minimum. The usual suspects are discussed in the video.

A pullback may tell us moreAny pullback and then higher high likely means we are going to the upper BB again. A pullback that gets under today's low and 18ma would be very bearish. So we have to wait for a pullback. Gold may also pullback soon, and probably follows the general market. BTC still at resistance but could hit 107,500. Oil still consolidating.
The pullback will tell us more if and when it comes.

Watch out—the current rebound could be a bull trap.Watch out—the current rebound could be a bull trap.
Technical analysis
1. US500 rebounded from the EMA50, with the price forming higher swings, and the multi-period EMAs signal an uptrend.
2. However, price has formed Bearish Divergence with RSI twice already (rarely does it occur more than three times), so this rebound may not be sustainable.
3. In terms of Elliott Wave, this rally might be the final sub-wave before a major correction—potentially an Ending Diagonal, which tends to be a ZigZag structure and often finishes with a throw-over before reversing.
4. If the index holds above 6770 and can make a new high, the upside may be limited, with resistance at the ascending trendline around 7000—near the 161.8% Fibonacci retracement—before a significant pullback begins.
5. Alternatively, if US500 fails to make a new high, it may correct toward 6510 as the first support.
Fundamental Analysis
6. S&P 500 valuations look extended, trading around 28–30x P/E versus a 17–25x long-run average range, while P/S near ~3.3–3.4x sits close to record highs—both materially above historical norms.
7. Inflation remains above target as core CPI is ~3% and sticky, leading to expectations that the Fed may not cut interest rates that much, which might not support risk assets as initially anticipated.
8. Berkshire Hathaway's record cash holdings reflect Warren Buffett's increased caution. He views the current market as expensive or uncertain, thus pausing major investments. This stance aligns with the Buffett Indicator surging to 217%-223%, a level he previously warned was "playing with fire," implying the market is significantly overvalued relative to the economy.
Analysis by: Krisada Yoonaisil, Financial Markets Strategist at Exness

Relief Rally or False Start? | SPX500 Faces Crucial 6814 BarrierSPX500 – MARKET OUTLOOK | Bullish Bias Above 6814 🇺🇸
Global markets opened the week higher as optimism grows over a potential end to the U.S. government shutdown, boosting sentiment across major indices.
Above 6814: Bullish continuation toward 6842 → 6877 → 6904.
Below 6755: Bearish correction possible toward 6725 → 6706.
Pivot: 6814
Support: 6755 · 6724 · 6706
Resistance: 6842 · 6877 · 6904
SPX500 stays bullish while above 6814, but a confirmed close below 6755 would signal a short-term bearish correction toward 6725.

Congress Set to End Shutdown | SPX500 Holds Strong Above 6877SPX500 | Overview
U.S. Congress Poised to Get Back to Work
The U.S. government is on the verge of reopening, potentially restoring pay to federal workers and reviving key economic data releases that have been halted for weeks — leaving the Federal Reserve operating with limited visibility.
Renewed optimism over a resolution in Washington has boosted investor sentiment, supporting further upside in U.S. equities.
Technically:
The SPX500 has pushed higher and is now stabilized above the pivot level at 6877, indicating continuation of the bullish trend toward 6918 and 6941, with potential to reach new all-time highs (ATH) if momentum persists.
However, if the price closes a 1H candle below 6866, it would signal short-term weakness, leading to a bearish correction toward 6844 and 6814.
Pivot Line: 6877
Resistance: 6918 · 6941 · 6991
Support: 6845 · 6814 · 6797

S&P 500 (SPX) Eyes Fresh All-Time High in Wave (5)The ongoing cycle in the S&P 500 Index (SPX), originating from the April 2025 low, continues to unfold as an impulsive structure. The advance to 6920.21 marked the completion of wave (3) within this impulse, as illustrated in the accompanying one-hour chart. Subsequently, the market entered a corrective phase in wave (4), which developed as a double three Elliott Wave pattern.
From the termination of wave (3), wave ((a)) declined to 6814.26, followed by a recovery in wave ((b)) to 6882.32. The Index then resumed its descent in wave ((c)), reaching 6763.11 and thereby completing wave W of a higher degree. A corrective rally in wave X ensued, peaking at 6829.78. Thereafter, the Index turned lower again, initiating wave Y as a lower-degree zigzag.
Within wave Y, wave ((a)) bottomed at 6707.51 and wave ((b)) rebounded to 6757.63. Wave ((c)) extended downward to 6630.72, finalizing wave Y of (4). The Index has since begun to rise in wave (5). However, a decisive break above the wave (3) high at 6920.21 remains necessary to invalidate the possibility of a double correction. From the wave (4) low, wave ((i)) is nearing completion. A pullback in wave ((ii)) is anticipated to correct the cycle from the November 8, 2025 low, likely unfolding in a 3, 7, or 11 swing sequence. In the near term, provided the pivot at 6630.72 remains intact, any pullback should find support within the expected swing structure, paving the way for further upside continuation.

THESE PATTERNS DONT BREAK ABOVE EASILY, CORRECTION AHEADWatch for a sustained correction between the 27th October top until March 2026.
Trade safe, good luck.

Up for SPX500USDHi traders,
Last week SPX500USD made a bigger correction down which invalidated my wavecount.
On Friday evening it started an impulsive move up.
So next week we could see more (corrective or impulsive) upside for this pair.
Let's see what the market does and react.
Trade idea: Wait for a correction down on a lower timeframe. After a change in orderflow to bullish you could trade longs.
This shared post is only my point of view on what could be the next move in this pair based on my technical analysis.
But I react and trade on what I see in the chart, not what I've predicted or expect.
Don't be emotional, just trade your plan!
Eduwave

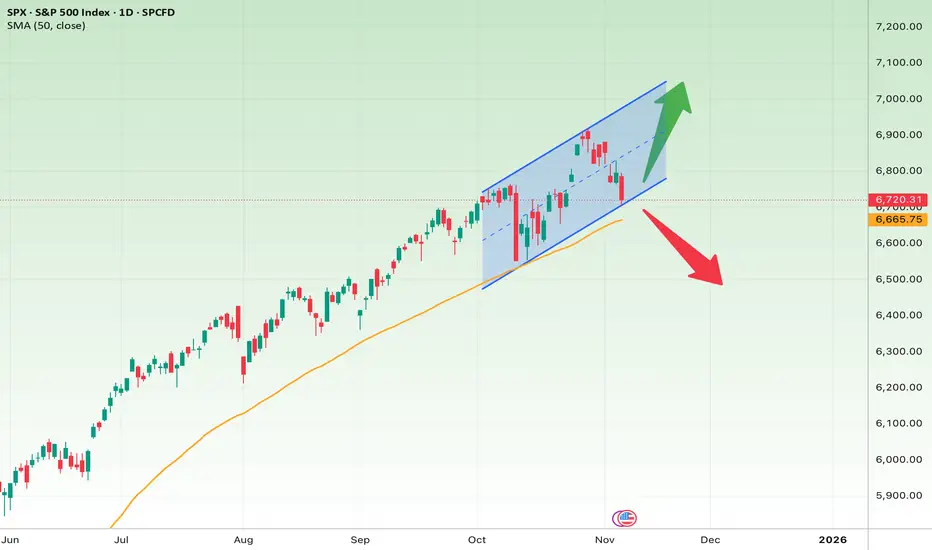
S&P 500 Index (SPX) — Daily Chart AnalysisThe S&P 500 is moving within a well-defined ascending channel on the daily timeframe. After touching the top of the channel, the index entered a short-term correction and is now testing the mid-channel area and the 50-day moving average (around 6,665) — both key support zones.
Short-Term Outlook (next few days to weeks)
If the index holds above 6,660–6,700 and starts to rebound, the next target would likely be the 6,950–7,000 resistance area near the top of the channel.
However, if 6,650 breaks and the price closes below it, a deeper pullback toward 6,450 or even 6,300 could follow.
• Bullish target: 6,950–7,000
• Bullish stop loss: Below 6,650
• Bearish target: 6,450–6,300
• Bearish stop loss: Above 6,800
Mid-Term Outlook (1–3 months)
The broader trend remains bullish, as the 50-day moving average still slopes upward. As long as the price stays above this line, the market structure remains positive.
If the upward channel holds, the next potential targets lie between 7,100 and 7,200.
But a confirmed breakdown below 6,650 could signal a shift in momentum toward a larger correction.
• Bullish mid-term target: 7,100–7,200
• Mid-term stop loss: Below 6,650
Summary :
The 6,660–6,700 range is the key zone to watch:
• Holding above it → continuation of the uptrend toward the channel’s upper boundary
• Breaking below it → possible decline toward the lower channel or deeper correction
In short, this area acts as the line between continuation and correction for the S&P 500.
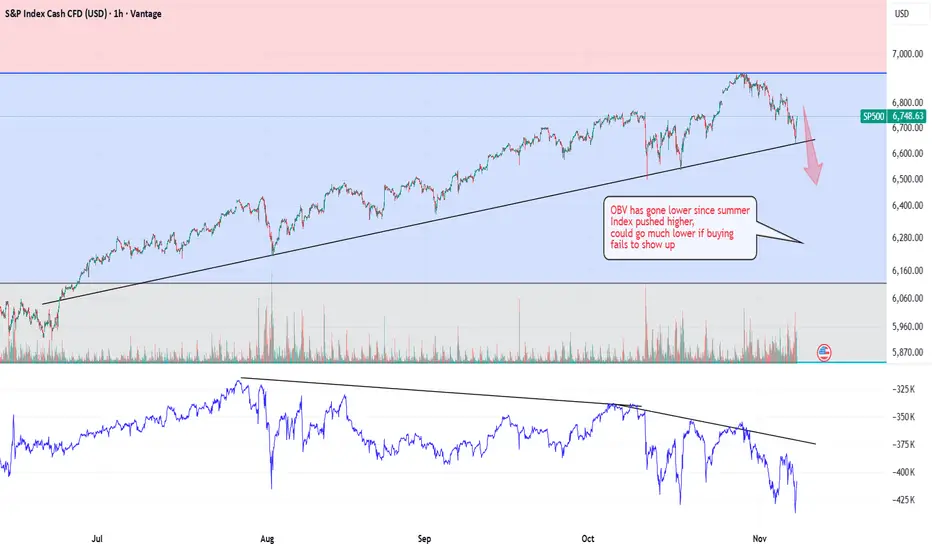
SP500 is weak about to drop through trend line Fib 1.618 madeBearish set up, (following on from my other post where the price at the top of the market hit a fix 1.618 extension of the prior recent down move almost to the tick, which I told people about before it happened as a great potential inflection point) Yes I am short.
The trendline must hold for the bulls,
The OBV on balance volume suggests weakness in the index
Suggesting the trend line will not hold for long, unless buying comes in
Next stop back will be lower, most likely with bear market rallies
I think we will test 4800 again between now and end of next year.
If a sell off starts it could be extreme, the market is weak.
There are hardly any bears left, mutual funds have minimal cash on side lines left to buy.
Government shutdown in USA has woken people up to having not everything in the markets and need cash on hand to pay bills if they dont get paid by Government.
We are only down 4% from a potential top, imagine selling the top within 4% in a few years time that will be acceptable for most traders. Even as a hedge and to bank some of those gains.
If it turns out to be a top, just sell a few contacts each few until you build up a nice sized position. Watch out for bear market rallies. Ifs a bear they will be super sharp upside, and then you can sell them at size. Look back historically to see how much these bear market rallies rise,
I notice that you can draw a nice downside trend line in a bear market and just sell every time the price hits that trend line to be very well off if it turns out to be a bear. not advice only fictional trading, of those that work hard at trading to make theirs and others dreams come true. Be grateful that you saw this now and took the time to understand the risks and potential gains because it could change your life

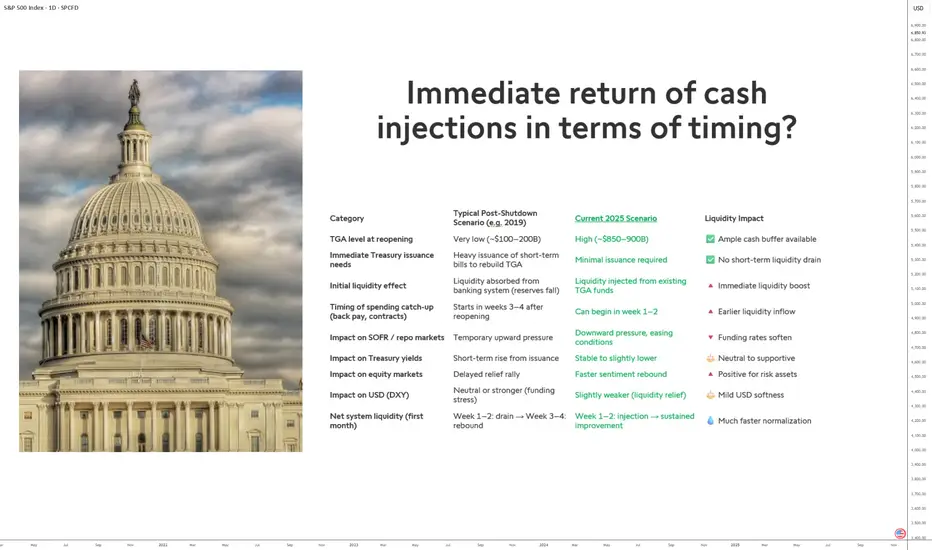
End of the 2025 Shutdown: Immediate Impact on LiquidityThe reopening of the U.S. government at the end of the 2025 shutdown is expected to trigger a swift return of liquidity to financial markets. This recurring phenomenon will have a distinct magnitude this time due to the specific conditions of the U.S. Treasury General Account (TGA) and the current federal funding structure.
1) A fiscal context unlike previous shutdowns
In past episodes, notably in 2019, the U.S. Treasury exited the shutdown with very low cash balances—typically between $100 and $200 billion. To rebuild this buffer, it had to issue large amounts of short-term Treasury bills, which drained liquidity from the banking system as investors used reserves to buy the securities.
In 2025, the situation is reversed. The Treasury holds a high cash balance—estimated between $850 and $900 billion—because the federal government’s account at the Fed (the TGA) was replenished at the end of September. This provides ample room to finance near-term public spending without issuing new debt. The result is an absence of pressure on money markets and stable bank reserves.
2) Liquidity injections from day one
With abundant cash reserves, the Treasury can promptly resume pending payments—federal salaries, public contracts, and suspended programs. These payments act as direct liquidity injections into the financial system, starting within the first weeks following the end of the shutdown.
In previous reopenings, this process began only after three to four weeks. In 2025, it could start as early as week one or two, significantly shortening the normalization timeline for market liquidity.
3) Moderate but positive market effects
This faster liquidity return should lead to:
• unchanged or slightly lower bond yields, given steady demand and the absence of additional issuance;
• a slightly weaker dollar, reflecting easier financing conditions.
Overall, this points to a quicker and more orderly normalization of the monetary system compared to 2019, potentially supporting risk assets in the short term.
DISCLAIMER:
This content is intended for individuals who are familiar with financial markets and instruments and is for information purposes only. The presented idea (including market commentary, market data and observations) is not a work product of any research department of Swissquote or its affiliates. This material is intended to highlight market action and does not constitute investment, legal or tax advice. If you are a retail investor or lack experience in trading complex financial products, it is advisable to seek professional advice from licensed advisor before making any financial decisions.
This content is not intended to manipulate the market or encourage any specific financial behavior.
Swissquote makes no representation or warranty as to the quality, completeness, accuracy, comprehensiveness or non-infringement of such content. The views expressed are those of the consultant and are provided for educational purposes only. Any information provided relating to a product or market should not be construed as recommending an investment strategy or transaction. Past performance is not a guarantee of future results.
Swissquote and its employees and representatives shall in no event be held liable for any damages or losses arising directly or indirectly from decisions made on the basis of this content.
The use of any third-party brands or trademarks is for information only and does not imply endorsement by Swissquote, or that the trademark owner has authorised Swissquote to promote its products or services.
Swissquote is the marketing brand for the activities of Swissquote Bank Ltd (Switzerland) regulated by FINMA, Swissquote Capital Markets Limited regulated by CySEC (Cyprus), Swissquote Bank Europe SA (Luxembourg) regulated by the CSSF, Swissquote Ltd (UK) regulated by the FCA, Swissquote Financial Services (Malta) Ltd regulated by the Malta Financial Services Authority, Swissquote MEA Ltd. (UAE) regulated by the Dubai Financial Services Authority, Swissquote Pte Ltd (Singapore) regulated by the Monetary Authority of Singapore, Swissquote Asia Limited (Hong Kong) licensed by the Hong Kong Securities and Futures Commission (SFC) and Swissquote South Africa (Pty) Ltd supervised by the FSCA.
Products and services of Swissquote are only intended for those permitted to receive them under local law.
All investments carry a degree of risk. The risk of loss in trading or holding financial instruments can be substantial. The value of financial instruments, including but not limited to stocks, bonds, cryptocurrencies, and other assets, can fluctuate both upwards and downwards. There is a significant risk of financial loss when buying, selling, holding, staking, or investing in these instruments. SQBE makes no recommendations regarding any specific investment, transaction, or the use of any particular investment strategy.
CFDs are complex instruments and come with a high risk of losing money rapidly due to leverage. The vast majority of retail client accounts suffer capital losses when trading in CFDs. You should consider whether you understand how CFDs work and whether you can afford to take the high risk of losing your money.
Digital Assets are unregulated in most countries and consumer protection rules may not apply. As highly volatile speculative investments, Digital Assets are not suitable for investors without a high-risk tolerance. Make sure you understand each Digital Asset before you trade.
Cryptocurrencies are not considered legal tender in some jurisdictions and are subject to regulatory uncertainties.
The use of Internet-based systems can involve high risks, including, but not limited to, fraud, cyber-attacks, network and communication failures, as well as identity theft and phishing attacks related to crypto-assets.
Nov 6 - a move down is likely, but not certainOn SPX we're at double resistance. If we sell off here, we could have another C down, in which case, another bear trap may form (see chart at end of video). The market is very choppy and probably will continue to be for some time. Gold looks like it will test it's lows. BTC looks like it may test it's lows. Oil is still holding the 18ma, but it's running out of time to do something else.

SP500 Consolidated Bullish range because rebounded stronglyThe SP 500 is currently consolidating within a bullish range after price action recently tested key support levels and rebounded strongly. This suggests that buyers are defending the lower boundary of the range, maintaining the broader bullish momentum.
On Wednesday, U.S. equities gained, led by a rebound in technology-related shares. Additionally, U.S. private payrolls data came in stronger than expected, signalling continued labour market resilience and supporting investor sentiment. Meanwhile, the U.S. dollar extended its gains from last week, reflecting confidence in the U.S. economy.
If bullish momentum continues and the current support holds, we could see further upside potential, with the SP 500 possibly targeting the 6,900–6,980 range in the near term.
You may find more details in the chart.
Trade wisely best of Luck buddies.
Ps; Support with like and comments for better analysis Thanks for Supporting.

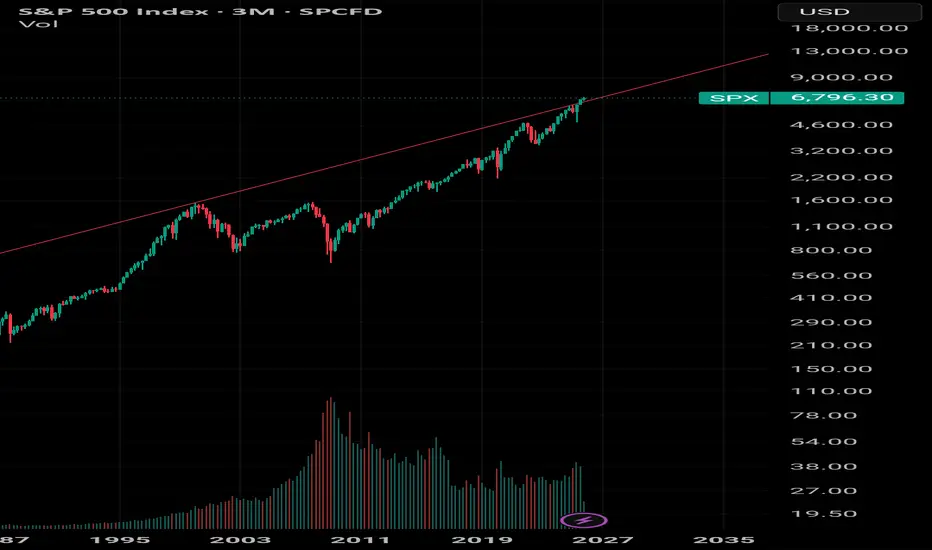
The amazing 100 year S&P log chartI love going back to this chart which tells us everything we need to know when asking the question why is buffet sitting in so much cash. It's an amazing chart and you can see what will Happen, what needs to happen but not when. Needless to say we are still above the red line.