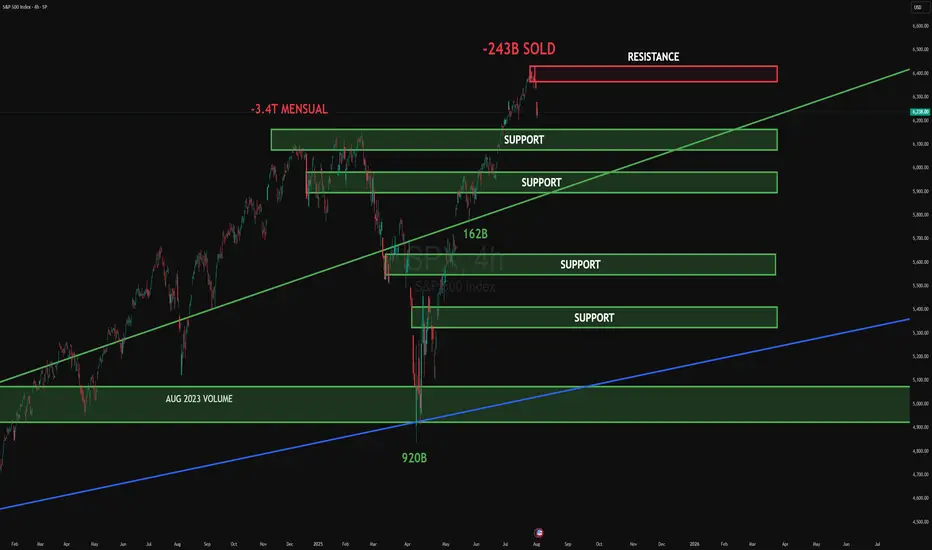
SPX CORRECTIONThe S&P 500 Index (SPX) faced strong rejection at the upper resistance zone near 6,400, where -243B was sold, signaling aggressive institutional distribution. This area aligns with the broader -3.4T monthly level, confirming it as a significant ceiling.
Multiple support levels lie below. The first key zone near 6,200 is being tested. If broken, deeper liquidity pockets are visible around 6,000 and 5,700, where 162B was previously absorbed. Further down, the high-volume August 2023 level near 5,000 remains a macro support with 920B of institutional activity.
Upside target (if reclaimed): 6,400
Downside target (if breakdown continues): 5,700 → 5,000
#SPX #globaltrade #investment #investing #stockmarket #wealth #realestate #markets #economy #finance #money #forex #trading #price #business #currency #blockchain #crypto #cryptocurrency #airdrop #btc #ethereum #ico #altcoin #cryptonews #Bitcoin #ipo
Trade ideas
SPX500 Dips Ahead of NFP as Tariff Risks RiseSPX: S&P 500 Dips to Close July — Still Positive for the Month Amid Tariff Tensions & Fed Uncertainty
The S&P 500 retreated in the final session of July, weighed down by renewed tariff concerns and lingering uncertainty around the Fed’s next move. Despite the late pullback, the index remains positive for the month overall.
Looking ahead, non-farm payrolls (NFP) and U.S. jobs data are expected to have a strong impact on market direction. In addition, August 1st marks a key date for potential tariff developments, which could trigger further volatility.
Technical Outlook – SPX500
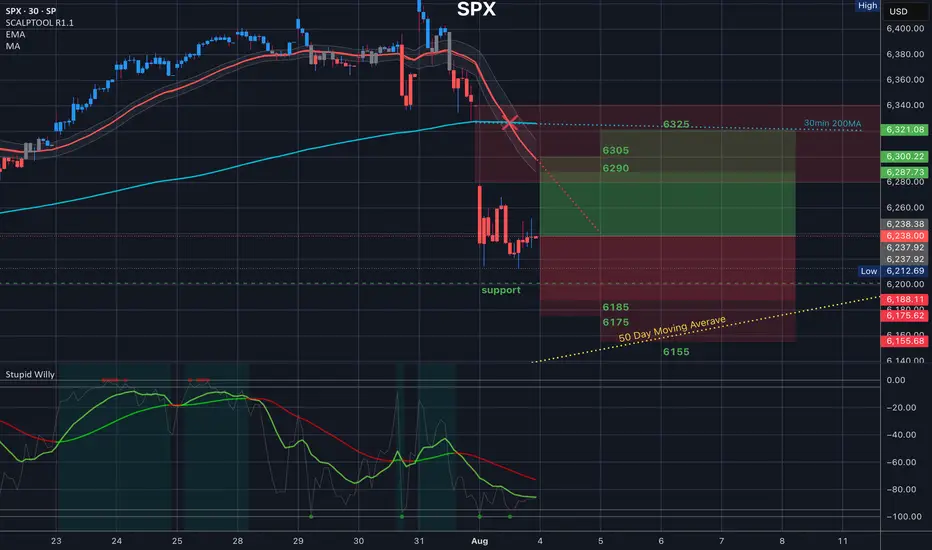
The index has dropped approximately 2.5% since yesterday and maintains a bearish bias as long as it trades below 6283. If the price continues to slide, the next downside target is 6246, with further support at 6223.
However, if the price manages to close above 6289 on the 1H timeframe, it could trigger a bullish recovery toward 6320 and 6341.
Pivot Line: 6283
Support Levels: 6246 • 6223
Resistance Levels: 6320 • 6341


$SPX Analysis, Key Levels & Targets 8.4.25
Today’s Trading Range - we have a great range expansion here from last Friday’s drop. Some interesting targets here. Let me know what you see.
SPX: Investors` defensive positioning? The past week brought a flurry of important US macro data and a high market volatility in line with it. In addition, the FOMC meeting brought up increased nervousness regarding Fed's view on current and future macroeconomic developments. As Fed Chair Powell informed the public, the inflation is perceived to pick-up a bit as a reflection of imposed trade tariffs, but the Fed is not expecting that it will have a significant effect on increasing inflation, but only the one-off effect. Future Fed moves will continue to be data dependent and risk-assessed, in which sense, a direct answer to potential September rate cut was not provided by Fed Chair Powell.
Although Friday brought up some major market corrections in the S&P 500, Thursday's trading session was the one to bring major sentiment and indication over forthcoming correction. Namely, Thursday started in a positive manner, where the index reached a new all time highest level at 6.427, but soon after the market tumbled down, ending the trading day at 6.333. Futures were traded lower on Friday, where the S&P 500 was opened by 1,5% lower, ending the week at 6.238. These movements during the last two trading days are quite important because such strong moves in the value of index could be imposed only by institutional investors, showing their sentiment regarding the macro environment expectations at this moment.
Much of the negative market sentiment was driven by surprisingly weak non-farm payroll data of only 73K in July, which was below market estimate of 110K. At the same time, the unemployment rate modestly picked up in July to 4,2%, from 4,1% posted previously. Some analysts are noting that this could be a summer seasonal effect, however, investors are concerned that this could be a sign of a weakening US economy, due to implemented trade tariffs. During the time of writing this article, CNBC posted a news that the U.S. President Trump ordered immediate release of a duty of a Commissioner of labor statistics, due to continued posts of inaccurate labor data and its frequent revisions, also putting doubts that the July figure of 73K is accurate.
Regardless of actual accuracy of the US jobs data, investors continue to be concerned regarding the effects of implemented trade tariffs on earnings and growth of US companies. As analysts are noting, some of them are trying to lock in gains as earnings risks emerge, but with future uncertainties, a defensive positioning of investors might be wider in the coming period.
The $CURE For Your Healthcare PortfolioHey team,
Everyone knows how the health sector is beat up.
The Trump administration hasn't shown any mercy to the health and pharma sectors. They’ve been hammering Big Pharma with a mix of fiery rhetoric and aggressive policy moves. Trump has brought back his “most favored nation” drug pricing plan, tying Medicare reimbursements to what other countries pay, slashing profits for drugmakers who’ve been charging Americans a fortune.
As a result, some of the top health stocks such as NYSE:PFE , NYSE:LLY , NYSE:JNJ , and NYSE:UNH , among many others, have been suffering.
We need, however, to understand that healthcare is sometimes cyclical, and there are some clues that tell us what's likely to happen next:
For most years, AMEX:XLV (health index ETF) is highly correlated with the $SP:SPX. Historically, when this correlation breaks, it's either because healthcare is lagging behind the S&P 500, or because the S&P 500 is crashing, and healthcare is holding well because healthcare is recession-resistant. Typically, these moments of uncorrelation are followed by a very well-performing healthcare sector.
AMEX:XLV / SP:SPX is now at a 25-year low! Healthcare stocks have never been so low in 25 years compared to the benchmark.
While the S&P P/E ratio is at 28, healthcare is at 14. This shows a potentially underdeveloped sector.
The spread between healthcare and the rest of the stock market is very large and unnatural. Considering this, it's more likely that it will regress to its mean and recover. You can see this in the Dual Z-Score indicator in the chart.
Additionally, the US midterms are coming, which can bring policy changes that might favor healthcare again.
Now, you might be wondering: Why invest in AMEX:CURE and not in AMEX:XLV ?
I plan to allocate around 2% of my portfolio to CURE, the 3x leveraged ETF, because it's an easier way to achieve the proper Kelly allocation to this sector, a sector that I believe will recover over the next couple of years. The leverage provided by this ETF will help compound returns.
Is this strategy risky?
Well, CURE is 3x more volatile than XLV, but this is the way I see it: healthcare is already too beat up to continue declining sharply from here. Additionally, healthcare is recession-resistant, meaning that it should not be too affected if the US economy suffers, enters a recession, or if unemployment numbers increase.
I think CURE gives me a potentially good risk/reward ratio, considering that if healthcare catches up with the S&P 500, CURE could return approximately (and very roughly) 100%.
Quick note: I'm just sharing my journey - not financial advice! 😊

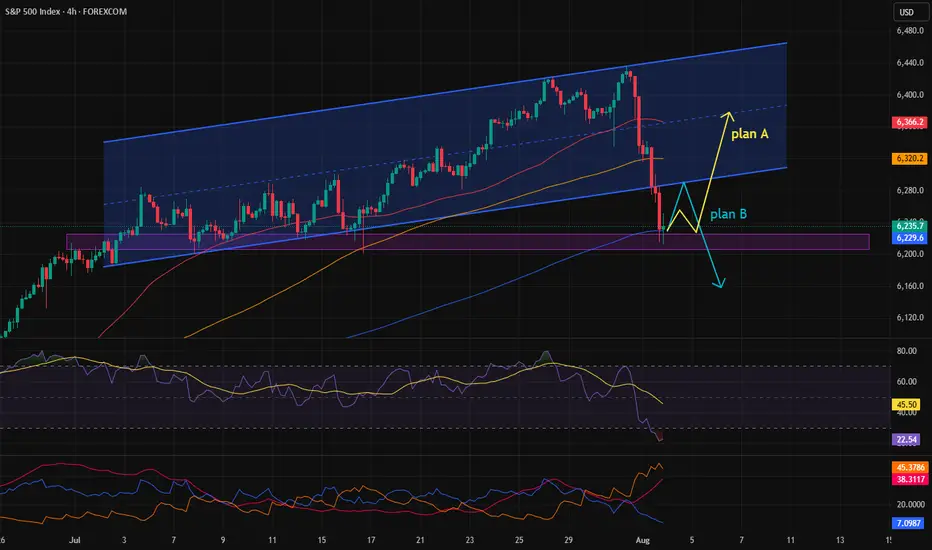
S&P 500 Bullish Rounding Bottom in PlayS&P 500 continues its upward trajectory, supported by a clearly defined rounding bottom formation. Price has successfully broken above the neckline resistance, followed by a technical pullback which was met with a strong buy reaction, validating this zone as a key demand area.
This pullback area now acts as a critical structural base and the current bounce reinforces bullish continuation bias. The active plan is to accumulate within the buy-back zone and follow the path laid out in the chart towards the projected upside targets.
Drop your stock requests in the comments for a quick analysis, only US-listed stocks will be reviewed under this post.

S&P 500: Bearish For The Short Term! Sell It!Welcome back to the Weekly Forex Forecast for the week of July 28 - Aug 1st.
In this video, we will analyze the following FX market for the week of Aug 4-8th:
S&P 500 (ES1!)
The S&P 500 rose Friday to fresh highs, following a busy week of tariff updates and earnings. The S&P ended the week with its fifth straight record close, its longest such streak in over a year.
No reason to consider selling. Wait for pullbacks to FVGs for high probability buys.
FOMC and NFP loom. Be careful to avoid new entries during news times.
Enjoy!
May profits be upon you.
Leave any questions or comments in the comment section.
I appreciate any feedback from my viewers!
Like and/or subscribe if you want more accurate analysis.
Thank you so much!
Disclaimer:
I do not provide personal investment advice and I am not a qualified licensed investment advisor.
All information found here, including any ideas, opinions, views, predictions, forecasts, commentaries, suggestions, expressed or implied herein, are for informational, entertainment or educational purposes only and should not be construed as personal investment advice. While the information provided is believed to be accurate, it may include errors or inaccuracies.
I will not and cannot be held liable for any actions you take as a result of anything you read here.
Conduct your own due diligence, or consult a licensed financial advisor or broker before making any and all investment decisions. Any investments, trades, speculations, or decisions made on the basis of any information found on this channel, expressed or implied herein, are committed at your own risk, financial or otherwise.

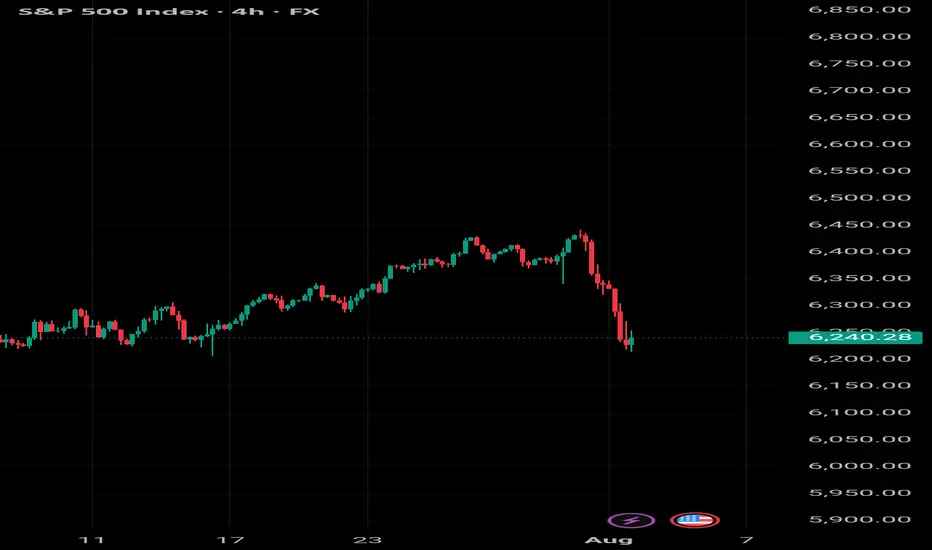
Possible return of the stock market downtrend.After a sharp drop due to last week's news, the S\&P stock index is now at a critical point.
Given the strong bullish trend it had previously, there’s a possibility we might see a return to the uptrend this week.
What the Next CPI Print Could Do to the S&P500What the Next CPI Print Could Do to the S&P500
A technical and macro setup ahead of the inflation release
Next week’s CPI report could be one of the most important data points of the quarter, not just for the Fed, but for traders watching the S&P500 (SPX) at these elevated levels.
We’ve seen inflation data act like a volatility trigger in recent months, especially when it diverges from market expectations. And with the S&P flirting with key resistance, the stage is set for either a breakout or a reversal.
Let’s break down both the macro implications and the technical chart setup heading into the release.
Why CPI Matters?
If headline CPI comes in hot, markets may price in fewer Fed cuts this year. Yields spike and SPX often reacts with a sharp pullback.
If inflation cools faster than expected, the Fed may stay dovish. That typically gives SPX and risk assets broadly room to breathe higher.
Current expectations:
- Headline CPI: 3.2 percent
- Core CPI: 3.4 percent
Anything above those numbers is risk-off. Anything below supports the soft landing narrative.
Technical Setup on SPX
On the 4H and daily chart, here’s what we’re seeing:
- Price hovering around a key resistance zone between 5,660 and 5,680
- Rising wedge structure starting to form, typically a bearish sign near market tops
- Bearish RSI divergence on 1D chart
- Volume has been declining on recent pushes higher, showing lack of conviction
Key Levels
- Support: 5,615 and 5,575
- Breakout Target (if CPI is dovish): 5,750 to 5,770
- Downside Target (if CPI surprises hot): 5,500 to 5,480
Watch for a volatility spike on the release and be cautious about chasing the first move.
My Play
I’m personally staying flat heading into the data.
Too much chop, not enough conviction. But I’ll be watching for:
- A false breakout trap above 5,680 followed by reversal as a possible short setup
- Or a clear retest and hold above 5,700 with volume, which may confirm further upside
CPI has become the new FOMC. Be patient and reactive, not predictive.
Final Thought
CPI prints used to be background noise. Not anymore.
This one matters, and SPX is sitting in a technical pressure cooker.
Whatever side you lean toward, come in with a plan and don’t trade the first candle.
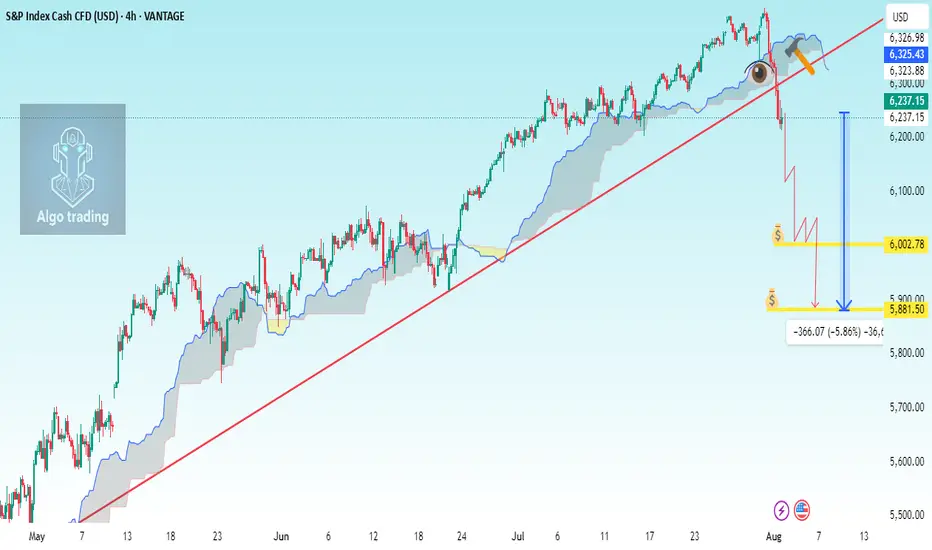
SP500 H4 analysis Breakdown TrendlineChart Components Observed:
Ichimoku Cloud: For trend and support/resistance visualization.
Uptrend line (manually drawn): Connecting higher lows since early May 2025.
Support break: Price has recently broken below the trendline and below the Ichimoku cloud.
Current Price: 6,237.15 (▼ -1.64%)
---
📉 Analysis Summary:
The trendline and Ichimoku cloud were acting as major dynamic support.
A bearish breakdown has occurred — price closed below the trendline and the cloud.
This suggests a potential trend reversal or correction underway.
---
🎯 Trade Setup Suggestion (Short Entry)
🟢 Entry Target (Short Position):
Sell Entry: Around 6,237 – 6,245 (current zone or slight pullback)
If price retests the underside of the broken trendline/cloud, that's a better entry confirmation.
📉 Take Profit Levels:
1. TP1: 6,130 (recent consolidation zone)
2. TP2: 6,000 (psychological + historical support)
3. TP3: 5,880 (next major support based on previous consolidation in early June)
🛡 Stop Loss:
SL: 6,300 – 6,310 (above the cloud and broken trendline for safe buffer)
---
📊 Risk Management:
Position size should be based on your account size, using 1–2% risk per trade.
Watch the S&P futures and macro news (e.g., U.S. data, Fed news) to avoid whipsaw.
US500 Pulls Back from 6,400– Correction or Trend Shift?The index has rejected the 6,400 🔼 resistance zone with a strong bearish candle, pulling back toward the 6,200 🔽 support region. Price is still trading within a bullish structure, but this drop may signal early signs of exhaustion.
Support Levels: 6,200 🔽, 6,100 🔽, 6,000 🔽
Resistance Levels: 6,300 🔼, 6,400 🔼
Bias:
🔼 Bullish: If price holds above 6,200 and reclaims 6,300, the uptrend remains intact and bulls may reattempt a push toward 6,400.
🔽 Bearish: A daily close below 6,200 could open a deeper retracement toward 6,100 or even 6,000.
📛 Disclaimer: This is not financial advice. Trade at your own risk.

Good moment to tighten your stop losses!After market reaction to jobs data, it's a good idea to take a look at the indeces and be prepared for a correction, whatever size it is.

S&P500 corrective pullback key support at 6200Key Support and Resistance Levels
Resistance Level 1: 6316
Resistance Level 2: 6374
Resistance Level 3: 6430
Support Level 1: 6200
Support Level 2: 6112
Support Level 3: 6073
This communication is for informational purposes only and should not be viewed as any form of recommendation as to a particular course of action or as investment advice. It is not intended as an offer or solicitation for the purchase or sale of any financial instrument or as an official confirmation of any transaction. Opinions, estimates and assumptions expressed herein are made as of the date of this communication and are subject to change without notice. This communication has been prepared based upon information, including market prices, data and other information, believed to be reliable; however, Trade Nation does not warrant its completeness or accuracy. All market prices and market data contained in or attached to this communication are indicative and subject to change without notice.

S&P 500 Daily Chart Analysis For Week of August 1, 2025Technical Analysis and Outlook:
During the trading activity of the previous week, the S&P 500 Index displayed a predominantly bearish movement after completing our Outer Index Rally target of 6420, as highlighted in the prior week’s Daily Chart Analysis, with the primary objective now being to plug our Mean Support at 6200.
It is essential to recognize that the current price movement may trigger a significant further pullback to the Mean Support level of 6090. Following this downturn, it is expected that the index will resume its upward momentum, aiming for a retest of the Outer Index Rally peak at 6420.

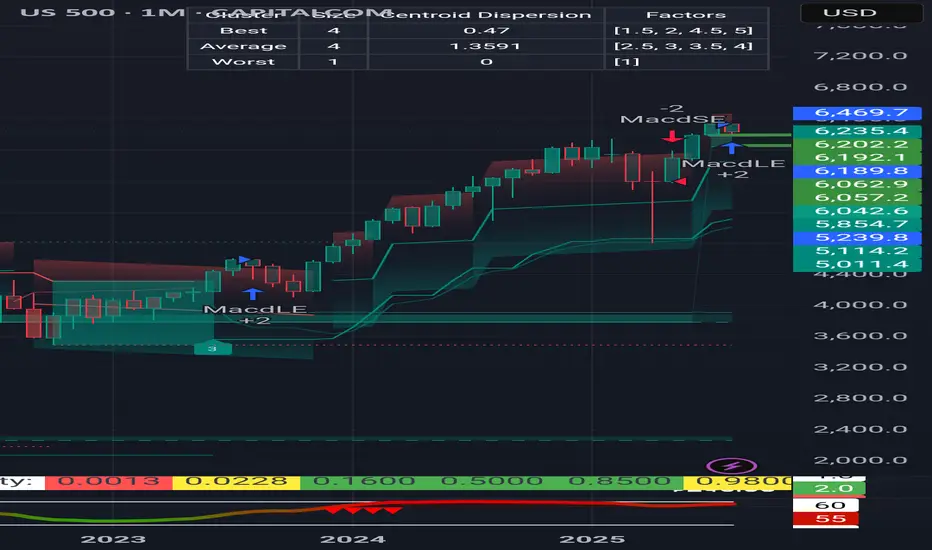
Correction will be to 6050-6190, probably the upper limit Now I notice something very important and things and the analyses of many actually coincide. Monthly support from the accumulated volume lies between 6050 and 6170. 4h indicators show a clear reversal. Separately, at these levels are the previous ATH. In my opinion, it is possible to stop even at 6180-6190. We will probably start with a gap on Monday. Now here comes the moment and over the weekend what will take place as conversations and statements in the media, but it is very likely that the minimum could happen as early as Monday night (USA time) or by Tuesday. I agree that this correction was necessary and should have happened as soon as possible because things became difficult even for bulls like me.