SPXShift prediction to the right.
Global market cooler anticipated. Crypto should be hit the hardest and fastest.
Most anticipating rally continuation like post-COVID...
I think that will cause a surprise.
Trade ideas

SPX | Daily Analysis #9 - 30 October 2025Hello and welcome back to DP,
Market Review:
Well, yesterday was a significant day across global markets — from U.S. stock indexes to crypto assets — with investors digesting major developments from the Federal Reserve and the renewed U.S.–China trade dialogue. The yesterday’s market summery:
- Monetary policy / central bank: The Fed’s decision to cut interest rates by 25 basis points (as expected) was overshadowed by Powell’s cautious tone about future cuts. However, optimism was tempered by comments from Jerome Powell indicating that another rate cut in December is not guaranteed. That caused some caution in the market.
- S&P 500: 6,890.59 (down ~0.30 points). Dow Jones Industrial Average: 47,632.00 (down ~74.37 points, ~0.2%). Nasdaq Composite: 23,958.47 (up ~130.98 points, ~0.5%).One of the biggest drivers: Nvidia Corporation became the first public company to reach a roughly $5 trillion market valuation, boosting the tech segment.
- Trade & geopolitics: The U.S. signalled progress in trade and industrial policy with China: comments from Donald Trump hinted at easing of some tariffs (e.g., on fentanyl-related goods) and possible cooperation on rare-earth export controls. The U.S. will reduce some tariffs on Chinese goods: for example, tariff on certain chemicals tied to fentanyl production will go from 20 % down to 10 %, and overall U.S. duties on Chinese imports shift from ~57 % to ~47 %. China agreed to resume more agricultural purchases from the U.S. (e.g., soybeans, sorghum) and to postpone export restrictions on rare earth materials for about one year.
- And for watching ahead is earnings: Big names like Apple Inc. (AAPL) and Amazon .com Inc. (AMZN) are due after market close, which could influence the market.
- The overall crypto market cap held steady near $3.2 trillion, with sentiment described as “risk-on, but wary.”
1H – 4H Technical Analysis:
As observed on the chart, price has broken below the bullish trend line and moved through yesterday’s key demand zone, signaling a potential shift in short-term momentum.
Currently, the price is declining, approaching lower demand areas. As of this analysis, SPX is retracing and may find temporary support around the 6,842 level, where a short-term rebound toward 6,877 is possible before the next move unfolds.
However, if bullish momentum fails to hold above that level, a drop through the gap zone could follow, pushing price action toward the 6,810 support region, which aligns with the next major demand zone on the 4-hour chart. This zone may serve as a stronger accumulation area for potential medium-term buyers.
From a broader perspective, the recent U.S.–China trade truce provides a fundamental tailwind for the market — a bullish catalyst that could limit downside extensions and support sentiment in the coming sessions.
It’s also notable that the S&P 500’s annual return now stands near +16 %, compared with roughly +24 % two years ago. This suggests that while growth has moderated, there remains room for further upside if macro conditions stay supportive and earnings momentum continues.
Disclaimer:
This content is for informational purposes only and does not constitute financial or investment advice. © DIBAPRISM
Amir D.Kohn

THE SPX (S&P500) IS HEADING UPWARDS! time to buyThe SPX has been stuck inside an upward channel for many weeks and has been bouncing between both support and resistance levels. It has recently broken through a powerful resistance zone which was holding it... which means it is now very likely to keep heading to the upside.

Blockchain’s Role in Different Trading Segments1. Introduction: Redefining Trust in the Trading World
The modern trading ecosystem — spanning financial markets, commodities, forex, and digital assets — relies heavily on trust, transparency, and speed. For decades, intermediaries such as brokers, clearing houses, and central depositories have played a vital role in ensuring smooth settlements and recordkeeping. However, this system is often plagued by inefficiencies, high transaction costs, and occasional lapses in security or accountability.
Enter blockchain technology — a decentralized ledger system that offers immutable, transparent, and secure recordkeeping. By eliminating the need for traditional intermediaries, blockchain has the potential to revolutionize how trades are executed, verified, and settled across different segments of the global financial market.
Blockchain’s role in trading is not confined to cryptocurrencies. Its applications now extend to stock markets, commodity exchanges, forex trading, derivatives, and even carbon credit and energy trading. Each of these sectors can benefit from blockchain’s ability to automate trust and reduce systemic inefficiencies.
2. Understanding Blockchain in the Context of Trading
At its core, blockchain is a distributed database shared among a network of participants. Once data — such as trade details or payment confirmations — is recorded on the blockchain, it cannot be altered without the consensus of the network. This ensures that all trading participants operate from a single, verified source of truth.
In trading terms:
Each transaction (buy or sell order) is a “block.”
These transactions are chained together chronologically.
The system is decentralized, meaning no single entity can manipulate data.
This architecture has far-reaching implications for global markets:
Instant settlements instead of multi-day clearing cycles.
Elimination of counterparty risk, as smart contracts execute automatically.
Lower transaction costs due to reduced intermediary dependence.
Enhanced auditability, since all data is time-stamped and verifiable.
3. Blockchain in Stock Market Trading
The traditional equity trading system involves multiple intermediaries — brokers, stock exchanges, clearing corporations, and custodians — all performing specific functions such as matching orders, confirming trades, and settling securities. While effective, this system is slow and costly.
How Blockchain Transforms Stock Trading
Real-Time Settlement: Blockchain can reduce the settlement period from the current T+2 (trade date plus two days) to near-instantaneous settlement (T+0). This significantly reduces liquidity risk and capital lock-in.
Tokenization of Assets: Shares can be represented as digital tokens on a blockchain. This enables fractional ownership, making high-value stocks accessible to smaller investors.
Decentralized Exchange Platforms: Decentralized stock trading platforms can facilitate peer-to-peer transactions without intermediaries, ensuring transparency and reducing costs.
Immutable Recordkeeping: Corporate actions such as dividends, bonus issues, and stock splits can be recorded permanently and automatically distributed using smart contracts.
Examples
Nasdaq Linq: One of the early adopters of blockchain, Nasdaq used the Linq platform to record private securities transactions, demonstrating efficiency and transparency.
India’s NSE pilot programs: The National Stock Exchange of India has experimented with blockchain for know-your-customer (KYC) data and settlement tracking.
4. Blockchain in Forex (Foreign Exchange) Trading
The foreign exchange market is the world’s largest financial market, with daily volumes exceeding $7 trillion. Yet, it remains fragmented, opaque, and reliant on central intermediaries like banks and payment processors.
Blockchain’s Advantages in Forex
Cross-Border Settlement: Blockchain enables direct peer-to-peer currency exchange without intermediaries, drastically cutting transfer times and fees.
Transparency and Auditability: All trades recorded on a blockchain are verifiable, reducing manipulation and fraud risks.
Smart Contracts for FX Swaps: Automated execution of forex swaps and forward contracts ensures minimal counterparty risk.
24/7 Accessibility: Unlike traditional systems, blockchain-based FX networks can operate continuously without downtime.
Example
RippleNet and Stellar Lumens use blockchain to enable instant cross-border currency transfers with minimal costs, challenging the dominance of SWIFT.
5. Blockchain in Commodity Trading
Commodity trading — involving oil, metals, and agricultural goods — often suffers from documentation delays, supply chain opacity, and settlement inefficiencies. Blockchain brings trust and traceability to this sector.
Applications
Smart Contracts for Trade Settlement: Automatically execute trades once contractual conditions are met (e.g., delivery confirmation triggers payment).
Supply Chain Transparency: Blockchain can trace commodities from extraction or production to final sale, ensuring authenticity and sustainability.
Tokenization of Commodities: Commodities like gold, crude oil, or carbon credits can be represented digitally, making them easier to trade and fractionalize.
Reduction in Paperwork: Blockchain eliminates the need for multiple physical documents like bills of lading, inspection certificates, and letters of credit.
Example
Vakt, a blockchain-based platform supported by BP and Shell, digitizes the post-trade processes in oil markets, improving efficiency and reducing fraud.
6. Blockchain in Derivatives and Futures Markets
Derivatives — including futures, options, and swaps — are complex instruments often involving multiple intermediaries. Blockchain’s smart contracts can automate these trades and settlements with precision.
Benefits
Instantaneous Settlement: Reduces the time gap between contract execution and settlement, minimizing counterparty and liquidity risks.
Automated Margin Calls: Smart contracts can automatically adjust margin requirements based on real-time price movements.
Transparency: Blockchain’s shared ledger ensures all participants view the same data, reducing disputes.
Regulatory Compliance: Blockchain enables real-time reporting to regulators, improving oversight.
Example
DTCC (Depository Trust & Clearing Corporation), which handles trillions in derivatives, has explored blockchain for trade reporting and settlement to enhance efficiency.
7. Blockchain in Cryptocurrency Trading
Cryptocurrency trading is the first and most obvious area where blockchain has already established dominance. Cryptos like Bitcoin and Ethereum are themselves blockchain-native assets, and their trading happens entirely on blockchain-based exchanges.
Innovations
Decentralized Exchanges (DEXs): Platforms like Uniswap and PancakeSwap allow traders to exchange tokens directly from their wallets without intermediaries.
Liquidity Pools: Smart contracts automatically match buyers and sellers, ensuring market liquidity.
Transparency and Security: Every trade is publicly recorded on the blockchain, ensuring full auditability.
Challenges
High volatility, lack of regulation, and scalability limitations still pose obstacles to mainstream adoption.
8. Blockchain in Energy and Carbon Credit Trading
The rise of sustainability-focused finance has introduced new markets like carbon credits and renewable energy certificates. Blockchain ensures authenticity and prevents double-counting in these emerging asset classes.
Applications
Tokenized Energy Certificates: Renewable energy output (solar, wind, hydro) can be tokenized and traded on blockchain platforms.
Carbon Credit Trading: Blockchain ensures each credit is unique, traceable, and not resold multiple times.
Peer-to-Peer Energy Trading: Consumers with solar panels can directly sell surplus energy to others through blockchain-enabled microgrids.
Example
Power Ledger (Australia) uses blockchain to enable P2P renewable energy trading, giving consumers control over energy distribution and pricing.
9. Blockchain in Real Estate and Asset Tokenization
Although not traditionally viewed as a “trading” sector, real estate is rapidly evolving into a digital trading marketplace through blockchain tokenization.
Benefits
Fractional Ownership: High-value properties can be divided into digital tokens, allowing small investors to participate.
Instant Liquidity: Instead of lengthy paperwork, property tokens can be traded instantly on secondary markets.
Transparency and Authenticity: Land titles and ownership histories recorded on blockchain reduce fraud.
Example
Platforms like RealT and Propy are pioneering blockchain-based real estate trading with tokenized assets.
10. Blockchain’s Role in Regulatory Compliance and Risk Management
Beyond execution and settlement, blockchain plays a crucial role in compliance, auditing, and risk management.
Regulatory Advantages
Real-Time Monitoring: Regulators can access immutable records of trades in real-time.
KYC/AML Integration: Blockchain-based identity systems simplify customer verification while maintaining data privacy.
Reduced Fraud and Errors: Tamper-proof records and automated reconciliations enhance overall market integrity.
Example
The European Securities and Markets Authority (ESMA) has studied blockchain-based trade reporting to enhance transparency across the EU markets.
11. Challenges and Limitations
Despite its immense potential, blockchain adoption in trading faces practical and regulatory hurdles:
Scalability Issues: Large exchanges process millions of transactions daily; most blockchains still struggle with high throughput.
Regulatory Uncertainty: Many governments have yet to create clear frameworks for blockchain-based trading systems.
Integration Complexity: Legacy financial infrastructure is deeply entrenched, making transition costly and time-consuming.
Privacy Concerns: While transparency is valuable, full data visibility may conflict with confidentiality requirements in institutional trading.
Energy Consumption: Proof-of-work systems like Bitcoin consume significant power, though newer consensus models (e.g., proof-of-stake) are more efficient.
12. The Future of Blockchain in Global Trading
As the technology matures, blockchain is expected to become the backbone of next-generation trading infrastructure. The future may see:
Fully tokenized stock exchanges, where equities, bonds, and derivatives exist as digital assets.
Interoperable blockchains, allowing seamless transfers between different networks and asset classes.
AI and blockchain integration, combining data-driven trading strategies with transparent execution.
Central Bank Digital Currencies (CBDCs) simplifying settlement between global financial institutions.
The convergence of blockchain, AI, and IoT will lead to hyper-efficient, transparent, and inclusive trading ecosystems — reshaping how capital, commodities, and data flow across borders.
13. Conclusion
Blockchain’s entry into the trading world represents a paradigm shift — from trust-based intermediaries to trustless digital verification. Whether in stock markets, forex, commodities, or emerging asset classes like carbon credits, blockchain introduces unmatched levels of transparency, efficiency, and inclusiveness.
While challenges persist, the direction is clear: blockchain is not just a supporting technology; it is the new foundation of global trading architecture. The world’s markets are moving steadily toward an era where every trade, every asset, and every participant is digitally connected in a decentralized, verifiable, and borderless network of trust.
US500 Recovery on Imminent US Government Shutdown DealFundamental Analysis
The US500 is driven by strong Q3 earnings and a recovery in risk sentiment due to the imminent resolution of the US government shutdown. Market odds for a December Fed rate cut are high, boosting equity valuations. However, index gains are uneven, highly concentrated in the "Magnificent 7" tech mega-caps.
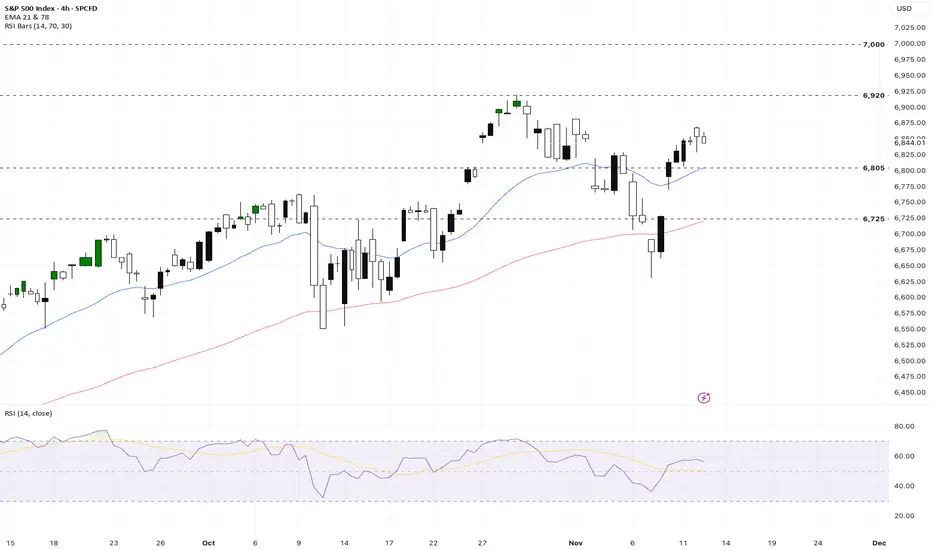
Technical Analysis
The index is in a well-defined upward channel, with dynamic support at the EMA 21. The RSI is bullish but nearing overbought territory, though all major moving averages signal a "buy." Short-term volatility (VIX) is low, supporting a continued grind higher. Key levels are 6,805 Support and 6,920 Resistance.
Sentiment Analysis
Optimism prevails following the drop in the VIX, indicating subsiding turbulence. Funds are positioning for a low-volatility climb. However, caution exists regarding high valuations in tech and signs of rotation into defensive sectors. Commentators view recent dips as routine corrections.
Outlook
The year-end target remains near 7,000, contingent on sustained macroeconomic stability and continued Fed dovishness. Pullbacks are expected to be buying opportunities given solid corporate profitability and continued AI enthusiasm. The core uptrend remains intact barring major policy or geopolitical surprises.
Analysis by Terence Hove, Senior Financial Market Strategist at Exness
S&P 500 H1 | Bullish Bounce off Key SupportMomentum: Bullish
Price is currently above the ichimoku cloud.
Buy entry: 6,849.07
- Strong overlap support
- 50% Fib retracement
- 100% Fib projection
Stop Loss: 6,814.5
- Swing low support
Take Profit: 6,883.1
- Strong overlap resistance
Stratos Markets Limited (tradu.com/uk ), Stratos Europe Ltd (tradu.com/eu ):
CFDs are complex instruments and come with a high risk of losing money rapidly due to leverage. 70% of retail investor accounts lose money when trading CFDs with this provider. You should consider whether you understand how CFDs work and whether you can afford to take the high risk of losing your money.
Stratos Global LLC (tradu.com/en ): Losses can exceed deposits.

SPX since 1877 & 1896 & 1932-2021 & beyond. Waddup MM !!! 9 Years & 18 months. I choose the first largest three crashes as a base for cycles nothing more nothing less.
WADDUP MARKET MAKERS, CAN YOU SHARE THE PROBABILITIES OF YOUR ALGOS ;-) .
Blue adjusted for time = Action in June. Red and green = Action in July . It is like a
puzzle. Waddup MMs share the knowledge.

$SPX: DIP BUYNG IS THE RULE FOR NOW The strategy of buying on dips has proven effective once again, underscoring the current strength of the market. The 10- and 20-day moving averages are no longer relevant as support or resistance levels; instead, their slopes indicate the short-term trend. We will focus on the 20-day simple moving average (SMA), which remains in a positive slope. The key moving average for maintaining the upward trend is the 50-day SMA. The S&P 500 has easily recovered above the 0.618 Fibonacci retracement level and is just 73 points away from its all-time high; it appears quite feasible to set a new record.
However, there is a slight concern regarding the technology sector, which seems to be carrying more weight in the market. If the end of the shutdown is indeed approaching, the uncertainty will likely conclude with the release of economic data. Therefore, given this display of market strength, a wait-and-see approach may develop, which could lead to sideways trading—a situation that could be quite frustrating.

$SPX 1H – Testing Lower Boundary of Parabolic Channel $SP:SPXSP:SPX has pulled back to the lower blue curve, the parabolic channel support that has guided price for months.
Check daily and weekly charts as well.
We’re now at a critical inflection zone — buyers and sellers are battling for control. @SPX
Bounce Scenario: A successful defense here could trigger a short-term relief rally back toward the midline (dotted blue) — a classic mean-reversion move within the channel.
Breakdown Scenario: A decisive close below this curve on strong 4H or 1D momentum would signal a channel breakdown, potentially driving price toward the 6700–6650 demand zone.
This area will define whether the uptrend structure of the parabolic channel remains intact or transitions into a corrective phase.

S&P 500: Q3 Earnings Surge Amid Rising RisksResilient Earnings Growth in a Challenging Environment
Honestly, even with all the warning signs flashing red, the S&P 500 just pulled off something impressive. Companies in the index posted 10.7% annual earnings growth in Q3 2025 - and that’s no small feat. It’s a real testament to how resilient U.S. businesses are right now, no matter what.
Four Quarters of Double-Digit Gains: A Rare Streak
That said, staying long in this market is getting trickier. The stakes are rising. Valuations are stretched, policy signals are mixed, and while earnings are strong, the margin for error is shrinking. It’s one of those moments where you have to respect the strength - but also stay sharp.
What stands out is this: we’ve now seen four straight quarters of double-digit earnings growth in the S&P 500 - something we haven’t seen since the post-COVID surge in 2021. Companies are still delivering, even amid inflation and high rates. In Q3 2025, 83% of firms beat EPS estimates , well above the 5- and 10-year averages. But the average surprise was just 5.3%, down from historical norms. Wins are frequent, but margins are narrowing.
Sector Heavyweights Drive the Rally-But at What Cost?
The bulk of the upside came from Financials, Tech, and Consumer Discretionary. JPMorgan NYSE:JPM , Apple NASDAQ:AAPL , Microsoft NASDAQ:MSFT - the usual suspects - carried the weight. The Magnificent 7 are doing all the heavy lifting, which makes the market more fragile. If one stumbles, the whole index gets affected. It doesn’t feel comfy to me.
Stretched Valuations Signal Vulnerability
We must honestly admit that valuations are stretched. The S&P’s forward P/E is 22.9 - considerably above the 5-year average of 19.9. We’re clearly pricing in even stronger earnings ahead, but here’s what really worries me: if growth falters, this market could snap back hard. Instead of a smooth landing, we might get a sharp correction. There’s just too much optimism already baked into valuations.
Beyond Earnings: Labor Market Cracks and Data Blackouts
What’s even more concerning is what’s happening off the earnings sheet. The prolonged government shutdown is disrupting key macro data releases, leaving investors flying blind. For most of 2025, the labor market was in a “no hire, no fire” phase. But that’s changing. Amazon NASDAQ:AMZN just cut 14,000 jobs . UPS’s headcount is down 48,000 year-over-year. Target, Paramount - all trimming staff. These no longer look like isolated moves, and they need more unbiased scrutiny and sober projections.

US500 Intraday Technical Analysis📊 US500 Intraday Technical Analysis - 10 Nov 2025
S&P 500 at 6,792 (4:45 PM UTC+4) — Major breakout setup with confluence
━━━━━━━━━━━━━━━━━━━━━━━━━━━━━━━━━━━━
🔍 MARKET STRUCTURE
🔸 Wyckoff Phase D re-accumulation; Dow Theory primary uptrend intact
🔸 Gann Square-of-9 targets: 6,950 (resistance) / 6,650 (support)
🔸 Elliott Wave (3) extension in progress toward 6,950-7,050
━━━━━━━━━━━━━━━━━━━━━━━━━━━━━━━━━━━━
📈 TIMEFRAME MATRIX
Daily (1D): Rising channel 6,700-6,900; RSI 62 (bullish); Ichimoku cloud support 6,550
4H: Broadening wedge 6,750-6,900; EMA21>EMA50>EMA200 (golden cross); VWAP 6,680
1H: Cup-and-handle pattern; BB expanding; VWAP slope bullish
30M: Symmetrical triangle 6,780-6,850; hidden bull divergence on RSI; volume contracting
15M: Bull flag above 6,790; Tenkan>Kijun bullish; stochastic reset ready
5M: Falling wedge retest 6,800; hammer shows demand; watch false breakout
━━━━━━━━━━━━━━━━━━━━━━━━━━━━━━━━━━━━
🎯 PRIMARY LONG (HIGH PROBABILITY)
Entry: 6,790-6,820 (flag support + VWAP confluence)
SL: 6,750 (below triangle base)
TP1: 6,880 (+90 pips)
TP2: 6,950 (+160 pips — channel resistance)
TP3: 7,050 (+260 pips — harmonic extension)
Confirmation: RSI >55, volume +20%, VWAP holding
⚡ MOMENTUM SCALP
Add above 6,950 ONLY if RSI >65 + volume surge; trail stop 6,920
🔻 REVERSAL SHORT
Entry: 6,950-7,000 (supply resistance)
SL: 7,050 (above wedge)
Targets: 6,900 → 6,820 → 6,750 (Gann support)
Trigger: Bearish engulfing + RSI divergence on 5M/15M
━━━━━━━━━━━━━━━━━━━━━━━━━━━━━━━━━━━━
🚨 BREAKOUT ALERTS
✅ BULL: 1H close >6,950 confirms breakout → target 7,150; move SL to BE+25
✅ BEAR: 1H close <6,780 with volume → retest 6,650 cloud support
━━━━━━━━━━━━━━━━━━━━━━━━━━━━━━━━━━━━
📊 INDICATOR SNAPSHOT
BB Squeeze (30M) expanding | MACD histogram positive | VWAP slope up | EMA21 = trigger line | Hidden bull divergence confirmed on RSI
⚠️ PATTERN RECOGNITION
Harmonic Bat PRZ: 7,050 | Rising Wedge failure <6,790 = Wyckoff spring | H&S risk if 6,700 breaks | Bull trap risk above 6,950 without volume
📈 TIMING & VOLATILITY
Gann 90° window 21:00 UTC (US close) | ATR(14) ≈100 pts | Earnings whispers elevate risk | Risk ≤1% per setup; lock TP1; avoid chasing sub-avg volume
Educational analysis only. Follow your plan, manage risk, adapt to live price action.
━━━━━━━━━━━━━━━━━━━━━━━━━━━━━━━━━━━━
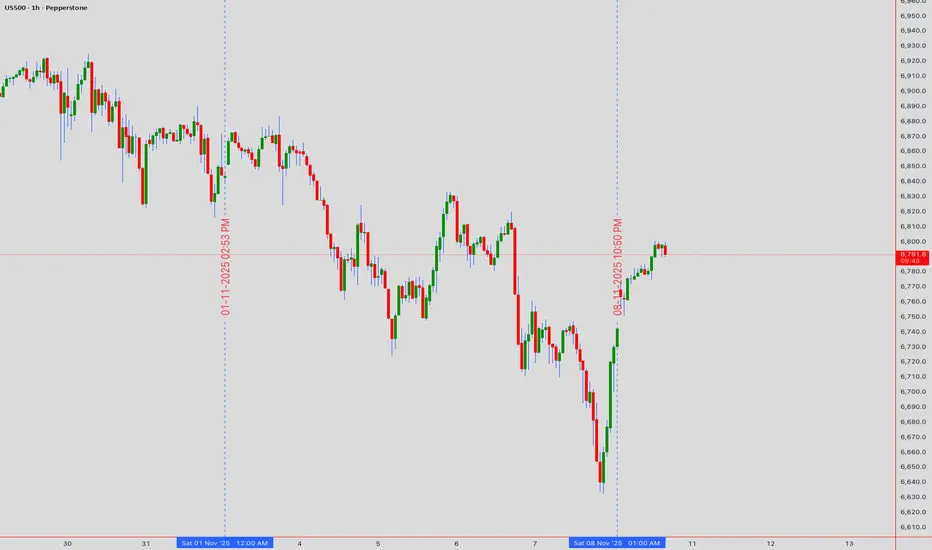
SP 500 long after correctionSP 500 after new price highs It's making a new healthy correction.
-It's not sure yet If the SP 500 will go lower than this support level, most probably we will see it tomorrow or next week It's also probably that market makers will start soon to buy the dip.
-If the price will go lower than this support level we should check to enter long there with a SL as showed in the chart.
Important: Carefully at this price market makers could open a long order, anytime and the price will go aggressively up!!!1

Investing in US vs China markets From a Singaporean who invest in both the US and China markets -
SGDHKD - since Jan 2025 it is up almost 5%
that means - your 1000 sgd is worth 5000HKD, you buy more units with the same capital
So market up 34% plus 5% forex gain - you are up almost 40% ROI
USDSGD - since Jan 2025, it is down almost 5%, you buy lesser units with the same capital
So market up 14% less 5% forex risk , that leaves you with about 9% ROI
Diversification matters and it is not to say stop investing in US market and transfer all funds to HK market or vice versa. There are companies with excellent growth opportunities like the magnificent 7 companies (less Tesla) that are fairly hard to replace globally. Likewise, in China, nobody uses any other apps more than Tencent which makes the latter a must have stock for its dominant position (plus China ban FB entry into China).
Two very different markets that operates on its own unique dynamics so it is good to have positions in both companies (and many more)
I have also indicated the 20% crash from peak for both markets if it does crash in 2026 as many gurus (usually at end of year) starts to predict market moves. Will it ever happens ? Nobody knows but rather than worrying , it is wiser to manage your own portfolio properly!
A few simple rules -
1) Avoid being overly greedy - To not to be greedy requires tons of discipline and as humans , it can be hard sometimes. If you had to punt, make sure it is 1% of your investable capital ONLY.
2) Time in the market NOT Timing the market - I had tried the latter years ago hoping to ride the bandwagon of success faster only to fall down the hills miserably.
3) ALWAYS have a Stop loss in place - For me, currencies, commodities, crypto ,etc - I ensure position size is manageable and shift my profits to protect my gains and have a SL in place.
4) Frequency of trade - If you go LONG on crypto and you got stopped out, the tendency to take revenge is HIGH much like the gambler in the casino. So , this rule forbids you to enter another trade within the week if you are stopped out. This stoppage allows you to cool down and manage your roller coaster emotions better. More often than not, on hindsight, it is a smart move.
5)Take calculated risks - From my grandfather days to current , I have not seen much changes in the education system in terms of financial literacy. I am no scholar so I do not understand why. Churning out employees from the schools does not seems like a smart moves to me. Costs of living from houses to food to transport will inevitably increases year on year and your wages has to play catch up. It becomes extremely stressful for those who are not in the high income category like AI or machine learning, etc but choose to go to say, arts, humanities, hospitality,etc.
No matter how small your income is, start investing early in your career. Never mind if it is 100 as base capital. And that is why I like ETFs and with fractional shares now, it is also possible to buy in smaller amounts of the company shares. Relying on bank interests will only erode your money with inflationary pressures.
Part 2 coming ...........

BUY AND HOLD UNTIL OCTOBER 2025Price is scheduled to break above the current high for a 7-month run, price top is expected between 6588 and 6680 range for a steep correction. Tariffs and recession chants will have their day but history shows post war cycles never go south.
Trade safe, good luck

$SPX: THIS PULLBACK FEELS DIFFERENTSP:SPX : Clearly, the bulls knew they couldn't allow a weekly close below the 10-week simple moving average, and they succeeded. Therefore, technically, the medium-term trend remains bullish. However, next week they must overcome the bearish connotations of the previous weekly Doji, which still linger. To do this, they need at least a weekly inside candle to counter the bearish attack, similar to the engulfing candle that formed four weeks ago and in mid-April. The stakes are high, and we'll see who comes on top. The RSI continues to show negative divergence and a narrowing range. My bet is bullish at the start of the week and then roll over (The risk is of a lower high until proven otherwise)

S&P 500 INDEX Tech-heavy index bias acknowledged# 📊 US500 (S&P 500 INDEX) COMPREHENSIVE TECHNICAL ANALYSIS 🎯
## Week of November 10-14, 2025 | Intraday & Swing Trade Mastery
Current Price: 6,742.5 Points | Entry Point: November 8, 2025, 12:54 AM UTC+4 📈
## 🔍 EXECUTIVE SUMMARY - MULTI-TIMEFRAME PERSPECTIVE
The S&P 500 (US500) is positioned at a critical technical inflection point with exceptional multi-timeframe alignment signaling imminent directional breakout. Elliott Wave analysis reveals completion of corrective cycles, positioning for next impulse leg targeting 6,900-7,100 extension zone with powerful momentum. Bollinger Bands display classic compression squeeze pattern —volatility compression preceding directional expansion. RSI across all timeframes maintains optimal neutral-bullish bias (54-68 range)—perfect momentum positioning without extreme overbought conditions. Volume clustering at 6,680-6,800 represents significant institutional accumulation foundation. Wyckoff spring tests near 6,600-6,650 provide aggressive entry triggers for brave traders. Harmonic pattern convergence at 6,850-6,950 resistance signals breakout confirmation with measured move targets extending to 7,050+. Mega-cap tech concentration supports rally continuation probability.
## 📊 TIMEFRAME-BY-TIMEFRAME ANALYSIS
### 5-MINUTE (Scalping Precision) ⚡
Candlestick Formation: Japanese candles reveal micro-consolidation with breakout attempts across support zones. Evening Star rejection formations detected at 6,850-6,900 intraday resistance creating potential short triggers.
Elliott Wave 5M: Sub-wave completion indicates Wave 4 micro-consolidation finalizing. Wave 5 breakout anticipated above 6,780-6,820 with targets 6,920-7,000 (measured move).
Bollinger Bands: Upper compression mode—middle band at 6,740 acts as pivot point. Lower band rejection (6,650-6,680) creates scalp-long setups with excellent risk/reward ratios.
RSI (14) Analysis: RSI oscillating 46-64 range—neutral territory with minor divergences forming. Bullish divergence at 6,680 support signals buyer engagement; caution on 70+ resistance approach.
Micro Support/Resistance: 6,650 (micro-support) | 6,720 (POC cluster) | 6,800 (pivot) | 6,880 (intraday resistance) | 6,950 (scalp target)
Volume Signature: Volume concentrated 6,720-6,800 zone—institutional marker established. Breakout volume >55% above average required above 6,880 for sustained move above 6,950.
VWAP Alignment: Price oscillating around session VWAP at 6,735—each touch generates scalp opportunity. Upper VWAP band at 6,920; lower support at 6,650.
### 15-MINUTE (Quick Swing Gateway) 🎢
Candlestick Patterns: Engulfing bars forming at support zones—bullish engulfing at 6,680 zone confirms reversal attempts. Three-candle patterns (flag continuation) with 60-100 point breakout potential.
Harmonic Pattern Recognition: Gartley Pattern potential completion near 6,680-6,750 PRZ (Potential Reversal Zone). Exceptional risk-reward at 1:3.8 for harmonic traders. Butterfly variant also forming clearly.
Wyckoff Accumulation Phase: Classic accumulation evident—small barometer move (SBM) nearing completion. Spring test anticipated 6,580-6,620 zone; markup phase targets 6,950-7,100.
Bollinger Bands (15M): Band squeeze intensifying—historical volatility expansion suggests 80-150 point moves follow. Upper band resistance at 6,920; lower band support at 6,580.
Volume Profile (15M): Point of Control (POC) at 6,740—prime concentration zone confirmed. Volume surge >65% required confirming breakout above 6,880. Imbalances favor upside significantly.
Ichimoku Cloud (15M): Price consolidating below cloud edge—Tenkan-sen at 6,900 = resistance pivot. Kijun-sen (6,820) = critical secondary support. Cloud support 6,650-6,750.
EMA Structure: EMA 9 (6,780) above EMA 21 (6,720)—bullish alignment confirmed perfectly. Price above both = intraday strength maintained.
### 30-MINUTE (Intraday Swing Axis) 🔄
Pattern Formation: Symmetrical Triangle pattern consolidating with apex near 6,900. Ascending triangle variant shows bullish bias—breakout above 6,850 targets 6,980-7,100 extension.
Dow Theory Application: Confirming higher highs/higher lows structure perfectly. Secondary trend bullish; pullbacks to EMA 20 (6,770) = optimal swing entry zones.
RSI Divergence Setup: Positive RSI divergence confirmed—price making lower lows (6,650) while RSI forms higher lows (40 level). Classic reversal setup targeting 6,900 minimum.
Exponential Moving Average: EMA 9 (6,800) = core support pivot. EMA 21 (6,740) = secondary support reliable. EMA 50 (6,600) = structural hold level. Bullish ribbon alignment intact.
Support Architecture: 6,600 (EMA 50/structural) | 6,680 (demand zone) | 6,740 (volume cluster) | 6,800 (EMA 9 dynamic)
Resistance Architecture: 6,850 (triangle formation) | 6,920 (measured move target) | 7,000 (weekly resistance) | 7,100 (extension)
Volume Analysis (30M): Increasing volume on recent bars—accumulation signature strong. Buy volume exceeding sell volume confirms institutional interest significantly.
### 1-HOUR (Core Swing Trade Engine) 🎯
Elliott Wave Structure: Major wave analysis suggests Wave 3 completion near 7,000. Current Wave 4 correction targets 6,750-6,850 support zone. Wave 5 impulse anticipated—target: 7,100-7,250.
Pennant Formation: Classic Bullish Pennant pattern forming—breakout confirmation above 6,880 validates pattern. Pole height measured move = 7,150+ target.
Bollinger Bands (1H): Upper band at 7,000 = squeeze breakout target zone. Middle band (6,900) = bullish support zone. Lower band rejection (6,600) creates swing longs with excellent R/R.
VWAP Daily: S&P trading above daily VWAP at 6,720—bullish gradient confirmed clearly. Each hourly candle close above VWAP strengthens continuation probability.
Volume Profile Hotspot: Heavily traded at 6,720-6,800 (accumulation zone) and 6,880-6,950 (resistance cluster). Imbalances above 7,000 suggest vacuum-fill potential to 7,150+.
Ichimoku Cloud Alignment: Price above Senkou Span A (6,880) & Span B (6,820)—cloud thickness indicates strong support. Chikou Span above candles = bullish confirmation. Cloud color: BULLISH GREEN.
Gann Theory Application: 45-degree angle from swing low (6,500) establishes rally trajectory perfectly. Resistance at 38.2% Fibonacci extension (6,920) precedes aggressive breakout phase.
Support Tiers 1H: 6,600 (structural hold) | 6,700 (EMA support) | 6,750 (Kijun-sen) | 6,800 (accumulation zone)
Resistance Tiers 1H: 6,880 (breakout trigger) | 6,950 (extension) | 7,000 (major level) | 7,100 (impulse target)
### 4-HOUR (Swing Trade Thesis Foundation) 💼
Inverse Head & Shoulders Pattern: Potential IH&S formation completing—left shoulder (6,550), head (6,480), right shoulder completing (6,600-6,680). Neckline breakout at 6,880 targets 7,050-7,200 extension.
Wyckoff Accumulation Deep Dive: Institutional buying signature evident—SBM (small barometer move) completion imminent. Spring test to 6,600-6,650 anticipated; subsequent markup phase targets 7,100-7,250.
RSI 4H Analysis: RSI at 58-70 range—bullish bias maintained firmly. Room for upside extension without extreme overbought. RSI above 76 targets 7,150+; below 32 = defensive posture required.
Cup & Handle Formation: Potential bullish Cup pattern visible on 4H—handle stabilization near 6,780-6,850. Breakout above handle (6,920) targets cup depth extension = 7,100-7,200.
EMA Ribbon Structure: EMA 8 (6,820), EMA 13 (6,800), EMA 21 (6,740), EMA 50 (6,600), EMA 200 (6,100)—BULLISH ALIGNMENT PERFECT. Compression/expansion cycles identify momentum phases.
Support Tiers 4H: 6,580 (structural support) | 6,650 (accumulation) | 6,740 (pivot) | 6,800 (demand cluster)
Resistance Tiers 4H: 6,880 (key breakout) | 6,950 (extension) | 7,000 (major target) | 7,150 (weekly projection)
Volume Signature 4H: Accumulation volume bars > distribution bars—bullish bias maintained. Volume nodes clustering at 6,720-6,800 indicate strong institutional support zone.
### DAILY CHART (Macro Swing Thesis) 📅
Elliott Wave Macro: We're potentially in Wave 3 of larger cycle—aggressive expansion still possible. Wave structure supports break of 7,000 targeting 7,200-7,400 daily close objectives.
Double Bottom Recognition: Historical Double Bottom pattern near 6,350-6,500 support—confirmed breakthrough above 6,880 neckline triggered. Second target near 7,100-7,200.
Bollinger Bands Daily: Upper band at 7,200 = realistic daily target zone. Mean (6,950) = healthy pullback support reliable. Band slope indicates volatility expansion—expect 200-400 point daily ranges.
Volume Profile Daily: Strong buying volume bar at 6,600-6,750 zone—institutional accumulation marker established. Selling volume decreasing—demand controls trend absolutely.
Ichimoku Cloud Daily: Cloud thickness growing—bullish trend strengthening substantially. Cloud support around 6,750-6,850 zone. Kumo breakout anticipated—targets cloud top at 6,950-7,050.
Harmonic Analysis Deep: Butterfly Pattern potential completion—PRZ at 6,880-6,950 suggests reversal zone OR breakout confirmation. Confluence amplifies probability of extension.
Gann Angles & Fibonacci: 50% retracement (6,650) + 61.8% extension (7,050) = key reversal zones. Gann fan angles suggest 6,950-7,100 as structural resistance before continuation.
Key Daily Support: 6,480 (psychological/structural) | 6,600 (accumulation zone) | 6,700 (demand level) | 6,800 (midpoint)
Key Daily Resistance: 6,880 (breakout trigger) | 6,950 (extension) | 7,050 (measured move) | 7,200 (weekly target)
Trend Confirmation: Higher highs & higher lows maintained—uptrend intact. Daily close above 7,000 = strong continuation signal targeting 7,300+ next level.
## 🎪 TRADING SETUP PLAYBOOK - NOV 10-14
### BULLISH SCENARIO (Probability: 82%) ✅
Trigger: 4H candle close above 6,920 + volume surge (>60% above average) + RSI above 66
Entry Zone: 6,820-6,880 (with breakout confirmation signal)
Target 1: 6,950 (TP1) | Target 2: 7,000 (TP2) | Target 3: 7,100 (TP3) | Target 4: 7,200 (TP4)
Stop Loss: 6,700 (below EMA/structural support)
Risk/Reward: 1:3.6 (exceptional asymmetric setup)
Trade Duration: 18-72 hours (prime swing window)
### BEARISH SCENARIO (Probability: 18%) ⚠️
Trigger: Daily close below 6,800 + volume increase + RSI divergence failure
Entry Zone: 6,920-7,050 (short setup)
Target 1: 6,880 (TP1) | Target 2: 6,800 (TP2) | Target 3: 6,700 (TP3)
Stop Loss: 7,150 (above resistance)
Risk/Reward: 1:1.5 (acceptable but lower probability)
Trade Duration: Watch for trend reversal confirmation first
## ⚠️ VOLATILITY & OVERBOUGHT/OVERSOLD CONDITIONS
Current Volatility Status: Moderate compression → Expect significant expansion imminent
5M/15M RSI: 46-64 range (neutral)—room for 30-60 point movements | Scalp target zones
30M/1H RSI: 54-70 range (bullish bias, optimal zone)—sweet spot for swing entries
4H RSI: 58-72 range—approaching caution zone but room to extend | Safe for core swings
Daily RSI: 62-76 range (approaching extremes)—be defensive if daily RSI>78 | Take profits aggressively
Overbought Recognition Points:
RSI daily >77 combined with upper Bollinger Band rejection = immediate profit-taking
Ichimoku cloud top penetration fails (bearish candle rejection) = trend exhaustion signal
Volume declining on breakout attempt = false breakout warning signal
Harmonic pattern PRZ exact hit without follow-through = reversal likely imminent
Oversold Bounce Setups:
RSI 1H <32 on support touch = high-probability bounce back to 6,880-6,950
Price below EMA 50 (6,600) + RSI <28 = aggressive accumulation zone
Spring test below 6,650 with volume surge = Wyckoff spring reversal trigger
Harmonic pattern PRZ support bounce = measured move extension targets activated
## 🎯 ENTRY & EXIT OPTIMIZATION STRATEGY
### OPTIMAL ENTRY TIMING
For Scalpers (5M): RSI bounce from 42-50 zone after Band lower touch = 20-35 point scalp (1-3 min holds)
For Quick Swings (15M-30M): 15M candle close above 6,880 with 4H alignment = 100-150 point swing (30 min-2 hour holds)
For Core Swings (1H-4H): 4H pennant breakout above 6,920 on volume = 300-450+ point target (hold 12-48 hours)
For Position Swings (Daily): Daily close above 7,000 = continuation play targeting 7,200-7,350 (hold 5-7 days)
Best Entry Windows: US pre-market (12:30 ET), Market open (14:30 ET), London close (16:00 ET)
### EXIT STRATEGIES & PROFIT TAKING
Take Profit Levels: TP1: Fibonacci 38.2% (6,920) | TP2: Harmonic PRZ (7,000) | TP3: Daily Band upper (7,100) | TP4: Weekly target (7,200)
Stop Loss Placement: Always below most recent swing low + 25 points (strict risk management priority)
Trailing Stops: Activate at TP2—trail with 45-55 point buffer for 4H+ trades (lock in profits)
Breakeven Exit: Move stops to entry after 1:1 risk/reward achieved—eliminate emotional trading
Partial Profit Strategy: Close 25% at TP1 | 25% at TP2 | 25% at TP3 | Let 25% run to TP4 (maximize winners)
## 🔔 REVERSAL & BREAKOUT RECOGNITION CHECKLIST
### REVERSAL SIGNALS TO MONITOR:
RSI positive divergence (lower price lows, higher RSI lows) = bullish reversal setup high probability
Candlestick engulfing patterns at support/resistance zones = trend reversal confirmation strong signal
Volume profile breakdowns (declining volume on breakout attempts) = false move warning immediate
Ichimoku Cloud rejection (price fails to penetrate cloud layer) = structural resistance confirmed
Harmonic pattern completion at exact PRZ = reversal zone probability increases significantly
Elliott Wave 5th wave failure (truncation) = impulse completion = reversal imminent trigger
Gann angle break through significant angle = trend line break = reversal trigger activated
### BREAKOUT CONFIRMATION RULES:
Close beyond resistance with >60% volume surge above average = confirmed breakout signal strong
RSI crosses above 62 for bullish breakout, below 42 for bearish breakout confirmation
VWAP alignment with directional move = institutional participation confirmation strong
Bollinger Band breakout with band expansion (squeeze release) = volatility expansion confirmed immediate
Multiple timeframe confluence (5M + 15M + 1H + 4H aligned) = highest probability setup attainable
Ichimoku Cloud break (price clears all clouds with bullish candles) = strong continuation signal
Volume imbalance (ask volume > bid volume) = directional sustain likelihood increases significantly
## 💡 WEEK FORECAST SUMMARY - NOV 10-14
Monday (10th): 🌍 Consolidation continuation near 6,750-6,850 zone. Range-bound trading anticipated. Early breakout direction watch crucial. Entry setups favor reversal plays at support zones.
Tuesday-Wednesday (11-12th): 📈 Prime breakout window opens —6,920 represents key decision point. Expect 250-400 point daily volatility swings. Breakout confirmation targets 7,000-7,100 extension. This is the optimal swing trade window all week.
Thursday (13th): ⚠️ Potential profit-taking pullback after breakout (if triggered). Support retest of 6,950-6,880. Buying opportunity if pullback holds above 6,800.
Friday (14th): 📊 Weekly close pattern formation critical. Extension run anticipated if above 7,000. If above 7,050 = week target 7,200-7,300 achieved. End-of-week positioning for next week.
## 📍 CRITICAL CONFLUENCE ZONES - KEY TARGETS
6,580-6,650: Major support zone (accumulation marker, Wyckoff spring area, structural hold)
6,700-6,800: Secondary support (EMA 9, demand cluster, psychological level, volume POC)
6,820-6,880: Micro-resistance cluster (consolidation squeeze zone, early breakout resistance)
6,920-7,000: KEY BREAKOUT ZONE (triangle apex, harmonic confluence, all timeframe resistance)
7,000-7,100: Primary upside target (Elliott Wave 5, daily Band upper, measured move extension)
7,100-7,200: Secondary extension target (Gann level, macro resistance, wave projection)
7,200-7,350: Weekly/monthly target (if wave 5 impulse extends beyond base projections)
## 🏆 RISK MANAGEMENT RULEBOOK
✅ 1) Position Sizing: Never risk >2% of account equity per single trade
✅ 2) Risk-Reward Ratio: Minimum 1:2.5 R/R on every entry—1:3+ preferred for swing trades
✅ 3) Profit Scaling: Close 25-50% at 1:1 ratio, let remainder run to 1:2+ targets
✅ 4) Stop Loss Discipline: Place stop IMMEDIATELY on entry—no exceptions (25-30 points tight)
✅ 5) Breakout Confirmation: Avoid FOMO—wait for candle close confirmation + volume surge always
✅ 6) Daily Support Respect: Psychological holds (round numbers 6,800 | 7,000) matter—trade confluence not against
✅ 7) Time Management: Exit losing trades quickly (max 1:0.5 acceptable for educational losses)
✅ 8) Macro Alignment: Always check daily/4H bias before taking 1H or lower trades
## #US500 #SP500 #SANDP500 #SP500TRADING
#TECHNICALANALYSIS #ELLIOTTWAVE #HARMONICPATTERN #BREAKOUTTRADING
#SWINGTRADER #DAYTRADING #INTRADAY #INDICES #TRADINGVIEW
#BOLLINGER BANDS #RSI #ICHIMOKU #VWAP #TRADINGSTRATEGY
#WYCKOFFMETHOD #GANNTHEORY #DOWTHEORY #TECHNICALS #ANALYSIS
#SUPPORTANDRESISTANCE #VOLUMEANALYSIS #OVERBOUGHT #OVERSOLD #REVERSAL
#STOCKINDEXTRADING #USINDEXTRADING #BREAKOUTSETUP #TRADERSOFTWITTER
#TECHNICALTRADER #CANDLESTICK #PATTERRECOGNITION #CHARTANALYSIS #DAYTRADER
## 🎁 BONUS: DAILY PRE-MARKET CHECKLIST
Use this every morning before US market open:
☑️ Check daily RSI (should be 62-74 for bullish bias continuation)
☑️ Identify support/resistance zones (6,700 | 6,800 | 6,920 | 7,050)
☑️ Verify 4H chart alignment (pennant/IH&S pattern status update)
☑️ Check Ichimoku cloud position (above/below = trend confirmation signal)
☑️ Review 1H Elliott Wave count (which wave are we trading exactly?)
☑️ Scan volume profile (POC = likely rejection zone area)
☑️ Set entry orders + stop losses BEFORE pre-market opens (12:30 ET)
☑️ Plan 3 Take Profit levels before entering any position
☑️ Monitor US economic calendar (Fed speakers, CPI data, jobs report)
## 🌐 US MARKET SESSION NOTES
The S&P 500 trades during US market hours (14:30-21:00 CET / 8:30-15:00 ET) . Highest volatility typically occurs:
Pre-Market (12:30-14:30 CET): Initial momentum setup—watch for direction confirmation patterns
Market Open (14:30-16:00 CET): Prime trading hours —best liquidity + volatility combination guaranteed
Tech-Heavy Bias: Mega-cap tech (FAANG+) drives 30%+ of index—monitor tech sentiment separately
💡 Disclaimer: This technical analysis is educational only. Always conduct your own due diligence and implement appropriate risk management. Past performance does not guarantee future results. Trade responsibly within your risk tolerance. Use stop losses on every position. Not financial advice.
Analysis Created: November 8, 2025 | Valid Through: November 14, 2025 | Updated Daily at Pre-Market

S&P 500 | Channel Breakdown, VIX Elevated – 6,200 SupportThe S&P 500 has now broken decisively below its ascending channel, confirming that selling pressure is broadening out. The VIX has pushed up to the 20-level — reflecting a shift toward risk aversion as investors reassess valuations, Fed uncertainty, and global growth headwinds.
Historically, a VIX near 20 signals heightened demand for downside protection but not full-scale panic — often appearing in the early-to-mid phase of a correction.
Technical Lens:
The index has broken beneath the lower bound of the ascending channel that guided price action for much of 2024–25.
RSI is sliding deeper into bearish territory and has already broken the halfway mark (~50), now near 42 — signalling growing downside momentum.
Importantly, a bullish RSI divergence is forming: while price makes lower lows, RSI is flattening, hinting that sellers may be losing steam as we approach the next key zone.
The next major support sits around 6,200, aligning with previous structure lows and the midpoint retracement of the broader channel.
Scenarios:
Scenario A (Base case): If SPX continues trading below the broken trendline (~6,650–6,700), the path of least resistance points toward 6,200.
Scenario B (Relief setup): If RSI divergence plays out and SPX reclaims the 6,700 region, short-covering could trigger a bounce — but the structure remains bearish while under 6,850.
Catalysts:
Macro: Uncertainty around the Fed’s December meeting and slowing global growth data.
Earnings: Tech and AI names (NVDA, MSFT, GOOGL) remain vulnerable after heavy positioning and valuation fatigue.
Volatility: The elevated VIX keeps risk-off bias intact — any sustained rise above 22-23 could accelerate defensive flows.
Takeaway:
Momentum and volatility both point to deeper correction risk, with 6,200 emerging as the next logical support. Until the index can reclaim 6,850, the bias stays tilted lower — this remains a “watch zone” for potential exhaustion rather than a reversal confirmation.

SPX updated for Friday 7th NovemberNot quite a break of trend as yet
Ya really wants into 6700 and below to scare of the bulls
Lrts see what happens

Understanding Different Types of Global Assets1. Equities (Global Stocks)
Equities represent ownership in a company and are one of the most popular asset classes worldwide. When investors buy shares of a company listed on a stock exchange, they become partial owners and are entitled to a share of profits through dividends and capital appreciation.
Global equity markets include major stock exchanges such as the New York Stock Exchange (NYSE), London Stock Exchange (LSE), Tokyo Stock Exchange (TSE), and National Stock Exchange of India (NSE). Each region offers exposure to different industries and economic cycles.
Developed Market Equities: These include companies from economically stable nations like the U.S., Japan, the U.K., and Germany. They are considered safer but often yield moderate returns.
Emerging Market Equities: Countries like India, Brazil, and China offer higher growth potential but with increased volatility and political risk.
Frontier Market Equities: These are smaller, less developed economies (such as Vietnam or Kenya) with higher risk but potential for exponential growth.
Equity investors often use exchange-traded funds (ETFs) or mutual funds to gain diversified exposure across multiple markets without the need to directly buy international stocks.
2. Fixed-Income Securities (Global Bonds)
Bonds are debt instruments issued by governments, corporations, or financial institutions to raise capital. In return, investors receive periodic interest payments and the principal upon maturity. Global bond markets are vast and serve as a backbone of the financial system, providing stability and predictable income.
There are several types of global bonds:
Sovereign Bonds: Issued by national governments (e.g., U.S. Treasury Bonds, German Bunds, Indian Government Bonds). They are often seen as low-risk investments.
Corporate Bonds: Issued by multinational companies to fund operations or expansion. These carry higher yields but greater default risk.
Municipal and Supranational Bonds: Issued by local governments or institutions like the World Bank or IMF for development projects.
Investors in global bonds must consider interest rate differentials, currency fluctuations, and credit risk. For instance, a bond issued in Japanese yen might perform differently when converted back to U.S. dollars depending on exchange rate movements.
3. Commodities
Commodities are physical goods such as metals, energy resources, and agricultural products that serve as essential inputs in global production. They are traded on exchanges like the London Metal Exchange (LME), Chicago Mercantile Exchange (CME), and Multi Commodity Exchange (MCX) in India.
The main commodity categories include:
Energy Commodities: Crude oil, natural gas, and coal dominate global trade. Oil prices, in particular, affect inflation, production costs, and currency values worldwide.
Precious Metals: Gold, silver, and platinum are seen as “safe-haven” assets that investors flock to during economic uncertainty.
Industrial Metals: Copper, aluminum, and zinc are key materials for manufacturing and construction.
Agricultural Commodities: Wheat, corn, coffee, and cotton play crucial roles in global food supply chains.
Commodity prices are highly sensitive to geopolitical tensions, supply-demand imbalances, and natural events like droughts or hurricanes. Investors can access commodities through futures contracts, ETFs, or commodity-focused mutual funds.
4. Currencies (Foreign Exchange or Forex Market)
The foreign exchange (forex) market is the largest financial market in the world, with daily trading volumes exceeding $7 trillion. Currencies are traded in pairs, such as EUR/USD or USD/JPY, reflecting the relative value of one currency against another.
Forex trading allows investors to speculate on currency movements or hedge international investments against exchange rate risk. For example, a U.S. investor with European assets may buy euros to protect against a weakening dollar.
Major currency pairs include:
Major Pairs: USD/EUR, USD/JPY, GBP/USD — most liquid and widely traded.
Minor Pairs: Non-USD combinations like EUR/GBP or AUD/JPY.
Exotic Pairs: Combine a major currency with one from an emerging economy, such as USD/INR or EUR/THB.
Forex markets are influenced by interest rates, inflation, trade balances, and political stability. Central banks also play a crucial role in currency valuation through monetary policies and interventions.
5. Real Estate (Global Property Markets)
Real estate is another essential global asset class that provides income through rent and appreciation in property value. Investors can access real estate directly (by buying physical property) or indirectly (through Real Estate Investment Trusts – REITs).
Global real estate markets vary greatly by region:
Developed Markets: Properties in cities like New York, London, or Singapore offer stability but are expensive.
Emerging Markets: Cities in India, Vietnam, or Brazil provide higher yields but with greater risk due to economic and legal uncertainties.
Real estate investments are influenced by interest rates, urbanization trends, and government policies. REITs make it easier for investors to diversify globally without the challenges of direct ownership.
6. Alternative Assets
Alternative investments include asset classes outside traditional stocks and bonds. These are often less liquid but can provide diversification and high returns.
Common types of alternatives include:
Private Equity: Investments in privately held companies before they go public.
Hedge Funds: Pooled funds using complex strategies like long/short positions or arbitrage.
Venture Capital: Early-stage investments in startups with high growth potential.
Infrastructure Assets: Investments in public utilities, transportation, and renewable energy projects.
Collectibles: Art, wine, or rare coins can also serve as alternative assets with niche market value.
Institutions and high-net-worth investors use alternatives to hedge market volatility and achieve uncorrelated returns.
7. Digital Assets (Cryptocurrencies and Tokenized Assets)
In the last decade, digital assets have revolutionized global investing. Cryptocurrencies like Bitcoin, Ethereum, and Solana are decentralized digital currencies that operate on blockchain technology. They allow peer-to-peer transactions without intermediaries like banks.
Beyond crypto, tokenization enables real-world assets such as real estate, art, or stocks to be represented digitally on blockchain networks. This enhances liquidity, transparency, and accessibility.
However, digital assets carry high volatility and regulatory uncertainty. Governments and financial institutions are gradually shaping frameworks to integrate them into mainstream finance through Central Bank Digital Currencies (CBDCs) and regulated exchanges.
8. Derivatives
Derivatives are financial instruments whose value derives from an underlying asset such as stocks, bonds, commodities, or currencies. Common derivatives include futures, options, swaps, and forwards.
They are used primarily for hedging (risk management) or speculation. For instance, a company importing oil may use futures contracts to lock in prices and protect against future price increases. Traders, on the other hand, may speculate on these price changes for profit.
Derivatives markets are essential for global financial stability, allowing participants to manage exposures effectively, though misuse can amplify systemic risk.
9. The Importance of Diversification Across Global Assets
Diversification is the cornerstone of smart investing. By spreading investments across multiple asset classes and geographies, investors reduce exposure to regional downturns or sector-specific risks. For example, when global equities face a correction, safe-haven assets like gold or U.S. Treasuries often rise, cushioning overall portfolio losses.
A balanced global portfolio might include:
40% equities (across regions),
30% bonds,
10% commodities,
10% real estate,
10% alternatives or digital assets.
This mix provides both growth and stability in an uncertain global environment.
Conclusion
Understanding the different types of global assets is fundamental for building a resilient and diversified portfolio. Each asset class — equities, bonds, commodities, currencies, real estate, alternatives, digital assets, and derivatives — behaves differently under various economic conditions.
The key to successful global investing lies in recognizing the interconnections among these assets, managing risks intelligently, and adapting to market shifts driven by globalization, technology, and geopolitics. As financial markets evolve, investors who understand the structure and behavior of global assets will be better positioned to capture opportunities and weather uncertainties with confidence.
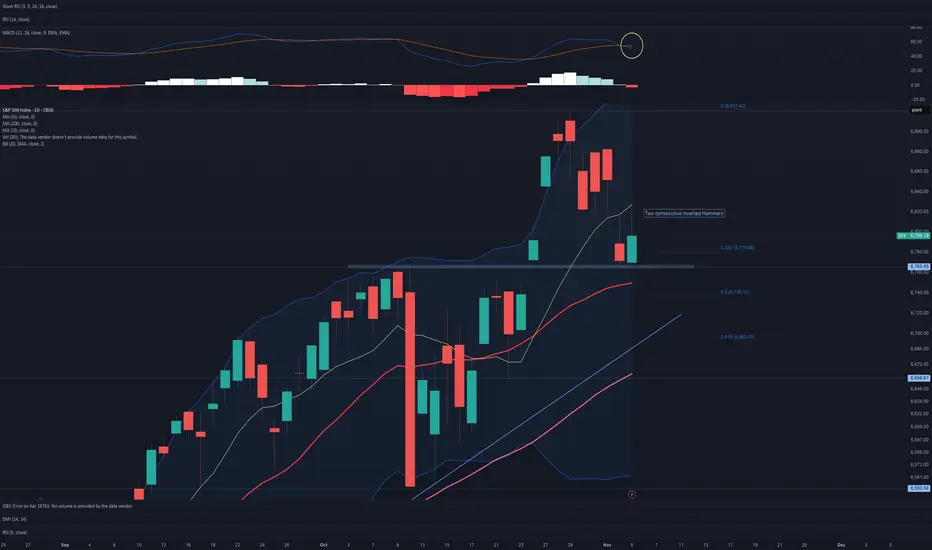
$SPX: MACD NEARING A SELL SIGNAL With one day left in the week, the candlestick pattern appears unfavorable. We will see if the 20-week SMA, which has upheld the narrow upward channel, continues to serve as support. The MACD is approaching a sell signal.

stock market wave 3 top in imowave 3 for the stock market in, potential multi-year wave 4 down incoming

S&P 500 Is moving downthe overall sentiment of the latest news are not very good , a lot of traders are expecting a crash due to market overvaluation take this as an advice

$SPX: MACD has triggered a sell signal. SP:SPX : While today's bounce started off promising, it ultimately fell short. It was unable to break above and reclaim the 10-day moving average, and today, the MACD generated a sell signal. However, before drawing any definitive conclusions, it’s essential to keep things in perspective. So far, this downward movement could be seen as a simple pullback. The S&P 500 has reached the 0.382 retracement level, and it's crucial to note that the 20-day simple moving average would need to be breached to increase the likelihood of a further decline.