SPX QuantSignals: Bullish Bias SPX QuantSignals Katy 1M Prediction 2025-11-17
Symbol: SPX
Price: 6706.78
Model: Katy AI 1M Prediction
Trend: Bullish
Confidence: 64.6%
🔮 Vision Summary
SPX maintains a bullish short-term structure, with the model projecting a move toward 6753.08 (+0.69%).
Momentum remains positive as long as price holds above 6700, with 30-minute targets signaling continued upward drift toward 6730.49.
Volatility remains moderate (27.3%), supporting steady trend continuation rather than sharp mean-reversion.
📈 Key Levels
Entry Zone: 6706.78
Upside Target: 6743.82 – 6753.08
Support / Invalidation: 6606.18
🧭 Vision Bias
Bullish — Model indicates upward continuation with controlled volatility and stable trend strength.
Break below 6700 weakens the signal; break below 6606 invalidates the forecast.
Trade ideas

S&P 500 to print final move to 6500It goes without saying, this bull market has been the most hated I’ve ever known. Retail traders attempts to go “short” on every leg up resulted in quick squeezes. Every 1% to 4% correction brought renewed calls for the end of all things. Including time I believe. There is a reason why 90% of market participants fail in trading. Emotions.
The last four long ideas published by Without Worries are linked below. Read the comments in each to get an impression of the distain retail traders have for this bull market. The Cup and Handle idea for example, published on November 9th 2023. Many reading the idea were understandably skeptic. I tell you that to tell you this... The idea was much more than a chart pattern. The idea included studies from Dollar index and more importantly market sentiment.
So lets focus on those two in a little more detail.
** Market sentiment **
The market sentiment in November last was incredibly bearish. The Put/Call ratio was sky rocketing, in other words retail traders were all “short” on the market. That was a mistake. Guess what? They're doing it again.
Weekly Put/Call ratio
If you follow my practices you’ll know one of our golden rules, we never never long into active resistance. Just don’t. Don’t even think about it.
On the above weekly Put/Call chart we can see retail traders are betting heavily with both feet for a market correction as the Put/Call ratio shows a strong demand for “Short” contracts. We can see RSI is actively rallying into resistance. Oh dear…
** The dollar index **
The dollar has entered a bull market. Or so it appears. On the 2-day chart below price action has printed a Life Cross with the index trading above the 2-day/200 sma.
However on closer inspection just as in late 2022 and indeed late 2023, both price action and RSI support have failed. This will be a short lived bull market, for now.
Support and resistance is the ultimate cheat code. It has been integral to the previous ideas shared. It amazes how many continue to dismiss the importance of practicing this simple concept. Look left.
2-day DXY
** The conclusion **
On the above monthly chart several technical developments have occurred. Together with market sentiment and dollar index structure, the combination provides a powerful message.
The red arrows highlight each significant market top over the last 10 years when sentiment was incredibly bullish. The blue arrows record sentiment at extreme bearish levels.
Here’s the interesting part, when sentiment was this bearish price action was already at the lower half of the rising channel. There is not an instance when a rise from lower to higher half of the channel with confirmation of support (we’ve confirmed) did not result in a resistance test at the top of the channel.
The resistance is now between 6500 and 6700.
Is it possible the market collapses like many retail traders are now calling for? Sure.
Is it probable? No.
Ww
** previous S&P 500 ideas **
S&P 500 - Cup and Handle
S&P 500 - Why everyone is wrong
S&P 500 - Why everyone is wrong - Part II
S&P 500 to 6000

S&P 500 Wave Analysis – 21 November 2025
- S&P 500 index reversed from strong support level 6555.00
- Likely to rise to resistance level 6800.00
S&P 500 index recently reversed from support area between the strong support level 6555.00, lower daily Bollinger Band and the 50% Fibonacci correction of the upward impulse from August.
The upward reversal from the support level 6555.00 stopped the previous minor ABC correction 2 from the end of October.
Given the clear daily uptrend, S&P 500 index can be expected to rise to the next resistance level 6800.00 (former top of wave (3) from October).

S&P500 remain under pressure, support at 6580Equities remain under pressure, with the S&P 500 down 0.92% yesterday, marking:
3rd straight decline (first since September)
Worst 3-day stretch since April (-2.61%)
Futures down another ~0.5% this morning
The index has now broken below its 50-day moving average for the first time in 139 sessions—its longest stretch above the level since 2007—adding to technical downside pressure.
Drivers of the Selloff
AI trade concerns continue to weigh:
Nvidia -1.88%, Philadelphia Semi Index -1.55%
JPMorgan’s Daniel Pinto warned of AI-rich valuations posing broader market risk.
Broad selling across the S&P:
407 decliners, most in 5 weeks
Equal-weight S&P -1.31%, Russell 2000 -1.96%, both at lowest since August
Credit risk sentiment deteriorated:
US HY +5bps, IG +1bps wider
Amazon priced $15bn in new bonds, adding to supply pressure
Mega-cap Tech
Mag-7 only slightly lower (-0.08%), saved by:
Alphabet +3.11% on Berkshire stake news
Apple sentiment mixed:
Design group loss, but strong China iPhone 17 sales (+37%) provided support
Crypto Risk Pressure
Bitcoin -3.3%, touching its lowest since April
Down ~4% YTD 2025
Down nearly 30% from highs 6 weeks ago
Modest rebound this morning helping stabilize risk tone
Macro Tone
Mass layoffs surged in October (Cleveland Fed) → signs of labour softening
Focus shifts to Thursday’s delayed September jobs report for confirmation
Trading Takeaway
Tone remains fragile, but S&P futures and Bitcoin stabilizing suggest some cooling of the global selloff.
Break of the 50-day MA is a key technical negative; next support levels likely in focus.
AI sector weakness + broader macro softening remain dominant headwinds today.
Key Support and Resistance Levels
Resistance Level 1: 6707
Resistance Level 2: 6757
Resistance Level 3: 6785
Support Level 1: 6580
Support Level 2: 6554
Support Level 3: 6530
This communication is for informational purposes only and should not be viewed as any form of recommendation as to a particular course of action or as investment advice. It is not intended as an offer or solicitation for the purchase or sale of any financial instrument or as an official confirmation of any transaction. Opinions, estimates and assumptions expressed herein are made as of the date of this communication and are subject to change without notice. This communication has been prepared based upon information, including market prices, data and other information, believed to be reliable; however, Trade Nation does not warrant its completeness or accuracy. All market prices and market data contained in or attached to this communication are indicative and subject to change without notice.

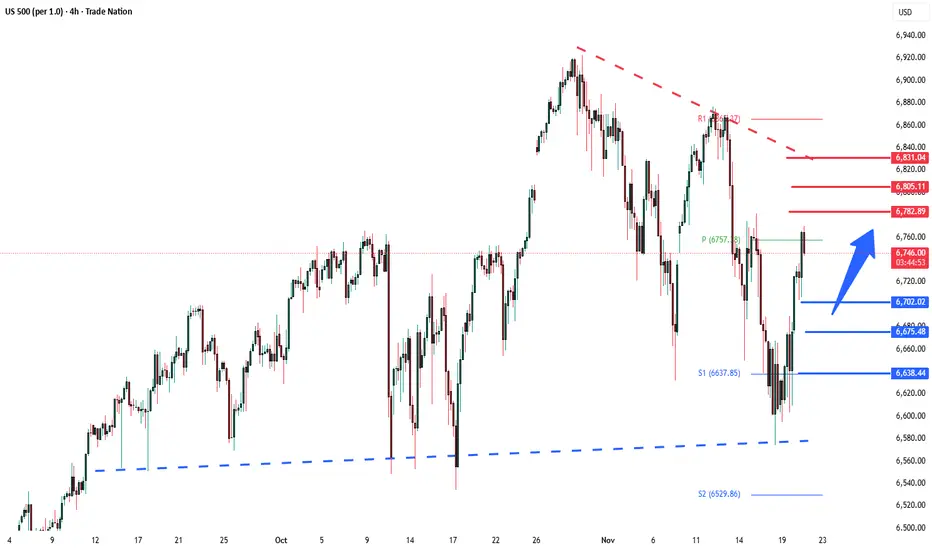
S&P500 Key Trading LevelsKey Support and Resistance Levels
Resistance Level 1: 6780
Resistance Level 2: 6805
Resistance Level 3: 6830
Support Level 1: 6700
Support Level 2: 6675
Support Level 3: 6638
This communication is for informational purposes only and should not be viewed as any form of recommendation as to a particular course of action or as investment advice. It is not intended as an offer or solicitation for the purchase or sale of any financial instrument or as an official confirmation of any transaction. Opinions, estimates and assumptions expressed herein are made as of the date of this communication and are subject to change without notice. This communication has been prepared based upon information, including market prices, data and other information, believed to be reliable; however, Trade Nation does not warrant its completeness or accuracy. All market prices and market data contained in or attached to this communication are indicative and subject to change without notice.
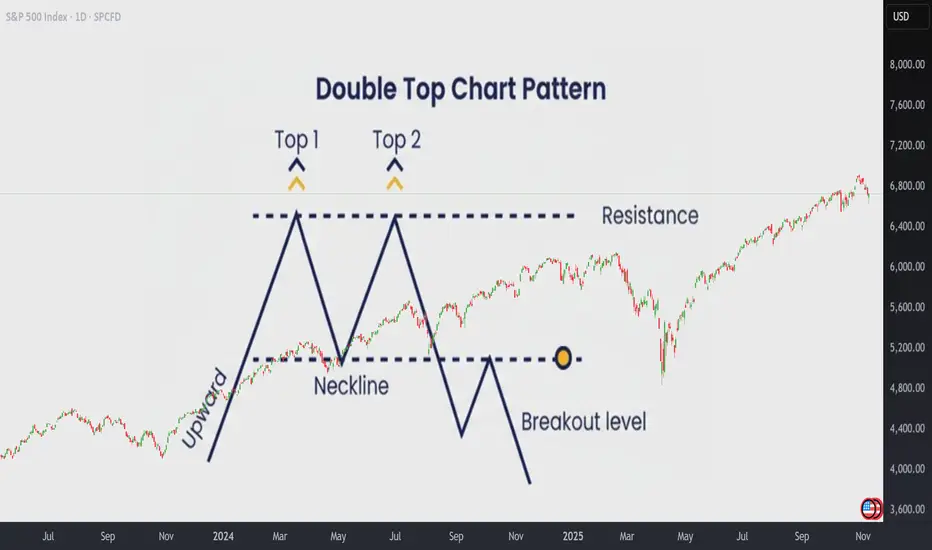
How to Trade the Double Top Pattern Like a ProHow to Trade the Double Top Pattern Like a Pro
The Double Top is one of the most reliable patterns in technical analysis. It often marks the beginning of a resistance zone and signals that bullish momentum is losing strength.
The first top is hard to anticipate, it’s usually just a continuation of the existing rally. But when the second top fails to break above the previous high, that’s when things get interesting . This failure creates a resistance level, and it’s the first warning sign that buyers may be running out of steam.
🔵 Why Do Double Tops Form?
There are usually two main reasons why a Double Top appears:
Profit-taking after a strong rally.Bulls start to lock in profits, causing the momentum to fade.
Lack of new buyers . Demand weakens, and bears begin to take control gradually.
Learning to tell which case you’re facing can help you decide whether it’s a great buying opportunity during a healthy pullback, or a signal to take profits, or even go short .
🧭 Step 1: How to Identify a Real Double Top
Before trading it, make sure it’s a true Double Top:
- Both peaks must form after a strong upward move . If the market was falling before, it’s not a classic pattern.
- The two tops should be at almost the same price level (no more than a 0.5% difference).
- The most important part is the neckline , the lowest point between the two tops.
That neckline defines whether the move is just a healthy pullback or the beginning of a new downtrend.
If the neckline doesn’t break, there is no Double Top yet.
The pattern is only confirmed after the neckline breaks downward.
💥 Step 2: Trading the Pattern
There are three main scenarios to understand:
1️⃣ A Confirmed Double Top (Breaks Down)
When the neckline breaks, the market often drops about 61.8% of the pattern’s height, with a probability above 70%.
A small pullback to retest the neckline is possible, but usually, the price won’t return to the previous highs.
A Double Top is spotted:
The neckline is broken:
A decline happens sharply:
2️⃣ A Fake Double Top (Break Fails)
If the price fails to break the neckline and instead makes new highs, it’s not a real Double Top.
This typically means we’re in a profit-taking phase, not a trend reversal.
In these cases, it’s often best to stay out, as the market tends to move sideways or show mixed signals.
A spotted double Top:
Fails to break down, instead breaks up:
The rally unfolds:
3️⃣ A Double Top Trap in a Strong Bull Market
Sometimes, a small break below the neckline triggers stops before the price explodes higher again.
These are common during powerful bull runs.
A spotted double Top:
The neckline is broken:
Inmediately the price reverse and break upwards.
The price rallies:
💲 Real Double Tops:
Theory is simportant, but let's go real!
A Double Top is now unfolding in Microsoft , and as you can see the neckline is almost there! Is this a signal? Wil a fake breakout occur? Are we witnesing the end of AI rally?
And some previous Double Tops:
❗ A final recommendation
Tradingview offers a great indicato r to Spot Double Top patterns easily.
Once you are in a chart, click on indicators and search Double Top Chart Pattern indicator. It's only for paid users and works fine!
Take a look how it spots the Double Top pattern and also gives you and idea of the posible target price!
Or the current one in NASDAQ:MSFT
In short:
Double Tops work roughly 70% of the time , but context matters.
They perform best in sideways or slowing markets, and are less reliable in strong rallies , where false breaks can easily trap traders.
Always confirm the neckline break, watch for volume, and never forget:
A pattern is just a probability, not a guarantee.
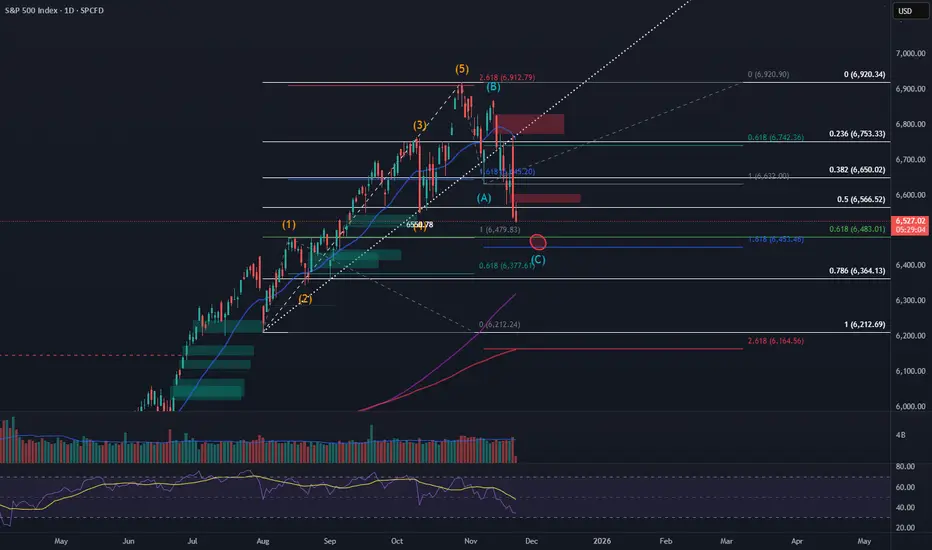
SPX Corrective Wave C Approaching Key Fibonacci ConfluenceThe S&P 500 appears to be completing an A–B–C corrective structure following the recent top. Price is currently breaking below wave (A) and moving toward a strong confluence zone at the 0.618–1.618 Fibonacci levels. This area aligns with prior demand, trendline support, and measured targets, making it a potential reversal zone for wave (C). Watching for bullish reaction or confirmation before considering upside continuation.
SPX500USD could still go upHi traders,
Last week SPX500USD went up and down and on Friday evening it started an impulsive move up again.
The pattern could be an ending diagonal (wave 5) or an (orange) wave 4 Triangle (both exist of internal three waves).
So next week we could see more (corrective or impulsive) upside for this pair.
Let's see what the market does and react.
Trade idea: Wait for a small correction down on a lower timeframe. After a change in orderflow to bullish you could trade longs.
This shared post is only my point of view on what could be the next move in this pair based on my technical analysis.
But I react and trade on what I see in the chart, not what I've predicted or expect.
Don't be emotional, just trade your plan!
Eduwave

S&P500 The Week Ahead Key Trading Levels Key Support and Resistance Levels
Resistance Level 1: 6866
Resistance Level 2: 6890
Resistance Level 3: 6920
Support Level 1: 6704
Support Level 2: 6675
Support Level 3: 6650
This communication is for informational purposes only and should not be viewed as any form of recommendation as to a particular course of action or as investment advice. It is not intended as an offer or solicitation for the purchase or sale of any financial instrument or as an official confirmation of any transaction. Opinions, estimates and assumptions expressed herein are made as of the date of this communication and are subject to change without notice. This communication has been prepared based upon information, including market prices, data and other information, believed to be reliable; however, Trade Nation does not warrant its completeness or accuracy. All market prices and market data contained in or attached to this communication are indicative and subject to change without notice.

S&P anticipation for the 2025 ending It requires no many words to tell the trues.
I Think it might be double zigzag reaching at least 5800, in zone where 4th wave ending

S&P Comparison With October 2021 PeakThe yellow bars are cloned from S&P’s move starting from October 2021 which ended with a peak followed by a long downtrend. The patter seems almost identical. Let’s see if it will make the same move that I’ve also added. Rsi and Macd show negative divergences. Don’t forget to look at the weekly and monthly charts as well to see a better vision forward.

S&P 500 instant pullback to 6100 index points/SPX strong drop Recent market dynamics suggest that the S&P 500 is entering a structurally vulnerable phase, in which valuation extension, momentum fatigue, and deteriorating breadth are becoming increasingly evident. The index’s move toward the 6,920 level represents a meaningful dislocation from its prior equilibrium near 6,245, following an unusually rapid ~35% appreciation from May to November — such acceleration is historically difficult to sustain without a subsequent period of normalization.
From a longer-term vantage point, the S&P 500’s rise from the depths of the 2008 crisis (~800–1,000 index points) to present levels underscores the magnitude of the rally and the extent of multiple expansion embedded in the current valuation base.
From a technical and quantitative perspective, the 1-month StochRSI is beginning to turn lower, signalling a loss of trend durability at a time when price is exhibiting characteristics typically associated with late-cycle exhaustion. When momentum decelerates while price continues to extend, markets often transition into fast, liquidity-driven retracements rather than orderly consolidations.
Against this backdrop, a corrective phase in the magnitude of 7–10%*appears increasingly plausible. Should this materialise, the probability rises for the index shifting into a sequence of lower highs, effectively re-introducing two-way risk after months of one-directional flow dominance.
From a longer-term risk view, a more extended decline toward the 4,200index-point region cannot be ruled out, given how stretched valuations and momentum have become.
For institutional participants, this environment warrants a disciplined reassessment of exposure, with selective hedging or tactical downside positioning considered within a well-defined risk-management framework.
apolloacademy.com
darinnewsom.com
tradethatswing.com
#SP500 #Equities #GlobalMarkets #MarketOutlook #RiskManagement
#Volatility #MacroStrategy #AssetAllocation #MarketStructure
#QuantResearch #TechnicalAnalysis #InvestmentStrategy
#GoldmanSachs #JPMorgan #MorganStanley #BankofAmerica
#Citi #UBS #DeutscheBank #HSBC #Barclays #BNPP #SocGen
#ING #RBC #Nomura #Mizuho #WellsFargo #Jefferies #Macquarie
#BlackRock #Bridgewater #Citadel #TwoSigma #Point72
#Millennium #AQR #Fidelity #Vanguard #StateStreet #PIMCO
#HedgeFunds #InstitutionalInvesting #PortfolioManagement

SPX NOV 2025SPX rejects 6900 supply, holding 6700.
Distribution 6900/6150.
Up tgt 6955-7000, down tgt 6500-6400.
#SPX #globaltrade #investment #investing #stockmarket #wealth #realestate #markets #economy #finance #money #forex #trading #price #business #currency #blockchain #crypto #cryptocurrency #airdrop #btc #ethereum #ico #altcoin #cryptonews #Bitcoin #ipo

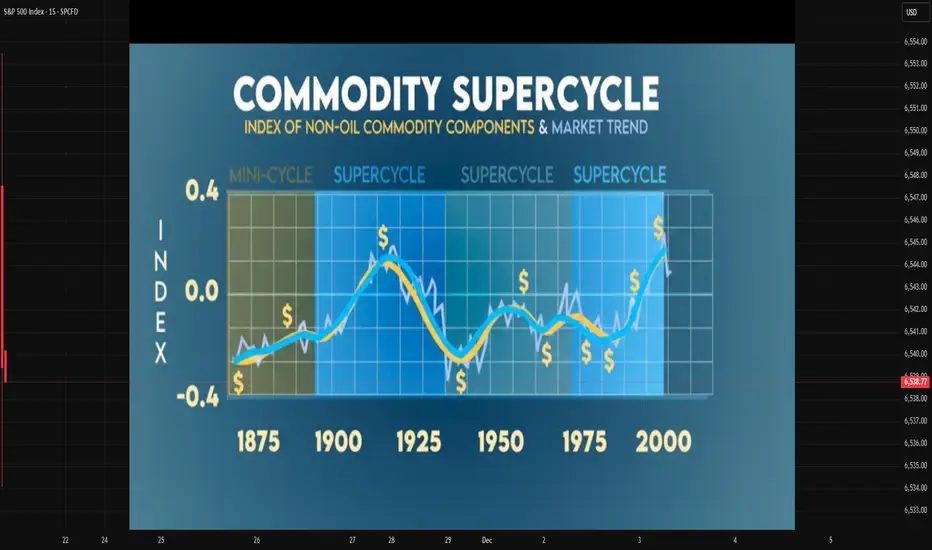
Commodity Supercycle Trends1. Understanding the Concept of Supercycles
Commodities traditionally move in cycles based on supply–demand fluctuations, but a supercycle is different in scale and duration. Price trends in supercycles tend to:
Last for 10–20 years
See sustained upward trajectories
Be driven by massive structural demand
Cause large-scale capital investments and supply expansions
Supercycles usually involve multiple commodities rising together, including crude oil, copper, aluminum, iron ore, wheat, corn, and rare earth metals.
2. Historical Commodity Supercycles
Economists identify four major commodity supercycles in the past 150 years:
a. Late 19th-Century Industrialization Supercycle (1890s–1910s)
This era coincided with the rapid industrial expansion in the US and Europe. Demand surged for coal, metals, and agricultural output to support railway construction, electricity expansion, and manufacturing.
b. Post-WWII Reconstruction Supercycle (1945–1970)
After World War II, Europe and Japan undertook large-scale rebuilding. This sharply increased the demand for energy, steel, and industrial metals. The global population was also rising rapidly, driving agricultural commodity consumption.
c. China-Led Supercycle (2000–2014)
Perhaps the most notable modern supercycle, driven by:
China’s industrialization and urbanization
Massive infrastructure investment
Globalization and trade expansion
Strong energy demand, especially crude oil
Metals like copper, iron ore, and aluminum saw exponential price growth during this period.
d. The “Green Transition” and Renewables Supercycle? (2020s–ongoing)
There is debate over whether the post-2020 environment constitutes a new supercycle. Still, strong demand for battery metals, rare earth elements, lithium, nickel, copper, and silver—essential for clean energy technologies—suggests a potential long-duration upward trend.
3. Drivers Behind Commodity Supercycles
Supercycles are created by mega-trends rather than short-term economic fluctuations. Key drivers include:
a. Industrialization and Urbanization
Emerging economies (e.g., China in the 2000s, India in the 2020s) undergo phases where construction, manufacturing, and infrastructure grow at a rapid pace. This increases demand for:
Steel and iron ore
Cement
Base metals
Energy fuels
b. Technological Shifts
New technologies can reconfigure commodity demand:
Electric vehicles → lithium, nickel, cobalt
Solar energy → silver, polysilicon
Semiconductor demand → rare earths
Technological revolutions often create entirely new commodity markets.
c. Population Growth and Changing Consumption Patterns
Growing populations increase demand for:
Food grains (wheat, rice, corn)
Protein (soybean, livestock feed)
Energy (oil, natural gas)
Urban lifestyles also increase per-capita metal and energy consumption.
d. Underinvestment in Supply
Supercycles often begin after years of:
Low commodity prices
Reduced mining investment
Capacity shrinkage
Supply chain disruptions
When demand picks up suddenly, supply cannot catch up, causing prices to surge.
e. Monetary and Fiscal Stimulus
Loose monetary policy or money supply expansion can raise:
Inflation
Liquidity in markets
Investment in commodity funds
This increases speculative and real demand for commodities.
4. The 2020s: Are We in a New Commodity Supercycle?
Analysts worldwide debate whether the 2020s reflect the start of a new supercycle. Several powerful forces suggest this possibility:
a. Energy Transition and Green Technologies
The transition to a low-carbon global economy hugely increases demand for:
Copper (electric grids, EVs)
Lithium (EV batteries)
Nickel, cobalt (battery chemistry)
Silver (solar panels)
Rare earths (wind turbines, electronics)
Estimates show the energy transition may require 3–10 times more metals compared to the current baseline.
b. Supply Constraints
This decade faces:
Mine depletion
Scarcity of high-grade ores
Stringent environmental rules
Slow permitting processes
Geopolitical resource nationalism (Africa, Latin America)
Supply shortages amplify price pressures.
c. Geopolitical Shifts
Conflicts and tensions between major powers affect commodity flows:
US–China rivalry impacts rare earths
Middle East tensions influence oil
Russia’s sanctions affect natural gas and metals
Realignment of supply chains supports longer-term price elevation.
d. Climate Change Disruptions
Extreme weather affects:
Agricultural output
Mining operations
Shipping routes
More frequent droughts, floods, and storms disrupt supply and raise volatility.
5. Major Commodities Likely to Dominate the Coming Supercycle
1. Copper
Considered the “new oil” of the green economy, copper demand is expected to surge due to:
EVs requiring 2–4 times more copper
Renewable energy grids
Electrification of industries
2. Lithium
A core input for batteries, with demand expected to grow 10–15x by 2035.
3. Nickel and Cobalt
Key metals for high-density battery chemistries.
4. Crude Oil
Despite renewable energy growth, oil demand remains strong due to:
Aviation
Petrochemicals
Industrial use
Slow transition in developing countries
5. Natural Gas and LNG
Seen as a “bridge fuel” in the transition away from coal.
6. Agricultural Commodities
Food prices are rising due to climate volatility and rising global population.
7. Precious Metals (Gold, Silver)
Investors hedge against inflation, currency depreciation, and geopolitical uncertainty.
6. Investment and Trading Implications
a. Long-Term Opportunities
A supercycle supports multi-year rallies in:
Mining stocks
Metal ETFs
Energy companies
Commodity indices
b. Volatility Will Remain High
While long-term trend is upward, short-term fluctuations will be sharp due to:
Interest rate swings
Policy changes
Currency volatility
c. The Role of Emerging Markets
India, Indonesia, Vietnam, and parts of Africa are entering new phases of:
Industrialization
Infrastructure spending
Urbanization
This will add structural demand to the global commodity landscape.
d. ESG and Sustainability Constraints
Environmental regulations limit new mining capacity, pushing prices higher.
7. Conclusion
Commodity supercycles represent long-term, structural shifts in global economic dynamics. They arise when powerful forces—industrialization, population growth, technology transitions, geopolitics, and supply constraints—drive sustained commodity demand. The world today is experiencing pressures that resemble previous supercycle conditions, especially with the rise of green energy, supply chain restructuring, and climate-driven disruptions. Whether or not this evolves into a full-fledged supercycle, commodities like copper, lithium, nickel, crude oil, natural gas, and agricultural products are likely to experience elevated demand and significant price appreciation in the years ahead. Understanding these trends helps investors and policymakers strategize effectively in a resource-constrained and rapidly evolving global economy.
The U.S.–China Trade War1. Background: Why the Trade War Started
a. Massive Trade Imbalance
For decades, the United States imported far more goods from China than it exported. By 2017, the U.S. trade deficit with China exceeded $375 billion, which American policymakers viewed as evidence of unfair trading practices.
b. Intellectual Property (IP) Theft and Technology Transfer
U.S. companies complained that China forced foreign firms to share technology in exchange for market access. Additionally, the U.S. accused China of:
Stealing intellectual property through cyber intrusions
Subsidizing state-owned enterprises with cheap credit
Dumping low-cost goods in global markets
These practices, according to the U.S., distorted global competition.
c. China’s Rise as a Technological Power
China’s “Made in China 2025” strategy aimed to dominate high-tech industries such as robotics, AI, aerospace, and semiconductors. The U.S. viewed this as a threat to its long-term technological leadership.
d. National Security Concerns
American officials argued that Chinese tech companies like Huawei could pose espionage threats. The trade war soon blended with a tech war and a strategic rivalry.
2. The Escalation Phase: Tariffs and Counter-Tariffs
a. Initial U.S. Tariffs (2018)
The U.S. imposed tariffs on $50 billion worth of Chinese goods, targeting machinery, electronics, and industrial components. China responded with tariffs on American agricultural products like soybeans, pork, and dairy.
b. Expansion to Consumer Goods
As tensions escalated, the U.S. placed tariffs on an additional $200 billion worth of Chinese goods, including consumer items such as:
Furniture
Electronics
Clothing
Household items
China retaliated with tariffs on $60 billion of U.S. goods.
c. Final Wave and “Phase One Deal”
By late 2019, almost two-thirds of U.S.–China trade was under tariffs. In January 2020, both countries signed the Phase One Agreement, where China agreed to purchase more American goods and strengthen intellectual property protection. However, the deal did not address deeper structural issues.
3. Beyond Tariffs: The Technology and Investment War
a. Restrictions on Chinese Tech Firms
The U.S. restricted Huawei, ZTE, and other Chinese companies from accessing:
U.S. semiconductor technology
5G infrastructure equipment
Key software like Google services for Android
Huawei was placed on the “Entity List,” preventing American firms from supplying critical components.
b. Semiconductor War
Semiconductor technology became the center of conflict. The U.S. banned China from acquiring advanced chips and restricted chip manufacturing equipment from being exported to Chinese firms. This was aimed at slowing China’s progress in AI, quantum computing, and advanced communications.
c. Investment Restrictions
Both countries tightened rules on foreign investment:
The U.S. restricted Chinese investments in critical technologies.
China increased control over foreign companies through cybersecurity and data-security laws.
This created a decoupling of financial and technological systems.
4. Impact on China
a. Economic Slowdown
China’s export-led growth model faced challenges. Although China remained a major global exporter, companies diversified supply chains away from China toward countries like:
Vietnam
India
Bangladesh
Mexico
b. Pressure on Manufacturing and Technology
Restrictions on semiconductors severely affected high-tech sectors. China accelerated self-reliance strategies by investing heavily in domestic chip production and R&D.
c. Weakening Consumer Confidence and Capital Outflows
Uncertainty caused foreign investors to move capital out of China, affecting markets, real estate, and currency stability.
5. Impact on the United States
a. Higher Costs for Consumers
Tariffs on Chinese goods raised prices for U.S. households. Since many consumer electronics, clothing items, and household goods came from China, Americans faced higher inflationary pressure.
b. Pain for U.S. Farmers
China’s tariffs on American soybeans and agricultural products hit U.S. farmers hard. The U.S. government provided billions of dollars in subsidies to offset losses.
c. Supply Chain Disruptions
U.S. companies relying on Chinese manufacturing—such as Apple, automakers, and retail brands—faced rising production costs and logistical complexities.
d. Push for Manufacturing Reshoring
The U.S. government increased incentives to bring manufacturing back home or shift it to allied countries like Mexico, India, and Vietnam.
6. Global Impact: Redefining Global Supply Chains
a. Rise of “China+1” Strategy
Companies worldwide began reducing dependence on China by diversifying production. India, Vietnam, and Southeast Asia gained momentum as alternatives.
b. Fragmentation of Global Trade
The world economy became more regionalized:
U.S.-led trade blocs (USMCA, Indo-Pacific Economic Framework)
China-led initiatives (RCEP, Belt and Road Initiative)
c. Impact on Emerging Markets
Some countries benefited from shifting supply chains, while others faced instability due to global uncertainty.
d. Inflation and Global Slowdown
Tariffs increased global costs, contributing to inflation across multiple sectors such as electronics, textiles, and consumer goods.
7. Strategic Competition: Trade War → Tech War → Cold War 2.0
The conflict has transformed into a broader geopolitical rivalry. It now includes:
AI competition
Military modernization
Spy balloon and cyber espionage disputes
Competing global standards
Tech alliances and sanctions
Both nations are preparing for long-term strategic competition.
8. Current Status and Future Outlook
a. Tariffs Largely Remain
Despite leadership changes in the U.S., most tariffs are still in place.
b. De-risking, Not Full Decoupling
The world is moving toward reducing reliance on China without a complete separation.
c. Semiconductor restrictions will intensify
The chip war is expected to become the central battlefield for technological dominance.
d. Global trade order is shifting
The WTO’s influence is weakening as bilateral trade battles rise.
e. Possibility of Future Negotiations
Although tensions are high, economic interdependence means negotiations remain possible.
Conclusion
The U.S.–China trade war is far more than a dispute over tariffs. It is a historic economic and geopolitical struggle that reflects a deeper rivalry between the world’s two largest powers. What began as a disagreement over trade imbalances and intellectual property has expanded into technology, security, and global influence. Its ripple effects have transformed global supply chains, increased geopolitical divisions, and ushered in a new era of strategic competition. As both countries continue to assert their economic and technological ambitions, the trade war is likely to remain a defining feature of international relations for years to come.

Get ready for 7000Price has completed a clean 5-wave impulse followed by an ABC correction, now landing right on trendline support. If this C-wave holds, the setup hints at the beginning of a fresh bullish leg toward the 7000 psychological level. Watching for confirmation—momentum shift, higher lows, and volume pickup. Bulls might not be tired of winning just yet.
Remember to ignore the noise, follow technicals and you’ll always end up on the right side of the trade ! Good luck and wait for confirmation

S&P500 New Bullish Leg confirmed targeting 7150.The S&P500 index (SPX) offered us, as we mentioned on our last analysis, an excellent buy opportunity last Friday as it hit its 1D MA50 (blue trend-line) and bounced.
Having broken and closed yesterday above its 4H MA50 (red trend-line), it has technically confirmed the new Bullish Leg of the 6-month Channel Up. Based on all previous ones, it should target the 2.5 Fibonacci extension at 7150, which remains our long-term Target for the end of the year.
Notice also how similar the 1D RSI patterns are of October and August. Steady rise is expected for November getting into December.
---
** Please LIKE 👍, FOLLOW ✅, SHARE 🙌 and COMMENT ✍ if you enjoy this idea! Also share your ideas and charts in the comments section below! This is best way to keep it relevant, support us, keep the content here free and allow the idea to reach as many people as possible. **
---
💸💸💸💸💸💸
👇 👇 👇 👇 👇 👇

Hellena | SPX500 (4H): LONG to max of wave "3" area of 6929.4.Good afternoon colleagues, it looks like the correction is ending and soon I expect wave “5” in the upward movement. Perhaps wave “4” will update the low of 6637.8 before the upward movement.
I expect to reach the maximum of wave “3” at 6929.4. Further we will observe the price behavior in this area.
Fundamental Background
The US stock market remains positive: business activity data showed a steady expansion, which strengthens confidence in corporate earnings.
Manage your capital correctly and competently! Only enter trades based on reliable patterns!

S&P500 H1 | Bullish Bounce off Key SupportMomentum: Bullish
Price is currently within the bullish ichimoku cloud.
Buy entry: 6,817
- Strong overlap support
- 23.6% Fib retracement
- 127.2% Fib extension
Stop Loss: 6,774
- Swing low support
Take Profit: 6,874
- Swing high resistance
Stratos Markets Limited (tradu.com/uk ), Stratos Europe Ltd (tradu.com/eu ):
CFDs are complex instruments and come with a high risk of losing money rapidly due to leverage. 70% of retail investor accounts lose money when trading CFDs with this provider. You should consider whether you understand how CFDs work and whether you can afford to take the high risk of losing your money.
Stratos Global LLC (tradu.com/en ): Losses can exceed deposits.

S&P500 (US500): Important Breakout & Bullish Continuation
US500 likely completely a correctional movement,
breaking a resistance line of a bullish flag pattern on a 4H time frame.
I think that a bullish wave is going to start soon
and the market will reach at least to 6917 level.
❤️Please, support my work with like, thank you!❤️
I am part of Trade Nation's Influencer program and receive a monthly fee for using their TradingView charts in my analysis.

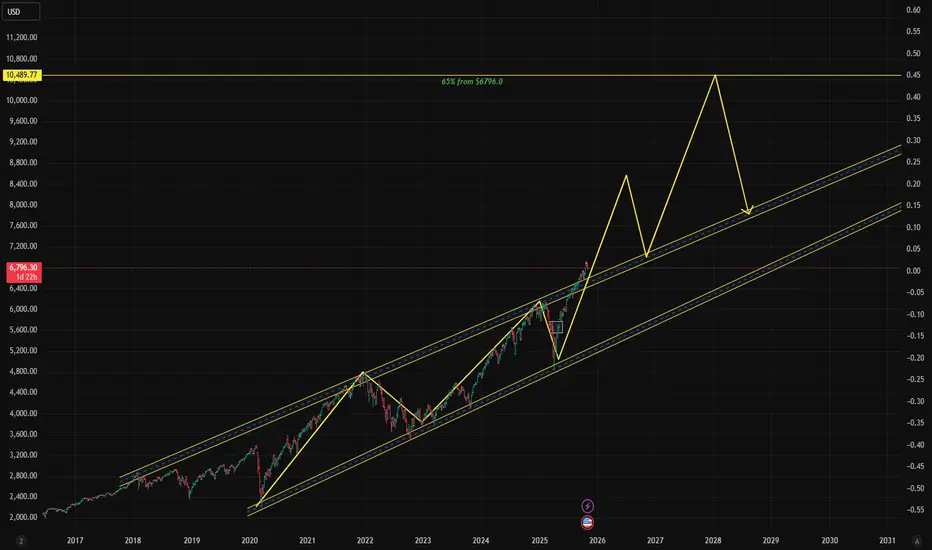
$SPX Hi, we are back with another one: SP:SPX !!!
As we can see we have SP:SPX sitting at $6796.30 with and expectation for a 65% pump.
That would bring us around $9-$10K per 1 SP:SPX .
Wouldn't that be incredible if we can see this by 2026 -2028 ?
What a time to be alive no ?
Don't forget to comment like and share for good luck :) !!!
Bullish continuation in play?S&P500 (US500) has bounced off the pivot and could potentially rise to the 1st resistance.
Pivot: 6,827.13
1st Support: 6,745.48
1st Resistance: 7,006.51
Disclaimer:
The opinions given above constitute general market commentary and do not constitute the opinion or advice of IC Markets or any form of personal or investment advice.
Any opinions, news, research, analyses, prices, other information, or links to third-party sites contained on this website are provided on an "as-is" basis, are intended to be informative only, and are not advice, a recommendation, research, a record of our trading prices, an offer of, or solicitation for, a transaction in any financial instrument and thus should not be treated as such. The information provided does not involve any specific investment objectives, financial situation, or needs of any specific person who may receive it. Please be aware that past performance is not a reliable indicator of future performance and/or results. Past performance or forward-looking scenarios based upon the reasonable beliefs of the third-party provider are not a guarantee of future performance. Actual results may differ materially from those anticipated in forward-looking or past performance statements. IC Markets makes no representation or warranty and assumes no liability as to the accuracy or completeness of the information provided, nor any loss arising from any investment based on a recommendation, forecast, or any information supplied by any third party.

SPX – Recovery Momentum Gradually ReturningThe U.S. stock market is regaining its upward rhythm after a period of correction, as investor sentiment improves notably on hopes that the U.S. government shutdown will soon end .
At the same time, the U.S. Dollar Index has stalled and bond yields have slightly declined , creating favorable conditions for capital to return to large-cap equities.
On the 4H chart, SPX maintains a steady ascending channel structure , and the sharp rebound from the 6,800 zone signals that buyers are regaining control.
The current setup suggests the index could continue rising toward the 7,000 level, before a minor technical pullback — a healthy move to build momentum for the next leg higher toward the upper boundary of the channel.
With market sentiment turning increasingly positive , supported by bullish forecasts from major institutions like UBS (targeting S&P 500 at 7,500 by 2026), the short-term bullish bias for SPX remains intact.
As long as 6,800 holds firm, the uptrend structure stays valid, reflecting growing confidence that the U.S. market recovery cycle is far from over.
