American Financial Pulse: U.S. Markets Shape the Global Economy1. The Rise of U.S. Financial Dominance
After World War II, the world needed stability — and the United States provided it. The Bretton Woods Agreement (1944) established the U.S. dollar as the central pillar of the international monetary system. With the world’s gold reserves concentrated in America, other countries pegged their currencies to the dollar.
Even after the gold standard ended in 1971, the dollar’s dominance remained intact. U.S. financial markets grew deeper, more liquid, and more sophisticated than any other. Investors from around the world began to see U.S. Treasury securities as the safest asset, and corporations preferred raising funds through American capital markets.
By the 21st century, Wall Street had become the nerve center of global finance, home to some of the largest and most influential institutions — Goldman Sachs, JPMorgan Chase, Morgan Stanley, Citigroup, and others.
2. Wall Street: The Barometer of Global Sentiment
When the New York Stock Exchange (NYSE) or NASDAQ moves, the world pays attention. Wall Street’s performance often sets the tone for markets across Asia and Europe.
Bullish sentiment in the U.S. can lift markets worldwide, signaling economic optimism and boosting commodity prices.
Bearish or volatile trends, on the other hand, can spark global risk aversion, leading to sell-offs in emerging markets.
For instance:
The 2008 Global Financial Crisis, which started with the collapse of U.S. housing markets, triggered the worst worldwide recession since the Great Depression.
The tech boom of the 2010s, driven by Silicon Valley giants like Apple, Microsoft, and Amazon, created wealth and innovation ecosystems that influenced startups and stock markets globally.
In short, Wall Street isn’t just America’s financial hub — it’s the world’s emotional pulse of risk and reward.
3. The U.S. Dollar: The Global Reserve Currency
The U.S. dollar is the king of currencies — a symbol of trust, strength, and stability. Around 60% of global foreign exchange reserves are held in dollars, and most international trade and commodities (like oil and gold) are priced in USD.
This dominance gives the U.S. a unique “exorbitant privilege” — the ability to borrow cheaply, attract global capital, and wield financial sanctions effectively.
When the Federal Reserve raises or cuts interest rates, it doesn’t just affect the U.S. — it reshapes capital flows globally. A stronger dollar often leads to:
Capital outflows from emerging markets,
Currency depreciation in developing economies, and
Higher import costs for countries that rely on dollar-denominated trade.
Conversely, a weaker dollar can boost global liquidity and commodity prices, supporting international growth.
4. The Federal Reserve: The World’s Central Bank
The Federal Reserve (Fed) is not just America’s central bank — it’s the de facto central bank of the world.
Its policies on interest rates, inflation control, and money supply influence nearly every financial market globally. When the Fed tightens or loosens monetary policy, it sets off a chain reaction:
Bond yields shift across continents.
Exchange rates fluctuate.
Stock markets either rally or crash.
Take 2022–2023, for example: the Fed’s aggressive rate hikes to fight inflation caused global investors to flock to the dollar, leading to currency depreciation in Europe, India, and Japan. Developing nations faced capital outflows and rising borrowing costs, proving once again how America’s monetary policy reverberates worldwide.
5. U.S. Tech Giants and Their Global Economic Influence
Beyond monetary policy, corporate America also drives global trends. Tech companies such as Apple, Microsoft, Amazon, Google, Meta, and Tesla not only dominate U.S. indices like the NASDAQ but also shape global consumer behavior, innovation cycles, and investment trends.
Their market capitalization exceeds the GDP of many countries.
Global funds benchmark their performance against these companies.
Even non-U.S. economies depend on their supply chains and technologies.
For instance, Apple’s supply chain decisions in China or India influence local employment, manufacturing, and even government policy. Similarly, Tesla’s electric revolution has pushed automakers worldwide to accelerate their shift toward EVs.
These corporations make the American economy a key driver of global innovation and productivity.
6. The U.S. Bond Market: The Global Safe Haven
The U.S. Treasury market, valued at over $27 trillion, is the most liquid and trusted debt market in the world.
In times of global uncertainty — wars, pandemics, recessions — investors rush to buy U.S. bonds, driving up their prices and lowering yields. This phenomenon is known as a “flight to safety.”
For example:
During the COVID-19 pandemic, despite global chaos, demand for U.S. bonds surged.
Even amid geopolitical tensions like the Russia-Ukraine conflict, U.S. Treasuries remained the go-to safe asset.
This trust reinforces the U.S. government’s financial supremacy, allowing it to borrow at low rates and sustain high fiscal spending without immediate repercussions.
7. American Trade and Global Supply Chains
America’s financial strength isn’t just about Wall Street — it’s also about trade and consumer power. The U.S. is one of the largest importers and consumers in the world.
When American demand rises, exporters from China, India, Germany, and others benefit. When it slows, global trade suffers.
For instance:
The 2020–21 pandemic recovery in the U.S. boosted demand for goods, lifting export economies.
But slowing U.S. consumer spending in 2023–24 led to reduced factory orders worldwide.
Thus, the American consumer acts as the ultimate engine of global trade — their spending decisions echo through factories, ports, and currencies around the world.
8. U.S. Sanctions and Financial Power as a Tool of Diplomacy
One of the most significant, yet often overlooked, aspects of America’s financial influence is its ability to use economic sanctions as a form of global control.
Because the U.S. dollar dominates international transactions, most global banks and businesses rely on access to U.S. financial systems like SWIFT. When the U.S. imposes sanctions on countries like Iran, Russia, or Venezuela, it effectively isolates them from global finance.
This demonstrates the geo-financial power of America — the ability to influence political outcomes through control of money flow, rather than military force.
9. U.S. Market Crises and Global Shockwaves
History shows that financial turbulence in America often triggers worldwide crises:
1929: The Wall Street crash led to the Great Depression, spreading poverty and unemployment globally.
1987: Black Monday caused global stock market collapses within hours.
2008: The subprime mortgage meltdown triggered a global recession.
2020: The COVID-induced crash saw trillions wiped out globally within weeks.
Each time, recovery depended heavily on U.S. fiscal stimulus and Federal Reserve actions — highlighting both the risks and the resilience of America’s central role.
10. America’s Role in Emerging Market Dynamics
Emerging economies — such as India, Brazil, South Africa, and Indonesia — often experience boom-bust cycles tied to U.S. financial trends.
When U.S. interest rates are low, investors chase higher returns in emerging markets, driving asset prices up. But when the Fed tightens policy, capital retreats to the U.S., leaving these economies vulnerable to currency depreciation and inflation.
This cyclical dependency shows how America’s financial health acts as both an opportunity and a threat for developing nations.
11. The Future: Can the World De-Americanize Finance?
In recent years, there’s been growing talk of “de-dollarization” — the effort by countries like China, Russia, and members of BRICS to reduce dependence on the U.S. dollar.
While alternative payment systems and local-currency trade agreements are emerging, the U.S. still holds structural advantages:
Deep and transparent financial markets,
Strong legal systems,
Global investor trust, and
A culture of innovation.
Even as digital currencies and blockchain-based settlements evolve, the U.S. remains a central force in shaping the future of finance — through regulation, technological leadership, and institutional power.
12. Conclusion: The Unshakable Financial Pillar
America’s financial influence over the global market is a blend of trust, size, innovation, and history. Its currency drives trade, its markets dictate sentiment, and its policies shape growth trajectories worldwide.
From Wall Street traders to policymakers in Asia, from African commodity exporters to European bankers — all keep an eye on what happens in the United States.
While global diversification and regional powers continue to grow, the American financial system remains the spine of international economics. Its rhythm — whether fast or slow — continues to set the pace for the global financial symphony.
SPX trade ideas


The Role of Developed and Emerging Markets in the World Bank’s Introduction: A Tale of Two Worlds in One Financial Institution
The World Bank stands as one of the most influential international financial institutions in the modern era — a cornerstone of global economic stability and development. Since its establishment in 1944 at the Bretton Woods Conference, the World Bank has evolved from a post-war reconstruction lender to a powerhouse for global poverty reduction, infrastructure development, and economic reform.
At its heart, the World Bank is not merely a bank — it is a bridge between developed and emerging markets. Developed nations bring capital, expertise, and governance, while emerging economies bring growth, opportunities, and development challenges. Together, these two groups form the backbone of the institution’s structure, mission, and functioning.
This intricate partnership shapes the global economy, influences international policy, and determines the future of sustainable development. Understanding their respective roles within the World Bank reveals how global economic cooperation works — and sometimes, where it struggles.
1. The World Bank: Structure and Objectives
The World Bank Group (WBG) consists of five institutions:
International Bank for Reconstruction and Development (IBRD) – lends to middle-income and creditworthy low-income countries.
International Development Association (IDA) – provides concessional loans and grants to the poorest nations.
International Finance Corporation (IFC) – focuses on private sector development.
Multilateral Investment Guarantee Agency (MIGA) – offers political risk insurance and credit enhancement.
International Centre for Settlement of Investment Disputes (ICSID) – handles investment disputes between governments and foreign investors.
Together, they aim to reduce poverty, promote sustainable development, and enhance living standards across the world. But the direction of these goals and their implementation depend largely on the interplay between developed and emerging markets within the institution.
2. Developed Markets: The Pillars of Financial Strength
Developed economies — primarily the United States, Japan, Germany, France, and the United Kingdom — are the largest shareholders and financial contributors to the World Bank. Their roles are multifaceted and deeply rooted in both economic capacity and geopolitical influence.
A. Capital Contribution and Voting Power
The World Bank operates on a shareholding system where financial contributions determine voting power. Developed countries hold the majority of votes — for example, the U.S. alone has around 16–17% of voting rights, giving it significant influence over key decisions.
This capital infusion ensures the World Bank’s ability to provide loans at favorable rates to developing nations, maintain creditworthiness, and attract investors from international capital markets.
B. Policy Influence and Governance
Developed nations also shape the strategic priorities of the World Bank. They influence policy directions on:
Climate change initiatives
Good governance and anti-corruption frameworks
Debt sustainability
Gender equality and education programs
However, critics argue that this dominance can sometimes lead to policies that reflect the interests or economic ideologies of the developed world — particularly the neoliberal approach of privatization and deregulation.
C. Technical Expertise and Innovation
Developed economies contribute advanced research, technology, and institutional know-how to World Bank projects. For instance:
The U.S. contributes technological expertise in energy transition and innovation financing.
European countries drive climate adaptation, green infrastructure, and human rights frameworks.
Japan often supports disaster resilience and urban infrastructure development.
This infusion of expertise helps ensure that World Bank-funded projects are not only financially viable but also sustainable and modern in design.
3. Emerging Markets: The Engines of Growth and Development
Emerging economies — such as India, China, Brazil, Indonesia, and South Africa — play an equally vital yet distinct role within the World Bank. Once the primary recipients of development aid, many have now evolved into both borrowers and contributors.
A. Borrowers and Beneficiaries
Historically, emerging markets have been the primary recipients of World Bank loans and grants aimed at:
Building infrastructure (roads, dams, energy grids)
Expanding access to education and healthcare
Promoting agricultural and rural development
Strengthening governance and public institutions
For example:
India has been one of the largest recipients of World Bank loans, supporting rural electrification, sanitation, and digital finance initiatives.
China, before transitioning to an upper-middle-income economy, utilized World Bank funds to modernize infrastructure and improve poverty reduction programs.
These investments have had a profound multiplier effect — accelerating economic growth, improving living standards, and positioning these countries as regional powerhouses.
B. Emerging Donors and Shareholders
In recent years, several emerging economies have transitioned from aid recipients to development partners.
China has become a major shareholder and now contributes to World Bank financing pools.
India and Brazil participate in knowledge-sharing programs and South-South cooperation.
This evolution symbolizes a more balanced and inclusive global development model, where emerging economies not only receive aid but also help shape and fund development efforts in poorer nations.
C. Field Implementation and Local Innovation
Emerging markets also serve as testing grounds for innovative development models. Their on-ground experiences in poverty alleviation, microfinance, digital inclusion, and renewable energy provide blueprints for other developing nations.
For example:
India’s Aadhaar digital identity program inspired similar digital inclusion models across Africa.
Brazil’s Bolsa Família program influenced social welfare strategies in multiple countries.
Thus, emerging economies bring the voice of practicality, representing real-world development challenges and scalable solutions.
4. Collaboration Between Developed and Emerging Markets
The partnership between developed and emerging markets within the World Bank framework is both strategic and symbiotic.
A. Funding and Execution
Developed nations provide capital and governance, while emerging markets provide execution capacity and local insight.
This balance ensures that funds reach where they’re needed most and are used effectively for on-ground transformation.
B. Knowledge Transfer
The World Bank acts as a platform for knowledge exchange — developed countries share technical know-how, while emerging economies share policy lessons and innovations that work in resource-constrained environments.
C. Sustainable Development Goals (SDGs)
Both blocs are integral to achieving the United Nations’ 2030 SDGs. Developed nations finance and design global frameworks, while emerging markets implement and test these goals in diverse contexts — from renewable energy transitions to healthcare reforms.
5. Challenges in the Relationship
Despite mutual benefits, the relationship between developed and emerging markets in the World Bank is not without friction.
A. Governance Imbalance
Developing and emerging economies have long called for greater voting representation. Although reforms have been introduced, developed countries still dominate decision-making — limiting the voice of fast-growing economies like India or Brazil.
B. Policy Conditionalities
Many emerging nations criticize the World Bank’s loan conditions, which often require structural reforms like privatization or fiscal tightening. These can conflict with domestic socio-economic priorities and sometimes exacerbate inequality.
C. Geopolitical Tensions
The rise of China and the creation of the Asian Infrastructure Investment Bank (AIIB) has challenged the World Bank’s dominance, signaling emerging economies’ desire for alternative frameworks that better represent their interests.
D. Climate Finance Divide
Developed countries advocate for rapid green transitions, but emerging markets argue they need more time and support, as their economic growth still relies on energy-intensive sectors. Balancing development and decarbonization remains a key tension point.
6. The Evolving Role of Emerging Markets in the 21st Century
Emerging economies are no longer passive participants — they are increasingly shaping the World Bank’s agenda.
India champions digital public infrastructure and inclusive finance.
China promotes infrastructure-led growth and south-south cooperation.
Brazil emphasizes social protection and sustainable agriculture.
These nations push for a development model that blends economic growth with social inclusion, moving beyond the purely economic paradigms of the past.
Furthermore, as emerging markets contribute more financially and intellectually, the World Bank’s governance structure is slowly evolving toward greater inclusivity.
7. The Road Ahead: Toward a Balanced Global Partnership
For the World Bank to remain relevant in an increasingly multipolar world, it must strengthen the partnership between developed and emerging markets.
Key future directions include:
Reforming voting rights to reflect modern economic realities.
Enhancing transparency and accountability in project selection and implementation.
Promoting green finance and climate-resilient infrastructure, especially in the Global South.
Expanding digital transformation programs, leveraging emerging market innovation.
Encouraging co-financing and joint initiatives between developed and emerging nations.
The ideal future for the World Bank is not dominated by one group over another — but one where mutual respect, shared responsibility, and equitable participation drive global development.
8. Conclusion: A Shared Mission for Global Prosperity
The World Bank’s success depends on how effectively it balances the strengths of both developed and emerging markets. Developed countries provide stability, financial capacity, and institutional frameworks, while emerging economies bring energy, growth potential, and real-world experience.
Together, they represent the two engines of global progress — one supplying resources, the other driving innovation and execution.
As the 21st century unfolds, the collaboration between these two worlds within the World Bank will determine not only the institution’s future but also the fate of global development itself. The mission is clear: to bridge divides, foster inclusivity, and ensure that prosperity is not the privilege of a few nations — but the shared heritage of all.
Will the AI frenzy drive US indices to new record highs again?
Despite the US government shutdown risk and elevated valuation concerns, US equities continued their upward rally, driven primarily by strength in AI-related stocks.
OpenAI’s valuation has surged to USD 500 billion, a sharp jump from the USD 300 billion valuation in an earlier SoftBank-led funding round earlier this year. This makes OpenAI the most valuable startup in the world, surpassing SpaceX.
Citigroup (C) raised its forecast for global AI spending, projecting USD 490 billion by 2026 (up from USD 420 billion) and cumulative hyperscaler investments by Amazon (AMZN), Microsoft (MSFT), and others to reach USD 2.8 trillion by 2029, up from the previous USD 2.3 trillion estimate.
US500 extended its rally to a new record high, maintaining a solid uptrend within the ascending channel. The diverging bullish EMAs point to the potential continuation of bullish momentum. If US500 breaches above the psychological resistance at 6800, the index may gain upward momentum toward the next psychological resistance at 7000. Conversely, if US500 breaks below the support at 6700, the index could retreat toward 6530.
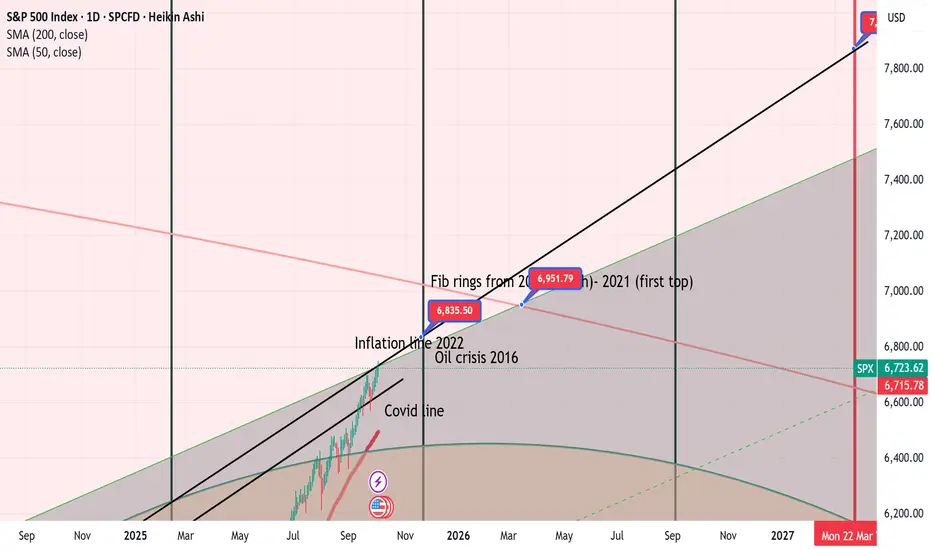
KEY AREASLiquidity is on the system. That will allow Spx continue growing. Now, the question is: How far Spx will go? and the most important. Until when?
Spx is clingin between very important support and resistance zones: Covid 2020, Oil 2016, previous tops (2021) and Inflation (2022).
The Gann cycle allows me to point out a date: 20th November as a key date. Cycles as this allows me to see a major break out.
We could see 7000 pips by the end of November and then a continuation.
Just have a look at this support and resistance areas which so far are playing out beautifuly.
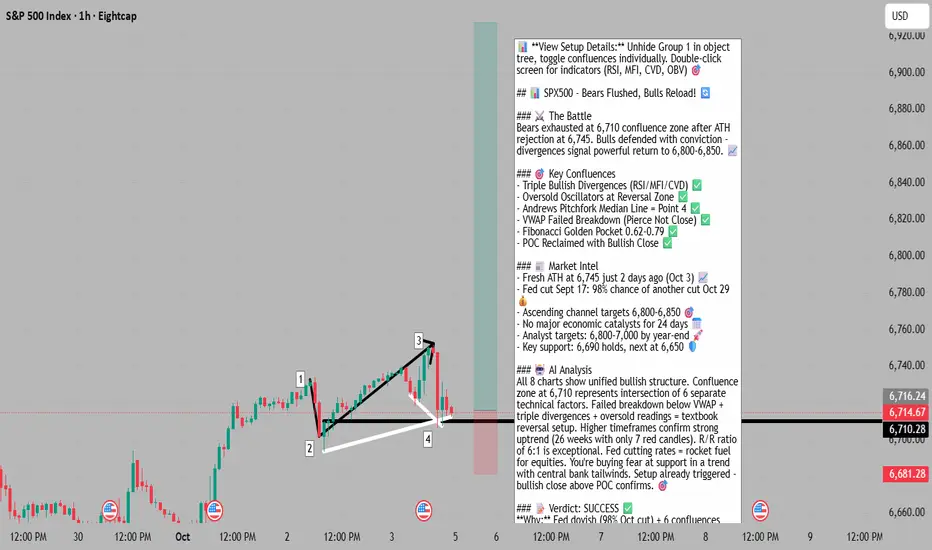
Bears Flushed at Channel Support - Bulls Reload 📊 **To view my confluences and linework:**
Step 1️⃣: Grab the chart
Step 2️⃣: Unhide Group 1 in the object tree
Step 3️⃣: Hide and unhide specific confluences one by one
💡 **Pro tip:** Double-click the screen to reveal RSI, MFI, CVD, and OBV indicators alongside divergence markings! 🎯
⚔️ Bears Flushed at Channel Support - Bulls Reload 🔄
The Market Participant Battle:
Bears just lost a critical skirmish. After pushing SPX down from fresh all-time highs at 6,745 on October 3rd, the selling pressure exhausted precisely at the intersection of multiple support confluences around 6,710. The setup is textbook: bears overextended their hand at a major resistance cluster (Andrews Pitchfork median line, VWAP standard deviation, golden Fibonacci zone), creating bullish divergences across RSI, MFI, and CVD. Bulls defended the 6,710 level with conviction, and now the spring is coiled for a powerful return back toward 6,800-6,850. This is classic institutional accumulation at support - let retail sell into strong hands, then reverse hard. 📈
Confluences:
Confluence 1: Triple Bullish Divergences (RSI, MFI, CVD) 📊
The 1-hour chart reveals the smoking gun: while price made lower lows from point 3 to point 4, RSI, MFI, and CVD all made higher lows. This is textbook bullish divergence indicating weakening bearish momentum despite falling price. The divergences are marked clearly on your indicators - RSI showed "Bear" tags at points 1, 2, and 3, but failed to confirm at point 4. MFI followed the same pattern. Most importantly, CVD (Cumulative Volume Delta) shows buyers stepping in despite price weakness, revealing hidden institutional accumulation. These divergences on the 1H timeframe carry significant weight, especially when confirmed across multiple momentum indicators simultaneously.
Confluence 2: Oversold RSI and MFI Conditions ⚡
Both RSI and MFI hit oversold territory at point 4, creating a classic mean-reversion setup. While the higher timeframes show SPX in overbought territory (which is normal in strong uptrends), the pullback created oversold readings on the 1H and 2H charts. This creates an asymmetric opportunity - buying at oversold levels within a confirmed uptrend. The RSI bounced from near 30, and MFI showed similar exhaustion. This oversold condition combined with the divergences suggests the selling pressure has been fully absorbed.
Confluence 3: Andrews Pitchfork - Median Line Precision 🎯
The Andrews Pitchfork anchored at points 1, 2, and 3 shows remarkable precision - point 4 landed exactly on the median line of the pitchfork. This is a high-probability reversal zone in pitchfork theory. The price action shows respect for this geometry, with the median line acting as dynamic support. The pitchfork structure suggests the next move should target the upper parallel channel line, which aligns with the 6,800-6,850 zone identified in broader market analysis. This technical pattern has been reliable throughout this uptrend sequence.
Confluence 4: Anchored VWAP - Failed Breakdown 💪
The VWAP anchored at point 1 (the swing low) provides critical context. Price pierced below the 1st standard deviation line but critically failed to close below it. This is a failed breakdown - a bullish signal that suggests sellers couldn't establish conviction below this institutional reference point. The wick below VWAP represents stop-hunting and capitulation selling, but the close back above the 1st standard deviation shows bulls defended this level aggressively. This failed breakdown pattern often precedes sharp reversals as shorts get trapped.
Confluence 5: Fibonacci Golden Zone (0.62-0.79 Retracement) 📐
The pullback from point 3 to point 4 retraced perfectly into the 0.62-0.79 Fibonacci zone - the "golden pocket" where probability favors reversals. This is the sweet spot for trend continuation entries. The fib extension from the 2→3 move shows point 4 landed right in this high-probability reversal zone. Combined with the other confluences, this creates a layered support structure that makes the 6,710 area a fortress for bulls.
Confluence 6: Developing POC and Volume Profile 📊
Your 2H chart shows a developing Point of Control (POC) at the recent low, with a bullish candle closing above it. This is significant - it shows that after the dip below the developing POC, buyers stepped in with conviction to reclaim it. The volume profile analysis suggests this area represents strong two-way trade, but the bullish close above the POC indicates buyers won this battle. This shift from below to above the POC is often an early signal of trend resumption.
Web Research Findings:
- **Technical Analysis:** SPX hit fresh all-time highs of 6,745-6,750 on October 3, 2025, just 2 days ago. The index is trading in a well-defined ascending channel that began on May 23, 2025. Current key support levels are 6,690 (short-term) and 6,120 (medium-term). Upside targets within the channel are 6,800-6,850, which represents the upper boundary of the ascending channel. Multiple technical analysts note that while RSI on higher timeframes is overbought (above 70), this can persist in strong uptrends. Investtech notes "no resistance in the price chart and further rise is indicated."
- **Recent News/Earnings:** The S&P 500 just posted its 52nd record high of 2025, closing above 6,700 for the first time. The market has shown exceptional strength with only 7 red weekly candles out of the last 26 weeks. Major tech companies continue to report strong earnings, with Nvidia announcing a massive $100 billion investment in OpenAI data centers. The market has largely shrugged off concerns about a potential US government shutdown, focusing instead on dovish Fed policy. Market breadth shows the only Mag-7 stocks above 2024 highs are Nvidia and Microsoft, suggesting some rotation but not broad weakness.
- **Analyst Sentiment:** Mixed but leaning bullish. Several analysts target 6,800-6,850 in the near term. Deutsche Bank's Chief Global Strategist calls for SPX to hit 7,000 by year-end. Some analysts warn of potential correction due to overbought conditions and breadth divergences, but most view any pullbacks as buyable. OANDA's Kelvin Wong states: "The US SPX 500 has continued to evolve within a medium-term ascending channel...The hourly RSI momentum indicator remains in a bullish momentum condition." However, some caution about euphoric sentiment and potential for healthy correction to 6,500 area if current levels fail.
- **Data Releases & Economic Calendar:** No major economic releases in the next 24-48 hours that could derail the setup. The critical September jobs report has already passed. The next significant event is the FOMC meeting on October 29, 2025 (24 days away). The US government shutdown may delay some economic data releases, but markets have shown resilience to this uncertainty.
- **Interest Rate Impact:** This is a MAJOR bullish catalyst. The Fed cut rates by 25 basis points on September 17, 2025, moving from 4.50% to 4.00%-4.25% range. CME FedWatch Tool shows 98% probability of another 25bp cut at the October 29 FOMC meeting, and 87% probability of a third cut in December. This would bring rates to 3.50%-3.75% by year-end. Fed Governor Stephen Miran has been pushing for even more aggressive cuts. The dovish Fed pivot is providing strong tailwinds for equities. Lower rates increase liquidity and typically fuel risk asset rallies. This is creating a "positive feedback loop" according to market analysts.
Layman's Summary:
Here's what all this means in simple terms: The S&P 500 just hit a new record high 2 days ago at 6,745, then pulled back to 6,710 - about a 0.5% dip. This is completely normal and healthy in an uptrend. The Federal Reserve (the people who control interest rates) just cut rates and is highly likely to cut again in 3 weeks. Lower interest rates are like rocket fuel for stocks because they make money cheaper and drive investors into equities. Your technical setup caught this pullback at the exact right spot - multiple indicators show the selling is exhausted and buyers are stepping back in. The big picture: we're in a strong uptrend with the central bank on our side, you're buying a small dip at strong support, and the path of least resistance is back up to 6,800-6,850. The risks? Market is a bit overbought on bigger timeframes, but in strong trends that can persist for a while. No major scary news on the horizon that would crash the market. This is a high-probability bounce setup in favorable market conditions. 🎯
Machine Derived Information:
- **Image 1 (1H Chart - Main Setup):** Shows the complete trade structure from points 1-4 with the Andrews Pitchfork and key horizontal support/resistance levels. The gray area is background, not a support box. Point 4 landed at the pitchfork median line around 6,710. **Significance:** This reveals the geometric precision of the reversal zone and the logical price structure. **AGREES ✔**
- **Image 2 (1H Chart - Annotations):** Details the specific confluences: 1→4 sequence, bullish divergences on RSI/MFI/CVD, oversold conditions, Andrews Pitchfork catching point 4 at median line, anchored VWAP pierce but no close below 1st std dev, and Fibonacci 0.62-0.79 pullback zone. **Significance:** This image provides the technical evidence backing the entire trade thesis - all confluences are clearly marked and valid. **AGREES ✔**
- **Image 3 (1H Chart - Bollinger Bands):** Shows the same setup with Bollinger Band overlay and cumulative delta analysis. Points 1-4 are marked with price action context. **Significance:** The Bollinger Band touch at point 4 adds another technical confluence, showing price reached the lower band (another oversold indicator) before reversing. **AGREES ✔**
- **Image 4 (1H Chart - Indicators Panel):** The most critical image - shows RSI with "Bear" tags at points 1, 2, and 3 (each at peaks), MFI weakness, and CVD analysis. The bullish divergences are visually obvious here as indicators make higher lows while price makes lower lows. **Significance:** This is the proof of momentum divergence - the engine driving the reversal setup. Shows clear exhaustion of selling pressure. **AGREES ✔**
- **Image 5 (1H Chart - Pitchfork Focus):** Zoomed view emphasizing the Andrews Pitchfork structure with downtrend lines. Shows how point 4 aligned perfectly with the median line. **Significance:** Reinforces the geometrical precision of the setup and the probability of mean reversion back toward the upper pitchfork boundary. **AGREES ✔**
- **Image 6 (2H Chart - Bigger Picture):** Steps back to the 2H timeframe showing the broader uptrend from 6,657 to the recent highs. Shows trend strength indicators: +28 bars uptrend on 50-bar basis, strong positive readings. The current level shows as TLPv27.1 with uptrend strength metrics. **Significance:** Confirms we're buying a pullback in a confirmed uptrend, not trying to catch a falling knife. The 2H timeframe validates the bullish structure. **AGREES ✔**
- **Image 7 (2H Chart - Trade Levels):** Shows detailed trade management with entry at 6,715, stop at 6,688 (34.96 points, 0.52%), and targets. Risk/Reward ratio of 6.04 is marked. Long TP and Short EN zones are marked showing institutional trade clusters. **Significance:** Demonstrates proper risk management with tight stop below key support and excellent R/R ratio. The 0.52% stop is appropriate for this setup. **AGREES ✔**
- **Image 8 (3H Chart - Pattern Context):** Shows an Ascending Triangle pattern on the 3H timeframe with targets at 6,799.19 (T1) and 6,967.1 (T2). Entry marked at 6,715.23, stop at 6,631.28. Pattern is 18 periods old and still valid. **Significance:** Adds a bullish continuation pattern context on higher timeframe. The ascending triangle supports the bullish thesis and provides additional upside targets that align with channel resistance. **AGREES ✔**
Actionable Machine Summary:
All eight chart images present a unified, coherent bullish case with zero contradictions. The setup quality is exceptional: 1) You have a confluence zone (6,710) where five distinct technical factors converge - pitchfork median, VWAP standard deviation, Fibonacci golden zone, developing POC, and oversold indicators. 2) Momentum divergences on three separate indicators (RSI, MFI, CVD) confirm selling exhaustion at this exact level. 3) Higher timeframe structure (2H and 3H) confirms we're in a strong uptrend with an ascending triangle pattern projecting targets to 6,800-6,967. 4) Risk management is proper with a tight 0.52% stop (6,688) below all key support structures. 5) The R/R ratio of 6:1 is excellent, meaning you only need this trade to work 1 out of 6 times to be profitable long-term. For execution: Entry 6,715, Stop 6,688, Target 1: 6,799, Target 2: 6,850-6,967. The setup has already triggered (you're at point 4), and the bullish candle closing above the developing POC suggests the reversal is confirming. This is a textbook high-probability mean-reversion long in a trending market. 🎯
Conclusion:
**Trade Prediction:** SUCCESS ✅
**Confidence:** High
**Key Reasons for Success:**
1. **Fed Tailwinds Are Massive:** With 98% probability of rate cut on Oct 29 and 87% for December, monetary policy is your friend. Lower rates = higher stock prices. This macro backdrop creates a bullish bias that makes buying dips in uptrends a high-probability strategy.
2. **Multiple Technical Confluences Align Perfectly:** It's rare to get this many factors agreeing at one price level - pitchfork median, VWAP, Fibonacci golden zone, POC, oversold oscillators, and triple divergences all at 6,710. This creates a high-conviction zone.
3. **Uptrend Structure Intact:** The ascending channel from May 23 is well-defined with clear targets at 6,800-6,850. You're buying a pullback within this structure, not fighting the trend. The 2H and 3H charts confirm trend strength.
4. **Failed Breakdown Below VWAP:** Price pierced below 1st standard deviation VWAP but couldn't close there - this is a bear trap. Failed breakdowns often lead to explosive reversals as shorts cover and bulls regain control.
5. **Excellent Risk/Reward:** With a stop at 6,688 and targets at 6,799-6,850, you're risking ~0.52% to make 1.2%-2.0%. That's a 2.3:1 to 3.8:1 R/R ratio on the conservative side, and your chart shows 6:1 if the full move plays out.
**Key Risks to Monitor:**
1. **Overbought on Higher Timeframes:** While the pullback created oversold conditions on 1H-3H, the daily and weekly charts show RSI >70. This means the market could enter a consolidation or deeper correction. If 6,688 breaks, next support is 6,650-6,660.
2. **Breadth Divergences Noted by Analysts:** Some market analysts point out that only Nvidia and Microsoft are above 2024 highs among Mag-7 stocks. This suggests the rally may be narrowing, which can precede corrections.
3. **Euphoric Sentiment:** Several analysts warn that sentiment has shifted from fear to euphoria. When everyone is bullish, it can create crowded positioning that reverses sharply. However, this is more of a medium-term risk than a short-term factor.
4. **Stop Below 6,690 Critical:** Your key support at 6,690 is the line in the sand. A clean break below on volume would invalidate the setup and could lead to 6,650 or even 6,600. Respect your stop.
5. **October Seasonality:** While the Rosh Hashanah to Yom Kippur weakness period just passed (Sept 22-Oct 2), October can still be volatile. However, historical data shows October-January are typically strong months for equities.
**Risk/Reward Assessment:**
The R/R strongly justifies this trade. Risking 0.52% (to 6,688) to make 1.2%-2.0% (to 6,800-6,850) is textbook asymmetry. Even if this setup only has a 50% win rate, the R/R makes it profitable over time. But given the confluence of factors, I'd estimate 65-70% probability of reaching at least 6,799 in the next 5-10 trading days.
**Final Recommendation:** TAKE THE TRADE 🚀
**Execution Plan:**
- **Entry:** 6,715 (you're already in based on chart 7) ✅
- **Stop Loss:** 6,688 (below all key support structures)
- **Target 1:** 6,799 (T1 from ascending triangle) - Take 50% profit here
- **Target 2:** 6,850 (upper channel boundary) - Let the rest ride with trailing stop
- **Time Horizon:** 5-10 trading days expected for T1, potentially 2-3 weeks for T2
**Risk Management:**
With a 0.52% stop, this is a well-sized trade. If using 1% account risk per trade, this translates to approximately 2x normal position size given the tight stop. The excellent R/R ratio supports slightly larger position sizing, but never exceed 2% account risk on any single trade.
The setup is firing on all cylinders: technical, fundamental (Fed policy), and sentiment (buying fear in an uptrend). The market just gave you a gift by pulling back to this confluence zone. Don't overthink it - execute the plan, respect the stop, and let probability work in your favor. Bulls have all the ammo they need to push this back to 6,800+. 🎯💪
Good luck and trade safe! 🚀
Fundamental Analysis S&P500 NEOWavehere’s a short economic analysis of the U.S. economy in English:
🇺🇸 U.S. Economic Analysis (2025)
The U.S. economy remains resilient in 2025, supported by strong consumer spending, a stable labor market, and easing inflation. GDP growth is expected to hover around 1.8–2.0%, indicating moderate expansion after a period of tight monetary policy.
The Federal Reserve has begun gradual rate cuts, aiming to sustain growth while keeping inflation near its 2% target. Corporate earnings are steady, but high valuations and policy uncertainty present risks.
Overall, the outlook is cautiously optimistic, with solid fundamentals but potential headwinds from global trade tensions and fiscal pressures.

Banks and Markets: Their Role in the Global EconomyIntroduction
In the vast and interconnected global economy, banks and financial markets play a fundamental role in ensuring stability, efficiency, and growth. They act as the twin pillars of the financial system—facilitating the flow of funds, supporting investments, managing risks, and promoting economic development. While banks serve as intermediaries between savers and borrowers, financial markets function as platforms for direct transactions between investors and issuers. Together, they form a dynamic ecosystem that influences everything from corporate financing and consumer spending to global trade and government policies.
Understanding the roles of banks and markets in the global context is crucial to grasping how modern economies function. Their interdependence shapes global capital flows, influences exchange rates, determines interest rates, and affects the pace of industrial and technological innovation.
1. The Role of Banks in the Global Market
Banks have evolved from simple money lenders and safekeepers to complex financial institutions that manage vast networks of credit, liquidity, and payment systems. Their global influence extends beyond national borders, affecting trade, investment, and financial stability.
1.1. Financial Intermediation
At their core, banks serve as financial intermediaries—linking those who have surplus funds (depositors) with those who need funds (borrowers). This intermediation ensures efficient allocation of capital. In the global market, this means channeling savings from developed economies (like the U.S., Japan, and Europe) into investment opportunities in emerging economies (like India, Brazil, or Indonesia).
By evaluating creditworthiness, managing risks, and offering tailored lending solutions, banks ensure that capital is allocated to productive uses. This process underpins economic growth and job creation worldwide.
1.2. Facilitating International Trade
International trade would not function smoothly without banks. Through mechanisms such as letters of credit, trade finance, and foreign exchange services, banks help importers and exporters conduct cross-border transactions securely.
For instance, a bank in India may guarantee payment to a supplier in Germany once the goods are shipped—reducing risk for both parties. Large multinational banks like HSBC, JPMorgan Chase, and Citibank have become key enablers of global trade, ensuring liquidity and trust between distant markets.
1.3. Supporting Monetary Policy and Financial Stability
Central banks—such as the Federal Reserve (U.S.), European Central Bank (ECB), and Reserve Bank of India (RBI)—play a special role in controlling the money supply, setting interest rates, and ensuring financial stability. Their decisions ripple through the entire global financial system.
For example, when the U.S. Federal Reserve raises interest rates, capital often flows out of emerging markets as investors seek higher returns in the U.S. This can cause currency depreciation and inflationary pressures in developing countries, illustrating how global banking policies interlink economies.
1.4. Managing Currency and Exchange Risks
With globalization, businesses deal in multiple currencies. Banks help manage foreign exchange risk by providing hedging tools like forward contracts, options, and swaps. Global banks act as major players in the forex market, providing liquidity and enabling international investors to move funds across borders efficiently.
1.5. Promoting Investment and Development
Banks finance infrastructure projects, startups, and industries that drive national and global development. In emerging markets, development banks like the World Bank and Asian Development Bank (ADB) provide long-term financing for projects that may not attract private investors. These investments support sustainable growth, reduce poverty, and create employment.
2. The Role of Financial Markets in the Global Economy
Financial markets complement the role of banks by providing a platform for direct capital exchange. They allow individuals, corporations, and governments to raise funds, trade assets, and manage financial risks efficiently.
2.1. Types of Financial Markets
The global financial system is composed of several interrelated markets:
Capital Markets: Where long-term securities like stocks and bonds are traded.
Money Markets: Where short-term debt instruments like treasury bills and commercial paper are exchanged.
Foreign Exchange (Forex) Markets: Where currencies are traded.
Derivatives Markets: Where futures, options, and swaps are used for speculation and hedging.
Commodity Markets: Where physical goods like oil, gold, and agricultural products are traded.
Each of these markets plays a crucial role in ensuring liquidity, price discovery, and efficient allocation of resources globally.
2.2. Facilitating Capital Formation
Financial markets help companies and governments raise funds by issuing shares or bonds to investors. For instance, when Apple issues corporate bonds, global investors—from pension funds in Canada to sovereign wealth funds in Singapore—can buy them. This mobilization of savings into investment fosters global economic development and innovation.
2.3. Promoting Liquidity and Price Discovery
Markets provide liquidity by allowing investors to easily buy or sell assets. The constant trading activity ensures that securities are fairly priced based on supply and demand. This price discovery function reflects real-time market sentiment about a company’s or economy’s health.
For example, if investors believe an economy is slowing down, stock indices fall—signaling caution to policymakers and businesses alike.
2.4. Risk Management through Derivatives
Derivatives markets allow investors to hedge against various financial risks, such as interest rate fluctuations, currency volatility, or commodity price changes. Airlines, for example, use futures contracts to lock in fuel prices, while exporters hedge against currency depreciation.
This risk transfer mechanism enhances global financial stability by distributing risks among willing participants.
2.5. Encouraging Global Integration
Financial markets link economies through cross-border investments. Institutional investors diversify portfolios by buying foreign securities, while multinational corporations issue bonds in multiple currencies. This integration deepens capital mobility, allowing funds to flow to regions offering the best returns.
However, it also means that shocks in one market—like the 2008 U.S. subprime crisis—can quickly spread globally, underscoring the interconnectedness of financial systems.
3. The Interdependence of Banks and Financial Markets
Banks and markets do not function in isolation. They are deeply interconnected, with each relying on the other for liquidity, pricing, and credit signals.
3.1. Banks as Market Participants
Banks actively participate in financial markets as investors, market makers, and risk managers. They trade government securities, manage portfolios of equities and bonds, and offer structured products to clients. Their trading activities help maintain market liquidity and stability.
3.2. Markets as Funding Sources for Banks
Banks themselves raise funds through capital markets by issuing bonds or equity. This diversification of funding sources strengthens their balance sheets and reduces dependence on deposits.
3.3. Transmission of Monetary Policy
Financial markets amplify the effects of central bank policies. When interest rates change, bond prices, equity valuations, and currency exchange rates adjust accordingly—affecting investment, consumption, and global trade patterns.
4. The Globalization of Banking and Markets
The 21st century has seen unprecedented global financial integration. Capital now flows across borders instantly, and financial institutions operate globally with advanced technology and regulation.
4.1. Cross-Border Banking
Large banks maintain operations in multiple countries, offering services from investment banking to retail lending. This enables efficient cross-border financing, supports global trade, and enhances capital mobility. However, it also introduces systemic risks when crises spread through global networks.
4.2. Technology and Fintech Revolution
Digital transformation has reshaped global banking and markets. Fintech companies, online trading platforms, blockchain, and cryptocurrencies have democratized access to financial services. Individuals can now trade global assets or transfer money across borders instantly.
This digitization of finance enhances efficiency but also challenges regulatory frameworks and traditional banking structures.
4.3. The Rise of Global Capital Flows
Global capital flows—foreign direct investment (FDI), portfolio investments, and remittances—have become key drivers of global economic activity. Financial markets serve as the main channels for these flows, helping countries finance deficits, build infrastructure, and stabilize currencies.
5. Challenges Faced by Banks and Markets in the Global Context
Despite their importance, both banks and markets face several risks and challenges that can threaten global stability.
5.1. Financial Crises and Systemic Risk
Events like the 2008 Global Financial Crisis and the 2020 COVID-19 market crash exposed vulnerabilities in both banking and market systems. Excessive leverage, poor risk management, and inadequate regulation can lead to contagion effects that spread across countries and sectors.
5.2. Regulatory Complexity
The global financial system is governed by a web of regulations—Basel norms for banks, securities laws, and anti-money-laundering frameworks. Ensuring compliance across jurisdictions is complex, particularly for multinational institutions.
5.3. Technological and Cybersecurity Risks
As banks and markets digitize, cyber threats pose significant risks. Data breaches, fraud, and hacking incidents can undermine trust and disrupt financial systems globally.
5.4. Inequality and Market Concentration
While financial globalization has boosted wealth creation, it has also widened income inequalities. Large financial institutions and investors often benefit disproportionately, while smaller participants struggle to compete.
5.5. Climate Change and Sustainable Finance
Modern banking and markets are under pressure to support sustainable finance—channeling capital into green and ethical investments. Institutions are now integrating Environmental, Social, and Governance (ESG) criteria into lending and investment decisions to ensure long-term sustainability.
6. The Future of Global Banking and Financial Markets
As the world moves deeper into the digital and data-driven era, the structure and role of banks and markets are evolving rapidly.
6.1. Digital Banking and Decentralized Finance (DeFi)
Traditional banking is being transformed by digital banks, blockchain, and DeFi platforms. These technologies remove intermediaries, reduce costs, and increase transparency—potentially reshaping how global capital moves.
6.2. Artificial Intelligence and Automation
AI-driven analytics, robo-advisors, and algorithmic trading are revolutionizing decision-making in both banking and markets. They enable faster, data-backed investment strategies and risk assessments, though they also introduce new systemic risks.
6.3. Central Bank Digital Currencies (CBDCs)
Many central banks are exploring CBDCs to modernize payment systems and enhance financial inclusion. Digital currencies could make cross-border transactions faster and cheaper while maintaining state oversight.
6.4. Global Cooperation and Regulation
Future financial stability will depend on international regulatory coordination. Organizations like the IMF, World Bank, and Financial Stability Board (FSB) will continue to play key roles in guiding policy frameworks and crisis management.
Conclusion
Banks and financial markets are the lifeblood of the global economy. They connect savers with borrowers, enable trade, manage risks, and drive innovation. Together, they form a complex yet indispensable system that powers growth, investment, and prosperity across nations.
However, their increasing globalization, technological transformation, and systemic interdependence also make them vulnerable to shocks and crises. The challenge for policymakers, investors, and institutions is to balance efficiency with stability, innovation with regulation, and profit with sustainability.
In the future, as the global economy becomes more digital, inclusive, and sustainable, the partnership between banks and markets will remain the cornerstone of economic progress—shaping how nations develop, businesses grow, and individuals achieve financial well-being in an interconnected world.

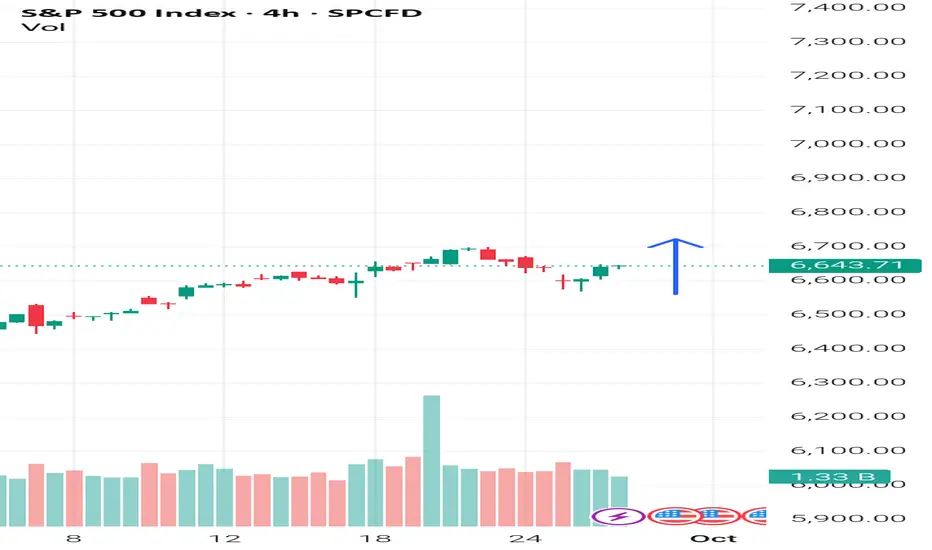
S&P 500 INDEX📈 S&P 500 – Heading to 7,100: Bullish Momentum Intact
The S&P 500 index is currently trading at 6,715, and the technical picture continues to favor buyers. The market structure shows higher lows and higher highs, reinforcing the likelihood of a bullish continuation toward the 7,100 region.
🔍 Key Analysis Points:
Main trend clearly bullish.
Orderly pullbacks well defended by buyers.
Current momentum shows no signs of significant exhaustion.

Bullish V Pattern In SPX/USDFellow Traders and followers, we have a bullish V pattern in SPX on the 4hr chart.
Everyone is bearish I'm sure, based on the rumor of a government shutdown, however the 4hr chart is showing a bullish V pattern . Huh!
Here are the numbers to watch ; Break out area is 6693.4. A hourly and 4hourly close above marks a confirmation of the pattern.
Target is at 6741.3 area.
If for any reason price breaks down below 6613 area bears would flood in and change the tide direction.
Best of luck in all your trades $$$

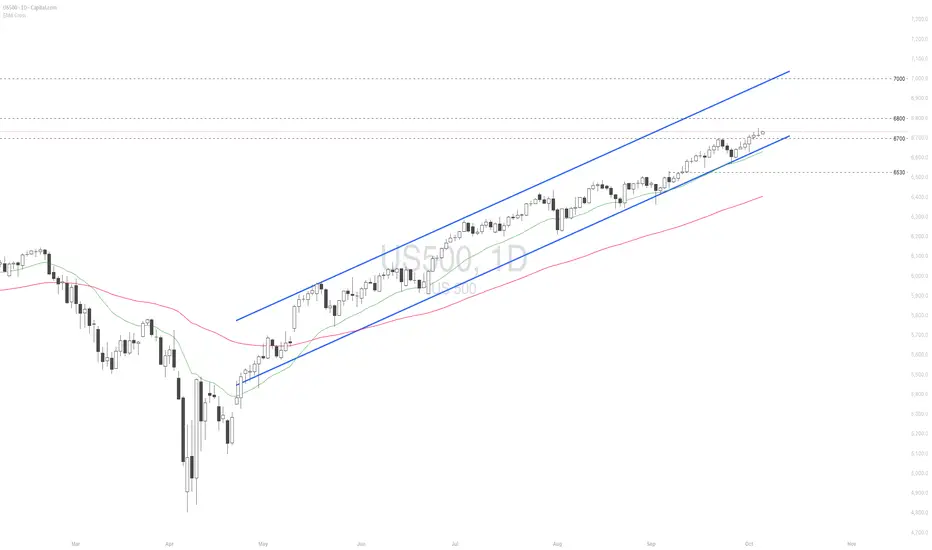
S&P 500 Future Outlook: Targeting 7,000 by 2026Overview Summary
The TVC:SPX has staged an impressive recovery throughout 2025, breaking free from the spring correction and climbing within a well-defined rising channel. Many anticipated September to be a bearish month based on historical trends, but momentum is continuously being fueled by resilient earnings, AI-driven productivity themes, and renewed capital inflows. With price currently consolidating around the mid-6,600s, our outlook anticipates a continuation of this structural uptrend toward the psychological 7,000 level, aligning with both technical momentum and macro capital drivers.
Technical Analysis
The index is trending within a clear ascending channel, respecting both upper and lower boundaries since Q2. Each pullback has found consistent demand along channel support, followed by strong recoveries. As shown in our TradingView chart analysis, projected channel extension carries SPX toward 6,900–7,000 by year end.
Key Support Entry: 6,500-6,600
Key Resistance Target: 6,900–7,000
A clean break and close below 6,300 would invalidate near-term bullish structure and open risk toward deeper supports near 6,000.
Macro/Fundamental Thesis
Macro conditions remain a dual force. On one hand, AI investment, corporate buybacks, and strong tech leadership ( NASDAQ:NVDA , NASDAQ:AMD , NASDAQ:SMCI , NYSE:ANET ) are powering higher valuations. On the other, elevated rates, energy costs, and global growth uncertainty remain constraints. Capital rotation into equities continues as investors seek exposure to U.S. resilience and innovation themes.
Overall, the index remains supported by structural liquidity and the digital infrastructure super cycle. A decisive test of $7,000 is our base case as long as buyers continue defending channel support zones.
Green Zone Capital
Bias: Long
Type: Trend Continuation
Entry Zone: 6,500–6,600 (pullback buys)
Target: 7,000+ (psychological milestone + channel projection)
Invalidation: Break below 6,300 (channel support)
Conclusion
The TVC:SPX continues to trade within a constructive uptrend, supported by both technical structure and macro demand for U.S. equities. As long as buyers defend the mid-6,300 support area, the broader market remains positioned for continuation toward the 7,000 milestone. This level represents not only a psychological benchmark but also the upper boundary of the current channel extension. While volatility and pullbacks should be expected, the prevailing trend favors strength, and disciplined accumulation within support zones offers attractive risk-reward for long-term investors.

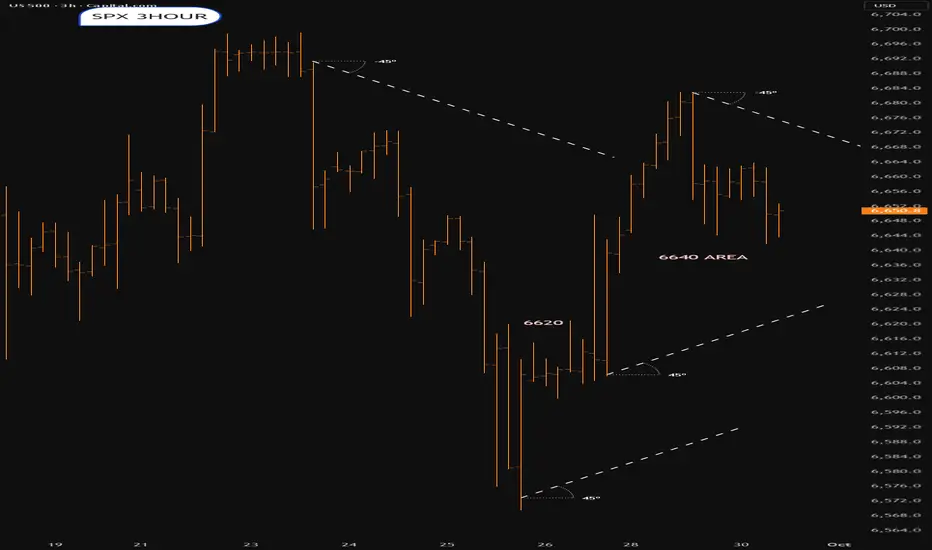
SPX into Quarter endDifficullt.Direction unclear.Some sort of festering around 6620-6640 area.Lets see
September 29 - October 3 Market AnalysisHello everyone - it has been a while since I have posted an Idea. I tried to come up with a template for recurring posts earlier in the year that just became too time-consuming so I decided to wait until I worked out something different.
Lately, I have been moving away from purely focusing on technical analysis and more towards building a framework that helps me assess the overall market structure to set my bias before then looking to technicals and other indicators to find trade entries. My current approach utilizes three dashboards for market structure, which I call Macro, FX, & Risk. From there, I have a specific layout on Futures that helps me track order flow and momentum. When I feel like I have a good read on the market and am ready to make a trade, I then look at the 0DTE options chain and AMEX:SPY intraday chart to determine support/resistance and good entry points.
I’m still working on improving using this style of trading, but will try to journal my bias on a weekly basis from here forward if possible, which can help me determine areas where I am succeeding and others that could use improvement. For today, I will try to briefly run through each of my layouts with brief notes about how I am perceiving the market’s activity in context. I’ll look at this on a shorter scale in the future, but for now I am going to look at roughly the last 12 months, going back to October 2024.
Layout 1: Macro
On this layout, the goal is to gauge the overall market backdrop. Here, we can see that TVC:DXY declined until July where it began to flatten. It’s still moving down slightly on average but the slope is not as steep, however I would not yet call this a bottom as the current candlestick setup makes me think more downside is still a possibility.
The next two panes show a comparison of
• TVC:US03MY (risk-free short term yield); black
• TVC:US10Y (risk-free short term yield); white
• FRED:DFII10 (10Y real yield: US10Y minus inflation expectations from TIPS); blue
indexed to 100 and the “Inflation Gauge” which is the difference between the average nominal US bond yield ((US10Y+US03MY)/2) minus the 10Y Real Yield, which provides a rough estimate of inflation expectations. Here we can see that nominal and real yields have been on the decline since June. In the first part of this phase, the inflation gauge was rising, suggesting true risk-on behavior. Fed policy remained unchanged while there was a modest rise in inflation expectations, yet investors did not pile into gold, so equities were the preferred risk asset during this period, especially since the dollar remained flat as previously mentioned.
On the righthand side, inflationary commodities (namely Oil NYMEX:CL1! and Corn CBOT:ZC1! ) have mostly been suppressed during this calendar year, however Oil has remained in a flat range since June and Corn has been on the rise since the middle of August. Copper COPPER1! , which is more of a signal of industrial demand, has been on a steady rise since markets bottomed in April 2025 and may even be accelerating.
Since inflation expectations have been falling, the rise in Copper and Corn may be more of a demand signal, however if something causes Oil or the other two commodities to surge too quickly, these could turn into inflation drivers.
For now, the picture I’m seeing here is that the market’s risk-on appetite may be waning, in favor of safer bets like US Treasuries and Gold, even when inflation expectations are taken into account. Commodities and the Inflation Gauge will be important to keep watching, as correlation to the upside could quickly change the economic backdrop.
Layout 2: FX
Here, I am seeing that US nominal yields remain higher than most other major countries (Germany and Italy are both Blue to match EXY and are the solid and dotted lines, respectively) while the Dollar has seen a steep decline compared to other currency baskets over the same period. The message this sends to me is that investors are demanding a higher return on US debt while betting that monetary policy will ease, growth will slow, or both.
Layout 3: Risk
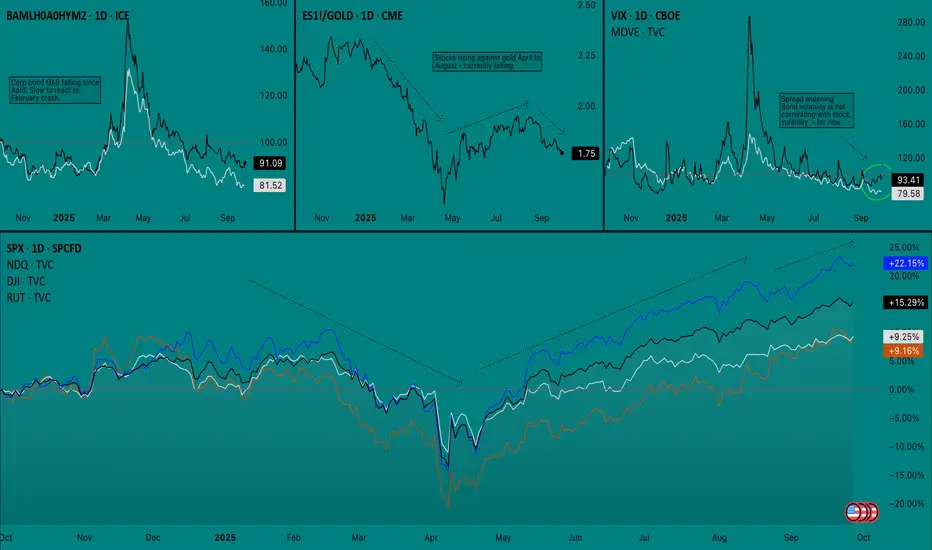
On this layout I am keeping track of the following
Top Left: Option adjusted spread (OAS) of corporate High Yield bonds/Investment Grade bonds
Top Middle: S&P 500 Futures/Gold spread
Top Right: TVC:VIX and TVC:MOVE overlay
Bottom: Stock index comparison (SPX, NDQ, DJI, RUT)
I should have mentioned earlier that I’m trying to keep the start/end of the arrows on all of the charts aligned. The takeaway here is that the last time we saw CME_MINI:ES1! sharply fall against TVC:GOLD , it provided an early signal for an equity sell off. The sell off Feb-April was a true risk-off event since both High Yield and Investment Grade bond yields surged and there was a simultaneous spike on VIX and MOVE. So far in September, we have seen stock volatility while bond volatility has remained flat. While VIX and MOVE were not leading indicators before, at the very least this indicates that equities are not yet ready to sell off.
Still, I cannot stress the point enough that Gold is very important to watch right now, especially as it relates to stocks since it can suggest that investors view it as the better risk asset, which cold lead them to dump the other (stocks) if an event makes it seem warranted.
——————————
Put simply, I think the market is saying the following:
1. More rate cuts are expected
2. Slower growth may be the bigger fear than inflation (at the moment)
3. Inflation worries are still present, yet diminished
4. Hedging with safe assets (bonds, gold) may be more attractive than stocks
5. Recent stock declines do not have risk-off confirmation
Next, I will take a look at my Bias chart, which right now mostly covers September thus far.
Layout 4: Bias
There’s a few things going on here that not everyone may be familiar with, so I’ll break it down pane-by-pane, as I have found this layout for Futures CME_MINI:ES1! to be very effective
Top Left: 50R chart with indicators only. CVD Daily (blue), CVD Weekly (black), Fisher Transform (y-axis log scale), Anchored OBV (daily)
Bottom Left: ES1! Line Break (3 lines, 1h)
Center: ES1! Renko (ATR, 15m)
Right: VIX (1h)
I’m using a 50R chart on the top left pane to filter time-based noise and to provide more data to be calculated into each bar on the CVD indicator, which gives more conviction to each move. CVD is the most important indicator here and I have found that comparing Daily and Weekly CVD becomes more effective as the week progresses and often shows hidden order-flow divergences.
Line Break creates a new line when the price closes in the same direction of the trend. Reversals only occur when the price crosses above or below three lines in the opposite direction. Successions of small boxes (like we see here) are easy to reverse than several long boxes in a row.
Renko is similar to line break but it is filtered by ATR and new boxes only have to clear the filter before a reversal prints.
On this layout, we can see that there was a battle last week on the order flow but buyers ended up finishing on top. Volatility was climbing for six sessions straight but ended up getting dumped on Friday (9/26). Futures are currently climbing back towards ATH on Sunday night, however the print on the Line Break chart has me cautious about if this will be quickly reversed. I’d like to see at least one long bar print heading into Monday if I’m going to go long, as Line Break must be aligned with whichever direction I trade in.
——————————
Conclusion: I’m approaching this week with a good deal of caution. While I do not think that we will see a true risk-off event until the market approaches a point where policy tightening is getting priced in (i.e. Fed is too dovish and accelerates inflation, leading to a quick policy reversal). Still, the market’s defensive positioning and relative waning of interest in stocks cannot be ignored. With Q4 being traditionally strong, the market may sell into the weakness in order to reposition for a bullish end of the year, even if the broader outlook is starting to signal trouble ahead.
I’m not confident about trading either side on Monday, so it could be a volatility rebalancing day. What I will watch for, however, is VIX finding support and whether or not Futures reach new ATHs before pulling back. ATH before a pullback would be the best bullish scenario, while a failure to make new highs could lead to a flat distribution or re-accumulation range. In which case, order flow and daily options positioning will be important to watch.
If this becomes a weekly thing I will definitely not be explaining all of my charts and indicators each time, and will opt to keep it brief but wanted to at least explain it all once in case anyone ends up following along. Let me know if you have any questions or suggestions on how I can sharpen my analysis. Thank you for reading - AP.
US500 Long Idea: Bullish Retest of Flipped Support LevelHello TradingView Community,
This post outlines a potential long trade setup on the USA S&P 500 Index (US500) based on the 15-minute chart.
Technical Analysis:
The index is currently in a clear uptrend, showing consistent higher highs and higher lows. We can identify a key horizontal price level at approximately 6,571.95. This level acted as a significant resistance point in the past, where the price struggled to break through.
Recently, we have seen a decisive breakout above this resistance, which is a strong bullish signal. The trading idea is based on the "resistance-turned-support" principle. We are anticipating a pullback to this broken level, which is now expected to act as a new support floor. A bounce from this area would confirm the continuation of the bullish trend.
Trade Setup:
The long position tool on the chart visualizes a specific plan for this bullish scenario:
Entry: Approximately 6,571.95 (at the retest of the new support).
Stop Loss: 6,531.55 (placed below the support structure to protect against a failed retest).
Take Profit: 6,689.67 (targeting a new higher high in the current trend).
This setup provides a structured approach with a clear risk-to-reward ratio for a potential move higher.
Disclaimer: This analysis is for educational and discussion purposes only and should not be considered as financial advice. Trading indices and other financial instruments involves significant risk. Please conduct your own research and manage your risk accordingly.

As ES broke previous resistance, I’m buying to next last highbroke previous resistance, I’m buying to next last high

Forex weekly review: fundamental analysis.Contrary to many predictions (mine included), the USD maintained its strength throughout the week starting Monday 22 September.
The USD has been on the front foot since the FOMC meeting. Even though rate cuts are coming, it won't be as fast paced as the market priced in a few weeks ago. And this week the 'rate cut dial' moved again, (two cuts instead of three before year end?), thanks to a bout of positive US data (GDP and unemployment claims).
Friday's 'in line with concenciuos' PCE data didn't give any clues as to what next week will bring, trading is a lot more straightforward when data releases are 'outside of concenciuos'.
All things considered, inflation is falling (albeit slowly), company earnings remain upbeat, 'softening data' isn't softening too rapidly. Barring geopolitical concerns or fresh tariff woes, the 'soft landing narrative' remains. And I'll behind the new week with a 'tentative risk on bias'.
My preference for a 'risk on' trade is AUD or GBP long vs JPY. But I am prepared to trade whichever currency has the momentum at the time Vs the JPY. And it is still up in the air as to whether the USD could be the long part or the short part of a 'risk on'' trade.
Failing a risk on trade. It does seem the currencies are at times behaving according to 'interest rate speculation' the NZD in particular is having periods of weakness (dovish RNBZ, 0.5bp rate cut incoming?). Which opens the door to an AUD (hot CPI) NZD relative fundamental trade.
Finally, the SNB held interest rates at 0%, seemingly reluctant to revert to negative rates. The SNB's hands are tied in terms of future moves. And until inflation falls far enough to warrant another cut, the CHF could remain relatively strong.
On a personal note, I unfortunately missed the 'prime opportunities of the week'. ( Post CPI AUD long and Thursday's post US data USD long). It's easy to say with the benefit of hindsight but I would suggest both were valid opportunities in the immediate aftermath of the data release.
Instead, I had to make do with a 'speculative' AUD USD 4hr support and resistance trade, which stopped out as the USD maintained its strength.
Let's see what the new week brings.
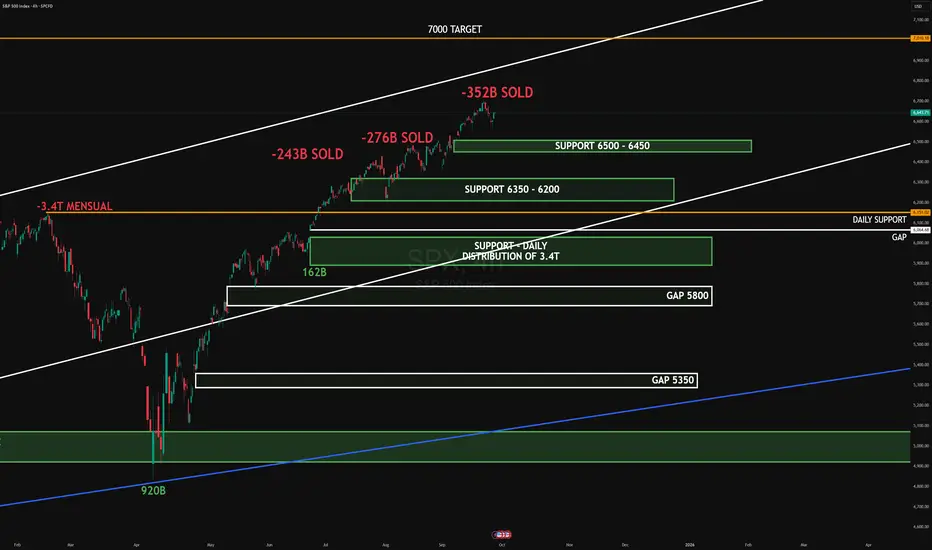
SPX SEP-OCT 2025SPX rejected at the 6600 area after heavy institutional distribution (-352B). Price is consolidating above key support zones at 6500–6450 and 6350–6200. Stronger demand sits at 6100, where the 3.4T daily absorption was previously noted. Below that, unfilled gaps remain at 5800 and 5350.
Upside target: 7000 if supports hold and momentum returns.
Downside target: 5800 gap fill if 6350 breaks.
#SPX #globaltrade #investment #investing #stockmarket #wealth #realestate #markets #economy #finance #money #forex #trading #price #business #currency #blockchain #crypto #cryptocurrency #airdrop #btc #ethereum #ico #altcoin #cryptonews #Bitcoin #ipo
US 500 trade idea1. The market is currently above both moving averages: 50 ema and 200 ema
2. H4 support zone was tested, market showed some rejections, and is bouncing off to the upside
4. RSI >50, This confirms momentum to the upside
5. Buy the market at a current price and apply proper risk management (at least 2:1 risk to reward)


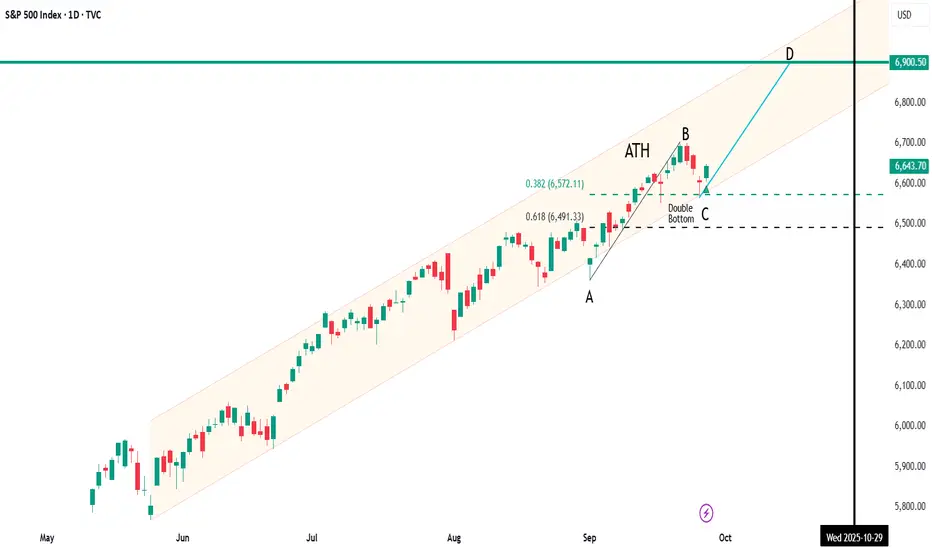
SPX Daily OutlookThe index continues to trade inside a well-defined rising channel. After setting a new ATH at point B, price retraced into a double bottom at C near the 6,600 support zone — aligning with the 0.328 retracement. The rebound from that level keeps the bullish structure intact.
⚡ Key Levels to Watch:
Support: 6,600 (double bottom / fib confluence)
Resistance: 6,670–6,700 (prior high & channel midline)
Upside target: 6,900 (channel top / point D projection)
As long as 6,600 holds, the path of least resistance favors a move toward 6,900. A decisive break below 6,600, however, would signal weakness and open the door to deeper downside.
SPX500USD could go up againHi traders,
Last week I said we could see a little more upside and a bigger correction down for (orange) wave 4 for SPX500USD. And this is exactly what happened.
So next week we could see more upside again to make a new ATH.
Let's see what the market does and react.
Trade idea: Wait for a small pullback down and a change in orderflow to bullish on a lower timeframe to trade longs.
If you want to learn more about trading FVG's & liquidity sweeps with Elliott wavecount and patterns, then please make sure to follow me.
This shared post is only my point of view on what could be the next move in this pair based on my technical analysis.
Don't be emotional, just trade your plan!
Eduwave

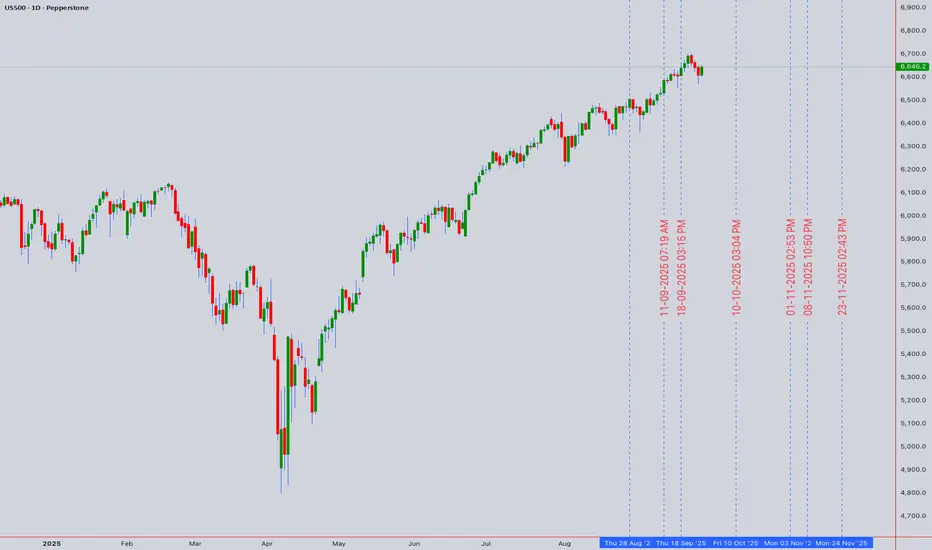
US500: 7K ASSAULT BEGINS! Mega Bull Flag Breakout 🚀 US500: 7K ASSAULT BEGINS! Mega Bull Flag Breakout 📊
Current Price: 6,646.2 | Date: Sept 27, 2025 ⏰
📈 INTRADAY TRADING SETUPS (Next 5 Days)
🎯 BULLISH SCENARIO
Entry Zone: 6,630 - 6,650 📍
Stop Loss: 6,590 🛑
Target 1: 6,720 🎯
Target 2: 6,780 🚀
🎯 BEARISH SCENARIO
Entry Zone: 6,670 - 6,690 📍
Stop Loss: 6,720 🛑
Target 1: 6,580 🎯
Target 2: 6,520 📉
🔍 TECHNICAL ANALYSIS BREAKDOWN
📊 KEY INDICATORS STATUS:
RSI (14): 61.2 ⚡ *Bullish Momentum Building*
Bollinger Bands: Coiling for Expansion 🔥
VWAP: 6,635 - Acting as Launch Pad 💪
EMA 50: 6,610 ✅ *Golden Cross Confirmed*
Volume: Institutional Accumulation 📊
🌊 WAVE ANALYSIS:
Elliott Wave: Wave 4 Triangle Complete 🌊
Target: Wave 5 Extension to 7,000+ 🎯
🔄 HARMONIC PATTERNS:
Bullish Butterfly at 6,600 Support ✨
ABCD Pattern targeting 6,780 🔄
⚖️ SWING TRADING OUTLOOK (1-4 Weeks)
🚀 BULLISH TARGETS:
Psychological: 7,000 🏆
Monthly Target: 6,850 🌙
Gann Resistance: 6,900 ⭐
📉 BEARISH INVALIDATION:
Weekly Support: 6,550 ⚠️
Critical Level: 6,480 🚨
🎭 MARKET STRUCTURE:
Trend: Ascending Triangle 💪
Momentum: Coiling Energy 🔥
Wyckoff Phase: Spring Loading 📈
Ichimoku: Bullish Cloud Break 🟢
🏆 MEGA PATTERN ALERT:
Bull Flag Pole: 6,400 → 6,700 📏
Flag Consolidation: 6,600-6,680 🚩
Breakout Target: 6,980 (300pt move!) 💥
⚡ RISK MANAGEMENT:
Max Risk per Trade: 1.5% 🛡️
R:R Ratio: Minimum 1:2.5 ⚖️
Breakout Confirmation: 6,690 close 📏
🌍 MARKET CATALYSTS:
Q3 Earnings Beating Expectations 📈
Fed Dovish Stance Supporting Risk-On 🏛️
Economic Resilience Narrative Strong 💼
🔥 KEY LEVELS TO WATCH:
Breakout Zone: 6,680-6,700 💥
Support Cluster: 6,620 | 6,580 | 6,550 🛡️
Resistance: 6,720 | 6,780 | 6,850 🚧
🎯 FINAL VERDICT:
S&P500 primed for EXPLOSIVE 7K RALLY! 🚀
Bull flag completion = 300+ point surge! 💯
Multiple timeframes align perfectly! 📈
Trade Management: Scale into dips above 6,620 💎
Breakout Alert: Watch 6,690 decisive close! 🔔
---
*⚠️ Disclaimer: High-risk trading. Use strict risk management. Educational analysis only.*
For individuals seeking to enhance their trading abilities based on the analyses provided, I recommend exploring the mentoring program offered by Shunya Trade. (Website: shunya dot trade)
I would appreciate your feedback on this analysis, as it will serve as a valuable resource for future endeavors.
Sincerely,
Shunya.Trade
Website: shunya dot trade
🔔 Follow for 7K Journey Updates | 💬 What's Your 7K Timeline?