September 29 - October 3 Market AnalysisHello everyone - it has been a while since I have posted an Idea. I tried to come up with a template for recurring posts earlier in the year that just became too time-consuming so I decided to wait until I worked out something different.
Lately, I have been moving away from purely focusing on technical analysis and more towards building a framework that helps me assess the overall market structure to set my bias before then looking to technicals and other indicators to find trade entries. My current approach utilizes three dashboards for market structure, which I call Macro, FX, & Risk. From there, I have a specific layout on Futures that helps me track order flow and momentum. When I feel like I have a good read on the market and am ready to make a trade, I then look at the 0DTE options chain and AMEX:SPY intraday chart to determine support/resistance and good entry points.
I’m still working on improving using this style of trading, but will try to journal my bias on a weekly basis from here forward if possible, which can help me determine areas where I am succeeding and others that could use improvement. For today, I will try to briefly run through each of my layouts with brief notes about how I am perceiving the market’s activity in context. I’ll look at this on a shorter scale in the future, but for now I am going to look at roughly the last 12 months, going back to October 2024.
Layout 1: Macro
On this layout, the goal is to gauge the overall market backdrop. Here, we can see that TVC:DXY declined until July where it began to flatten. It’s still moving down slightly on average but the slope is not as steep, however I would not yet call this a bottom as the current candlestick setup makes me think more downside is still a possibility.
The next two panes show a comparison of
• TVC:US03MY (risk-free short term yield); black
• TVC:US10Y (risk-free short term yield); white
• FRED:DFII10 (10Y real yield: US10Y minus inflation expectations from TIPS); blue
indexed to 100 and the “Inflation Gauge” which is the difference between the average nominal US bond yield ((US10Y+US03MY)/2) minus the 10Y Real Yield, which provides a rough estimate of inflation expectations. Here we can see that nominal and real yields have been on the decline since June. In the first part of this phase, the inflation gauge was rising, suggesting true risk-on behavior. Fed policy remained unchanged while there was a modest rise in inflation expectations, yet investors did not pile into gold, so equities were the preferred risk asset during this period, especially since the dollar remained flat as previously mentioned.
On the righthand side, inflationary commodities (namely Oil NYMEX:CL1! and Corn CBOT:ZC1! ) have mostly been suppressed during this calendar year, however Oil has remained in a flat range since June and Corn has been on the rise since the middle of August. Copper COPPER1! , which is more of a signal of industrial demand, has been on a steady rise since markets bottomed in April 2025 and may even be accelerating.
Since inflation expectations have been falling, the rise in Copper and Corn may be more of a demand signal, however if something causes Oil or the other two commodities to surge too quickly, these could turn into inflation drivers.
For now, the picture I’m seeing here is that the market’s risk-on appetite may be waning, in favor of safer bets like US Treasuries and Gold, even when inflation expectations are taken into account. Commodities and the Inflation Gauge will be important to keep watching, as correlation to the upside could quickly change the economic backdrop.
Layout 2: FX
Here, I am seeing that US nominal yields remain higher than most other major countries (Germany and Italy are both Blue to match EXY and are the solid and dotted lines, respectively) while the Dollar has seen a steep decline compared to other currency baskets over the same period. The message this sends to me is that investors are demanding a higher return on US debt while betting that monetary policy will ease, growth will slow, or both.
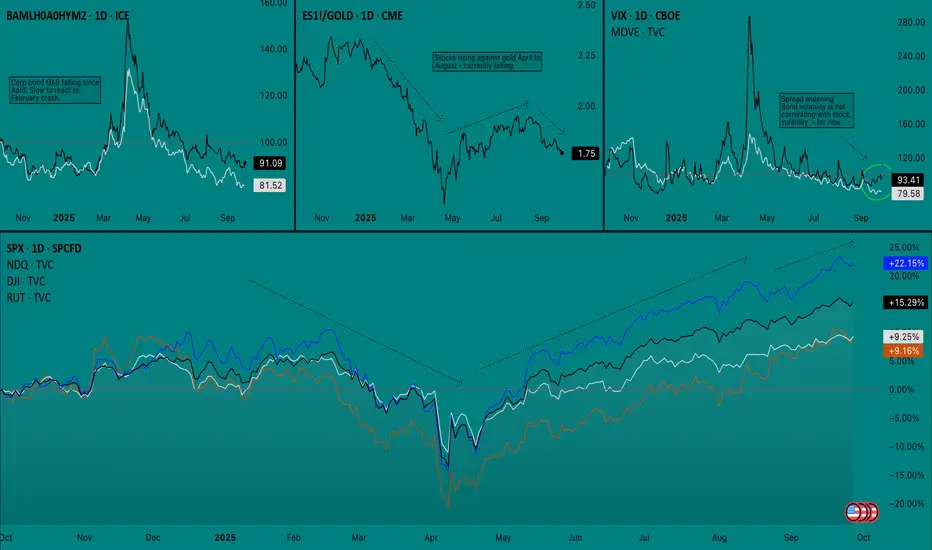
Layout 3: Risk
On this layout I am keeping track of the following
Top Left: Option adjusted spread (OAS) of corporate High Yield bonds/Investment Grade bonds
Top Middle: S&P 500 Futures/Gold spread
Top Right: TVC:VIX and TVC:MOVE overlay
Bottom: Stock index comparison (SPX, NDQ, DJI, RUT)
I should have mentioned earlier that I’m trying to keep the start/end of the arrows on all of the charts aligned. The takeaway here is that the last time we saw CME_MINI:ES1! sharply fall against TVC:GOLD , it provided an early signal for an equity sell off. The sell off Feb-April was a true risk-off event since both High Yield and Investment Grade bond yields surged and there was a simultaneous spike on VIX and MOVE. So far in September, we have seen stock volatility while bond volatility has remained flat. While VIX and MOVE were not leading indicators before, at the very least this indicates that equities are not yet ready to sell off.
Still, I cannot stress the point enough that Gold is very important to watch right now, especially as it relates to stocks since it can suggest that investors view it as the better risk asset, which cold lead them to dump the other (stocks) if an event makes it seem warranted.
——————————
Put simply, I think the market is saying the following:
1. More rate cuts are expected
2. Slower growth may be the bigger fear than inflation (at the moment)
3. Inflation worries are still present, yet diminished
4. Hedging with safe assets (bonds, gold) may be more attractive than stocks
5. Recent stock declines do not have risk-off confirmation
Next, I will take a look at my Bias chart, which right now mostly covers September thus far.
Layout 4: Bias
There’s a few things going on here that not everyone may be familiar with, so I’ll break it down pane-by-pane, as I have found this layout for Futures CME_MINI:ES1! to be very effective
Top Left: 50R chart with indicators only. CVD Daily (blue), CVD Weekly (black), Fisher Transform (y-axis log scale), Anchored OBV (daily)
Bottom Left: ES1! Line Break (3 lines, 1h)
Center: ES1! Renko (ATR, 15m)
Right: VIX (1h)
I’m using a 50R chart on the top left pane to filter time-based noise and to provide more data to be calculated into each bar on the CVD indicator, which gives more conviction to each move. CVD is the most important indicator here and I have found that comparing Daily and Weekly CVD becomes more effective as the week progresses and often shows hidden order-flow divergences.
Line Break creates a new line when the price closes in the same direction of the trend. Reversals only occur when the price crosses above or below three lines in the opposite direction. Successions of small boxes (like we see here) are easy to reverse than several long boxes in a row.
Renko is similar to line break but it is filtered by ATR and new boxes only have to clear the filter before a reversal prints.
On this layout, we can see that there was a battle last week on the order flow but buyers ended up finishing on top. Volatility was climbing for six sessions straight but ended up getting dumped on Friday (9/26). Futures are currently climbing back towards ATH on Sunday night, however the print on the Line Break chart has me cautious about if this will be quickly reversed. I’d like to see at least one long bar print heading into Monday if I’m going to go long, as Line Break must be aligned with whichever direction I trade in.
——————————
Conclusion: I’m approaching this week with a good deal of caution. While I do not think that we will see a true risk-off event until the market approaches a point where policy tightening is getting priced in (i.e. Fed is too dovish and accelerates inflation, leading to a quick policy reversal). Still, the market’s defensive positioning and relative waning of interest in stocks cannot be ignored. With Q4 being traditionally strong, the market may sell into the weakness in order to reposition for a bullish end of the year, even if the broader outlook is starting to signal trouble ahead.
I’m not confident about trading either side on Monday, so it could be a volatility rebalancing day. What I will watch for, however, is VIX finding support and whether or not Futures reach new ATHs before pulling back. ATH before a pullback would be the best bullish scenario, while a failure to make new highs could lead to a flat distribution or re-accumulation range. In which case, order flow and daily options positioning will be important to watch.
If this becomes a weekly thing I will definitely not be explaining all of my charts and indicators each time, and will opt to keep it brief but wanted to at least explain it all once in case anyone ends up following along. Let me know if you have any questions or suggestions on how I can sharpen my analysis. Thank you for reading - AP.
SPX500 trade ideas
US500 Long Idea: Bullish Retest of Flipped Support LevelHello TradingView Community,
This post outlines a potential long trade setup on the USA S&P 500 Index (US500) based on the 15-minute chart.
Technical Analysis:
The index is currently in a clear uptrend, showing consistent higher highs and higher lows. We can identify a key horizontal price level at approximately 6,571.95. This level acted as a significant resistance point in the past, where the price struggled to break through.
Recently, we have seen a decisive breakout above this resistance, which is a strong bullish signal. The trading idea is based on the "resistance-turned-support" principle. We are anticipating a pullback to this broken level, which is now expected to act as a new support floor. A bounce from this area would confirm the continuation of the bullish trend.
Trade Setup:
The long position tool on the chart visualizes a specific plan for this bullish scenario:
Entry: Approximately 6,571.95 (at the retest of the new support).
Stop Loss: 6,531.55 (placed below the support structure to protect against a failed retest).
Take Profit: 6,689.67 (targeting a new higher high in the current trend).
This setup provides a structured approach with a clear risk-to-reward ratio for a potential move higher.
Disclaimer: This analysis is for educational and discussion purposes only and should not be considered as financial advice. Trading indices and other financial instruments involves significant risk. Please conduct your own research and manage your risk accordingly.

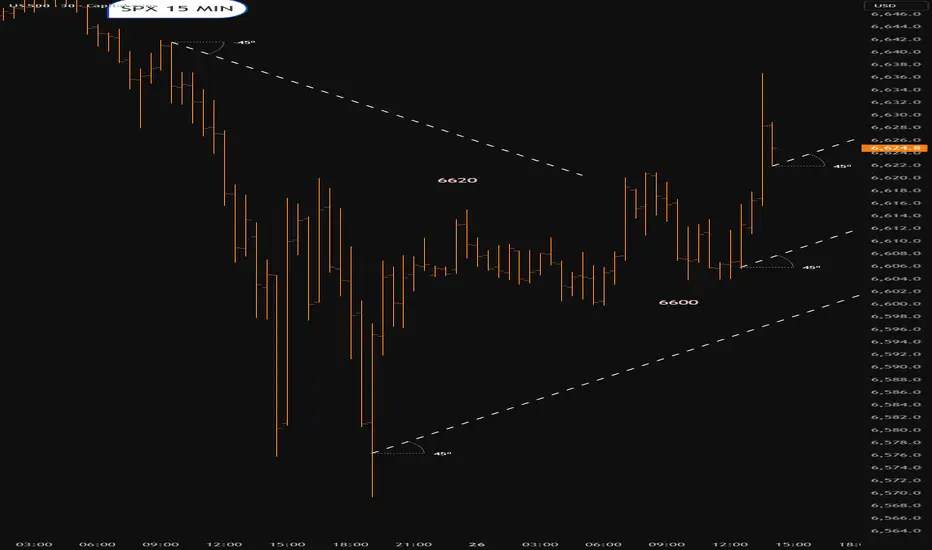
As ES broke previous resistance, I’m buying to next last highbroke previous resistance, I’m buying to next last high

Forex weekly review: fundamental analysis.Contrary to many predictions (mine included), the USD maintained its strength throughout the week starting Monday 22 September.
The USD has been on the front foot since the FOMC meeting. Even though rate cuts are coming, it won't be as fast paced as the market priced in a few weeks ago. And this week the 'rate cut dial' moved again, (two cuts instead of three before year end?), thanks to a bout of positive US data (GDP and unemployment claims).
Friday's 'in line with concenciuos' PCE data didn't give any clues as to what next week will bring, trading is a lot more straightforward when data releases are 'outside of concenciuos'.
All things considered, inflation is falling (albeit slowly), company earnings remain upbeat, 'softening data' isn't softening too rapidly. Barring geopolitical concerns or fresh tariff woes, the 'soft landing narrative' remains. And I'll behind the new week with a 'tentative risk on bias'.
My preference for a 'risk on' trade is AUD or GBP long vs JPY. But I am prepared to trade whichever currency has the momentum at the time Vs the JPY. And it is still up in the air as to whether the USD could be the long part or the short part of a 'risk on'' trade.
Failing a risk on trade. It does seem the currencies are at times behaving according to 'interest rate speculation' the NZD in particular is having periods of weakness (dovish RNBZ, 0.5bp rate cut incoming?). Which opens the door to an AUD (hot CPI) NZD relative fundamental trade.
Finally, the SNB held interest rates at 0%, seemingly reluctant to revert to negative rates. The SNB's hands are tied in terms of future moves. And until inflation falls far enough to warrant another cut, the CHF could remain relatively strong.
On a personal note, I unfortunately missed the 'prime opportunities of the week'. ( Post CPI AUD long and Thursday's post US data USD long). It's easy to say with the benefit of hindsight but I would suggest both were valid opportunities in the immediate aftermath of the data release.
Instead, I had to make do with a 'speculative' AUD USD 4hr support and resistance trade, which stopped out as the USD maintained its strength.
Let's see what the new week brings.
US 500 trade idea1. The market is currently above both moving averages: 50 ema and 200 ema
2. H4 support zone was tested, market showed some rejections, and is bouncing off to the upside
4. RSI >50, This confirms momentum to the upside
5. Buy the market at a current price and apply proper risk management (at least 2:1 risk to reward)


SP500 4H🔹 Overall Outlook and Potential Price Movements
In the charts above, we have outlined the overall outlook and possible price movement paths.
As shown, each analysis highlights a key support or resistance zone near the current market price. The market’s reaction to these zones — whether a breakout or rejection — will likely determine the next direction of the price toward the specified levels.
⚠️ Important Note:
The purpose of these trading perspectives is to identify key upcoming price levels and assess potential market reactions. The provided analyses are not trading signals in any way.
✅ Recommendation for Use:
To make effective use of these analyses, it is advised to manually draw the marked zones on your chart. Then, on the 15-minute time frame, monitor the candlestick behavior and look for valid entry triggers before making any trading decisions.

Famous Forex Traders and Their Journeys1. George Soros: The Man Who Broke the Bank of England
George Soros, born in 1930 in Budapest, Hungary, is arguably the most famous forex trader of all time. His journey from a refugee escaping Nazi-occupied Hungary to a billionaire financier is a story of resilience, intelligence, and audacious trading. Soros studied at the London School of Economics under the tutelage of philosopher Karl Popper, whose concept of “reflexivity” would later underpin much of Soros’ trading strategy.
Soros’ approach to forex trading was revolutionary. He believed markets are not always rational, and that human behavior could create trends and anomalies that could be exploited. This philosophy reached its pinnacle on September 16, 1992, known as Black Wednesday, when Soros famously “broke the Bank of England.” Anticipating that the British pound was overvalued and that the UK government would not be able to maintain its currency within the European Exchange Rate Mechanism, Soros shorted $10 billion worth of pounds. When the pound crashed, he reportedly made over $1 billion in profit in a single day.
Soros’ journey teaches traders the power of conviction and risk management. His success was not a product of luck; it was the result of meticulous analysis, understanding macroeconomic fundamentals, and having the courage to act decisively against prevailing market sentiment.
2. Stanley Druckenmiller: The Strategist Behind Soros
Stanley Druckenmiller, often described as one of the greatest traders of the 20th century, was Soros’ right-hand man during the Black Wednesday trade. Born in Pittsburgh in 1953, Druckenmiller’ journey into finance began with studying English and economics before diving into the world of investments.
Druckenmiller’ trading style emphasizes trend-following combined with macroeconomic insights. He often stresses that understanding the “big picture” — interest rates, fiscal policies, and global economic cycles — is key to successful trading. During his tenure at Quantum Fund, he achieved phenomenal returns, often averaging 30% annual returns over decades, a feat almost unheard of in any financial market.
What distinguishes Druckenmiller is his disciplined risk management. He believed in cutting losses quickly and letting winners run — a principle that resonates deeply with forex traders. His journey demonstrates that even within the high-risk world of forex, strategic planning and emotional discipline are essential.
3. Bill Lipschutz: The Currency King
Bill Lipschutz, born in 1956 in New York, is a name synonymous with currency trading. Unlike Soros or Druckenmiller, Lipschutz’ entry into trading was accidental. While studying at Cornell University, he inherited a modest sum and began trading stocks. However, after a significant loss early in his career, he realized that understanding the market psychology was as important as understanding the numbers.
Lipschutz transitioned to forex trading in the 1980s at Salomon Brothers, where he earned the nickname “The Sultan of Currencies.” His approach revolved around market sentiment and positioning, rather than purely technical or fundamental analysis. He emphasized that traders must understand not just the currency, but the forces driving central banks, governments, and large institutional players.
One of his key insights was the importance of risk perception versus actual risk. By controlling his exposure and understanding when markets overreacted, Lipschutz was able to generate consistent profits, making him one of the most respected forex traders globally. His journey illustrates that resilience after setbacks and continuous learning are vital for long-term success.
4. Andrew Krieger: The Aggressive Risk Taker
Andrew Krieger, born in 1956 in New Zealand, gained fame in the late 1980s for his aggressive and highly leveraged forex trades. Krieger worked at Bankers Trust, where he became notorious for his bold positions, particularly his massive short on the New Zealand dollar, known as the “Kiwi.”
In 1987, Krieger identified that the New Zealand dollar was overvalued relative to the U.S. dollar. Exploiting leverage far beyond the bank’s capital, he took positions worth hundreds of millions of dollars, which led to enormous profits when the currency depreciated. His ability to analyze macro trends and exploit market inefficiencies allowed him to achieve results that many considered impossible.
Krieger’s story is both inspirational and cautionary. While it demonstrates the potential of forex trading to generate huge profits, it also underscores the immense risks of leverage. Modern traders can learn from his audacity but must balance it with strict risk controls.
5. Paul Tudor Jones: The Master of Macro
Paul Tudor Jones, born in 1954 in Memphis, Tennessee, is renowned for his macro trading expertise, including currency markets. His career began after graduating from the University of Virginia, when he launched his own trading firm, Tudor Investment Corporation, in 1980.
Jones’ fame skyrocketed when he correctly predicted and profited from the 1987 stock market crash. While primarily an equity trader, Jones’ strategies often involve currencies, particularly in the context of macroeconomic shifts. His trading philosophy blends technical analysis, historical patterns, and market psychology, emphasizing flexibility and adaptability.
He is a strong advocate of risk management, famously stating, “The most important rule of trading is to play great defense, not great offense.” This principle applies directly to forex, where volatility can be extreme, and losses can compound quickly. Jones’ journey highlights the need to combine strategy with discipline to thrive in global markets.
6. Richard Dennis and the Turtle Traders
Richard Dennis, born in 1949 in Chicago, was a commodities and forex trader famous for the “Turtle Traders” experiment. Dennis believed that trading could be taught systematically and sought to prove this by training novices in his rules-based approach.
The Turtle Traders, under Dennis’ guidance, followed strict mechanical systems to trade currencies and commodities. The results were extraordinary: many of his students went on to become successful traders, demonstrating that disciplined, rules-based trading could outperform intuition alone.
Dennis’ legacy emphasizes that forex success is not only about intelligence but about discipline, rules, and psychological resilience. His journey underscores the importance of methodology and consistency in trading.
7. Kathy Lien: The Modern Forex Strategist
Kathy Lien, born in 1978 in New York, represents a modern generation of forex traders. With a PhD in international economics, Lien has leveraged her academic background to become a leading currency strategist and author.
Lien’ career spans trading at major banks such as JP Morgan and FXCM, where she honed her skills in both fundamental and technical analysis. She is renowned for translating complex market data into actionable trading strategies, particularly for retail traders.
Her philosophy focuses on risk-adjusted trading, macroeconomic insights, and disciplined execution. Lien also emphasizes the importance of continual learning and adapting to market changes — crucial in today’s fast-evolving forex landscape. Her journey inspires traders, especially women, to pursue excellence in a male-dominated field.
8. Lessons from Famous Forex Traders
Examining the journeys of these iconic traders reveals common threads that aspiring forex traders can emulate:
Risk Management is Paramount: Every successful trader prioritizes controlling losses over chasing profits.
Market Psychology Matters: Understanding human behavior in markets is as critical as analyzing charts or economic indicators.
Adaptability and Flexibility: Markets change, and strategies must evolve.
Discipline Over Intuition: Mechanical systems, rules, and structured approaches often outperform gut feelings.
Continuous Learning: Even legendary traders constantly refine their methods and knowledge.
Boldness Balanced with Strategy: High conviction trades yield high rewards, but reckless risk-taking can be catastrophic.
9. Conclusion
The journeys of famous forex traders illustrate that success in the currency markets is a blend of intellect, discipline, risk management, and psychological resilience. From Soros’ historic pound short to Lien’s modern strategies, each trader exemplifies unique paths and philosophies. Their stories serve as both inspiration and practical guidance for anyone seeking to navigate the complexities of the forex market.
Forex trading is not merely a pursuit of wealth; it is a test of strategy, patience, and mental fortitude. By studying the journeys of these iconic figures, traders can learn that success is rarely accidental — it is crafted through rigorous analysis, unwavering discipline, and a willingness to learn from every win and loss.

Currency as a Tool of Power1. Historical Roots: Currency as Sovereignty
Currency has always carried political symbolism. Ancient kingdoms used coins not only as units of trade but also as markers of authority. The image of a ruler on a coin reinforced legitimacy and sovereignty. The Roman denarius, stamped with the Emperor’s profile, became a sign of imperial unity across vast territories.
The Chinese dynasties pioneered paper currency as early as the Tang and Song periods. This innovation extended state power by standardizing economic exchange across provinces. Similarly, medieval Europe saw kingdoms fight wars not just with armies but also by debasement of coinage—reducing precious metal content to finance conflicts while eroding rivals’ trust.
Thus, from the beginning, currency was about more than economics—it was about political stability and dominance. Control over minting and distribution meant control over trade routes, taxation, and governance.
2. Currency and Empire: Financial Foundations of Power
Empires rose and fell on their ability to control currency. During the Age of Exploration, Spain and Portugal amassed silver and gold from the New World, fueling European dominance. Yet, overreliance on bullion caused inflation (the so-called “Price Revolution”) and weakened Spanish hegemony.
By contrast, the British Empire leveraged financial sophistication. London’s banking system, supported by the pound sterling, became the backbone of international trade in the 19th century. The empire’s naval dominance was matched by financial dominance: colonies used sterling, and global contracts were denominated in British currency.
This marked the evolution of a reserve currency system, where the strength of a currency allowed an empire to project influence far beyond its borders.
3. The U.S. Dollar: Modern Currency Hegemony
After World War II, the Bretton Woods Agreement (1944) established the U.S. dollar as the anchor of the global financial system. Currencies were pegged to the dollar, which itself was backed by gold at $35/ounce. Even after the U.S. abandoned the gold standard in 1971, the dollar retained its dominance due to trust in American financial markets, political stability, and military power.
The dollar became not just a currency but a global standard:
Trade Dominance: Most international commodities—oil, gas, metals—are priced in dollars (“petrodollar” system).
Financial Institutions: IMF and World Bank largely operate on dollar reserves.
Investment Flows: Global investors see U.S. Treasury bonds as the safest assets.
This dominance gave the U.S. extraordinary power: it could print currency to fund deficits, influence global liquidity, and impose sanctions by restricting dollar-based transactions.
4. Currency as Economic Weapon: Sanctions and Restrictions
Currency can be directly weaponized. In modern geopolitics, restricting access to currency flows is as potent as military intervention.
SWIFT System Control: The U.S. and EU can cut off nations from the international payment network, crippling trade.
Iran Example: When sanctions limited Iran’s access to the dollar system, its economy shrank drastically despite having vast oil reserves.
Russia (2022): Western nations froze Russia’s foreign exchange reserves and limited its ability to transact in dollars/euros, undermining financial stability.
Currency control enables “bloodless warfare”—crippling economies without direct conflict. It demonstrates how financial architecture is as much a battlefield as physical territory.
5. Currency and Global Trade Imbalances
A strong or weak currency shapes trade flows, giving nations leverage:
China’s Strategy: By managing the yuan’s exchange rate, China boosts exports while building vast dollar reserves.
U.S. Deficit Power: The U.S. can sustain trade deficits because its currency is the world’s reserve, allowing it to pay for imports with paper rather than real goods.
Currency Wars: Countries engage in competitive devaluations to make exports cheaper, leading to tensions and instability.
Thus, exchange rates are not just technical matters but instruments of industrial strategy and geopolitical rivalry.
6. Reserve Currencies and Trust as Power
For a currency to wield global power, it must be trusted. Trust depends on:
Economic Stability: Strong GDP, low inflation, predictable policies.
Financial Markets: Deep, liquid markets that allow global investors to park capital.
Military Backing: The ability to enforce international order.
The euro, launched in 1999, was designed to rival the dollar, but its influence remains limited due to political fragmentation. The Japanese yen and British pound play regional roles but lack global dominance.
China’s yuan (renminbi) is increasingly used in trade, especially with developing nations, but strict capital controls limit its reach. Still, initiatives like the Belt and Road and the creation of the Asian Infrastructure Investment Bank (AIIB) suggest Beijing’s intent to expand yuan influence.
7. Currency as Cultural and Psychological Power
Currency also carries symbolic weight. People worldwide recognize the U.S. dollar as a store of value, often hoarding it in unstable economies (e.g., Argentina, Zimbabwe). In such cases, the dollar acts as an alternative government, providing psychological stability when local systems fail.
Tourists, businesses, and migrants all rely on dominant currencies, reinforcing their prestige and soft power. A strong, trusted currency enhances national identity and global appeal.
8. Digital Currencies: The New Frontier of Power
The 21st century has introduced a new battlefield: digital and decentralized currencies.
Cryptocurrencies like Bitcoin challenge state monopoly over money. They are borderless, resistant to censorship, and appealing in nations with weak currencies. However, volatility limits their mainstream role.
Central Bank Digital Currencies (CBDCs) represent the state’s countermeasure. China’s digital yuan is the most advanced, aiming to bypass the dollar system and enhance domestic surveillance.
U.S. and EU are exploring CBDCs cautiously, aware that digital currency could reshape financial flows, privacy, and power distribution.
If widely adopted, digital currencies could redefine currency as a tool of power, shifting influence from states to either tech platforms or transnational coalitions.
9. Currency and the Future Multipolar World
The 20th century was marked by unipolar dominance of the U.S. dollar. The 21st may become more multipolar, with multiple reserve currencies coexisting: dollar, euro, yuan, and possibly digital currencies.
Key trends shaping the future:
De-dollarization: Countries like Russia, China, and Middle Eastern powers are reducing reliance on the dollar.
Commodity-Backed Trade: Proposals for oil or gold-backed trade currencies.
Regional Blocs: African and Latin American nations considering shared currencies to reduce dependency.
Technological Shifts: Blockchain, digital wallets, and cross-border payment systems eroding U.S. control.
In this scenario, currency will continue to be a battlefield for influence, independence, and survival.
10. Ethical and Social Dimensions of Currency Power
Currency dominance is not neutral—it comes with consequences:
Dependency: Developing nations tied to foreign currencies lose policy autonomy.
Inequality: Global south often pays the price of financial crises originating in the global north.
Exploitation: Control over currency systems allows powerful nations to extract value from weaker economies.
Thus, the debate around currency power is also a debate about justice, sovereignty, and fairness in global finance.
Conclusion: The Eternal Struggle for Monetary Power
Currency is more than money—it is a weapon, a shield, and a stage for power struggles. From the Roman denarius to the British pound, from the U.S. dollar to the digital yuan, nations have used currency to expand influence, enforce dominance, and reshape the world order.
In the future, battles over currency will not only determine economic prosperity but also geopolitical survival. Whoever controls the dominant currency controls the rules of global trade, investment, and even war.
The story of currency as a tool of power is not over. It is evolving—toward a world where trust, technology, and multipolar rivalry will decide whose money rules the global stage.
Pullback long - H4Trend is bullish -> looking for long setup
We had a pullback to the EMA support
Trendline has been broken
Entry: breakout candle
Stop: low of the breakout candle

S&P 500 Wave Analysis – 26 September 2025
- &P 500 index reversed from support level 6600.00
- Likely to rise to resistance level 6700.00
S&P 500 index recently reversed up from the key support level 6600.00 (which also reversed the index in the middle of September) coinciding with the 20-day moving average and the 38.2% Fibonacci correction of the upward impulse from last month.
The upward reversal from the support level 6600.00 continues the active short-term impulse wave 3 of the intermediate impulse wave (5) from the start of August.
Given the strong daily uptrend, S&P 500 index can be expected to rise further to the next resistance level 6700.00 (which reversed the price earlier this month).

Post PCE thoughts.PCE data in line with expectations, personal income and spending slightly up, all in all, when I saw the data, I felt it would potentially be good for the S&P and also the USD. But both the S&P and the USD are nonplussed.
The GBP has positive momentum, but it's not something I can hang my hat on while the rest of the currencies are behaving incoherently. All in all, i'd like to place a risk on trade, but I don't have conviction in the direction of the currencies over the next few hours.
Which means I'll close the book on a week of only trade, which stopped out. Mildly disappointing but I look forward to the new week.
Weekly Review and currency overview to follow. Wishing you a lovely weekend.
SPX .Bullish pattern/short termNeed to watch for failed signals/upside and maybe we even get a failed pattern and a dump.Lets see
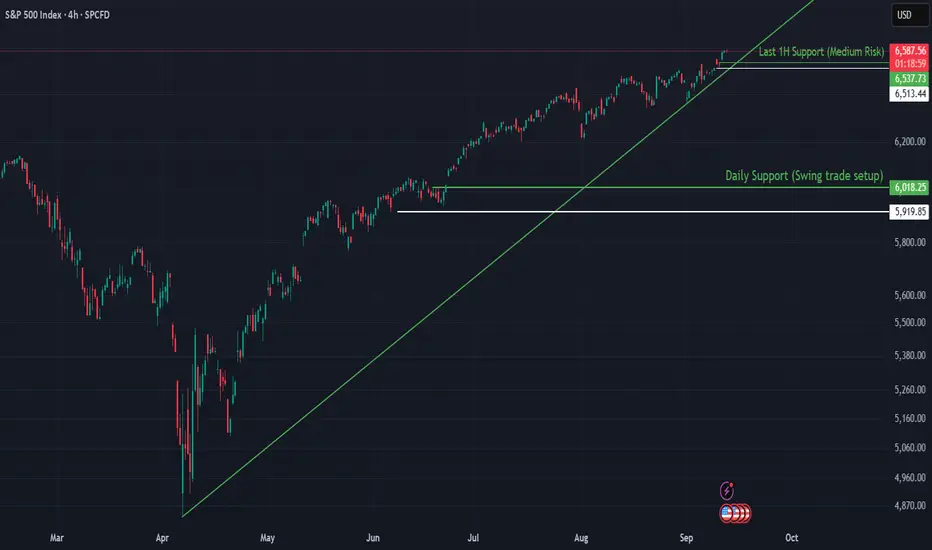
SPX Supported by Trendline and Rate Cut ExpectationsThe S&P 500 has been climbing steadily, with the ascending trendline from April acting as a reliable backbone for the move. Despite short-term volatility, buyers continue to defend higher lows. Coupled with expectations of interest rate cuts, the trend structure remains intact unless key supports give way.
🔍 Technical Analysis
Current price: 6,584
The green trendline (since April) is guiding the advance.
Price is consolidating near highs, supported by demand zones underneath.
🛡️ Support Zones & Stop-Loss (White Lines):
🟢 6,537 – 1H Support (Medium Risk)
First line of defense for short-term traders.
Stop-loss: Below 6,513
🟡 6,018 – Daily Support (Swing Trade Setup)
Stronger base for medium-term positioning.
Stop-loss: Below 5,919
🧭 Outlook
Bullish Case: Hold above 6,537 + April trendline intact → continuation toward new highs above 6,600–6,700.
Bearish Case: Break below 6,537 could trigger a correction into 6,018. Losing that zone would weaken the April trendline structure.
Bias: Bullish while April trendline holds.
🌍 Fundamental Insight
Rate cut expectations continue to provide a macro tailwind for equities. With inflation moderating and yields easing, investors remain willing to support risk assets. A sudden shift in data or Fed tone, however, could test the resilience of the April trendline.
✅ Conclusion
The S&P 500 remains in a strong bullish structure, anchored by the April trendline. Unless supports at 6,537 or 6,018 are lost, the path of least resistance remains higher.
If you found this useful, please don’t forget to like and follow for more structure-based insights.
⚠️ Disclaimer
This analysis is for educational purposes only and does not constitute financial, investment, or trading advice.
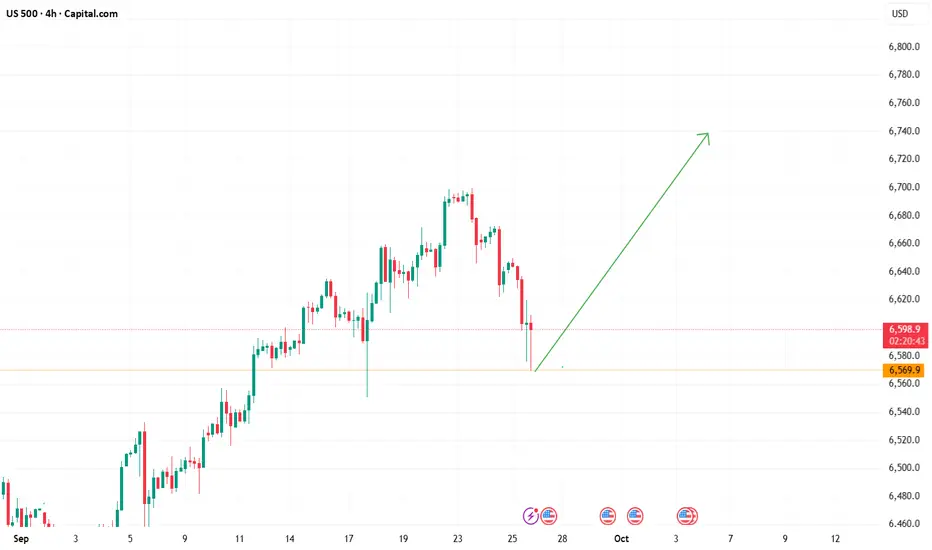
SPX into the open.Friday 26th SeptemberRecoiling after an oversold sell off.Looks like it might test that downtrend.lets see what happens
SPX frothy watersWe are currently operating firmly within the 4–5 range of several market cycles — a pattern that appears to be repeating consistently. Under such conditions, a prudent strategy is to remain mostly inactive, engaging only in limited, low-risk trades. Favor small positions, selling into strength and buying into weakness — in essence, "sell high, buy low."
Attempting to chase uptrends or buy into rallies while selling during minor corrections is likely to result in premature stop-outs, effectively eroding the gains accumulated thus far. The risk of giving back profits is elevated in this phase of the cycle.
A more significant pullback or structural correction is not expected until sometime after the first quarter of next year. Until then, restraint and precision are paramount.


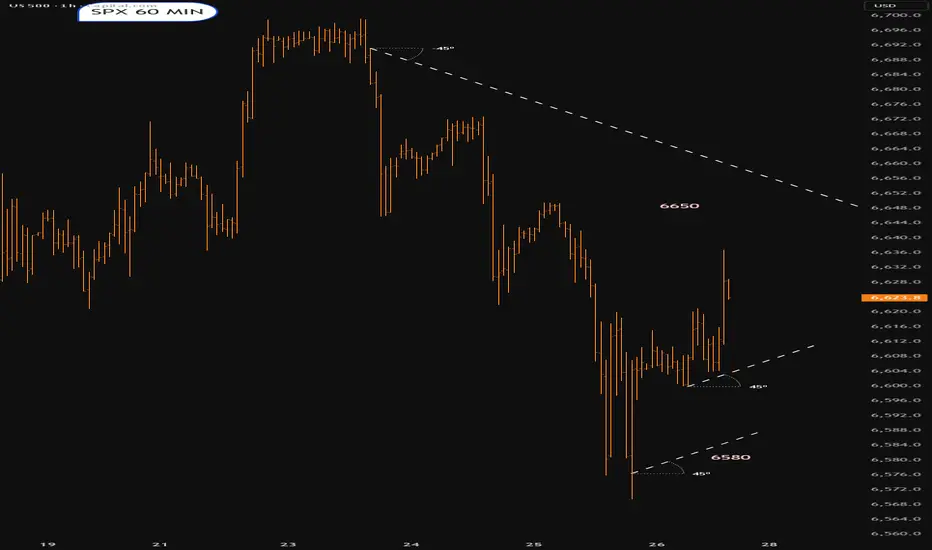
SPX .A fake above 6660A fake nove above 6660.Now back in support for a rethink.Lets see if suppport holds.?

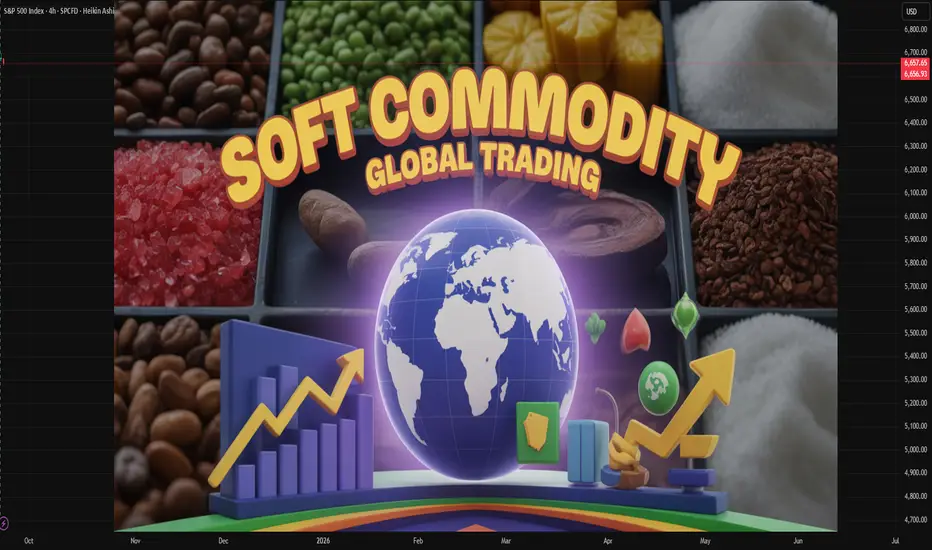
Major Global Soft Commodity Markets1. Understanding Soft Commodities
1.1 Definition and Classification
Soft commodities are raw materials that are cultivated, harvested, and traded for various purposes, including food, feed, fuel, and fiber. Unlike hard commodities such as metals and energy resources, softs are perishable and subject to seasonal cycles. They are typically traded on futures markets, allowing producers to hedge against price fluctuations and investors to speculate on price movements.
1.2 Key Characteristics
Perishability: Most soft commodities have a limited shelf life, requiring efficient storage and transportation systems.
Seasonality: Production cycles are influenced by planting and harvesting seasons, affecting supply and prices.
Geographic Concentration: Certain regions dominate the production of specific soft commodities, making them vulnerable to local disruptions.
Price Volatility: Prices can be highly volatile due to factors like weather events, pests, and geopolitical tensions.
2. Major Soft Commodities and Their Markets
2.1 Coffee
Coffee is one of the world's most traded commodities, with Brazil, Vietnam, and Colombia being the top producers. The market is influenced by factors such as climate conditions, currency fluctuations, and global demand trends. Futures contracts for coffee are traded on exchanges like ICE Futures U.S., providing a benchmark for global prices.
2.2 Cocoa
Cocoa is primarily produced in West Africa, with Ivory Coast and Ghana leading global production. The market has experienced significant price fluctuations due to supply deficits, often caused by adverse weather conditions and political instability in producing countries. The New York Cocoa Exchange, now part of ICE Futures U.S., plays a crucial role in setting global cocoa prices.
2.3 Sugar
Sugar is a staple in the global food industry, with Brazil, India, and China being major producers. The market is influenced by factors such as government policies, biofuel mandates, and global consumption patterns. Futures contracts for sugar are traded on exchanges like ICE Futures U.S., providing transparency and liquidity to the market.
2.4 Cotton
Cotton is essential for the textile industry, with China, India, and the United States being the largest producers. The market is affected by factors like weather conditions, labor costs, and global demand for textiles. Futures contracts for cotton are traded on exchanges such as ICE Futures U.S., offering a platform for price discovery and risk management.
2.5 Corn and Soybeans
Corn and soybeans are vital for food, feed, and biofuel industries. The United States is a leading producer of both crops, with significant exports to countries like China and Mexico. Futures contracts for these commodities are traded on exchanges like the CME Group, providing mechanisms for hedging and speculation.
2.6 Wheat
Wheat is a staple food for billions worldwide, with major producers including Russia, the United States, and China. The market is influenced by factors such as weather conditions, global demand, and trade policies. Futures contracts for wheat are traded on exchanges like the CME Group, offering a platform for price discovery and risk management.
3. Trading and Investment in Soft Commodities
3.1 Futures Markets
Futures markets are central to the trading of soft commodities, allowing producers to hedge against price fluctuations and investors to speculate on price movements. Exchanges like ICE Futures U.S. and the CME Group provide platforms for trading futures contracts, offering transparency and liquidity to the market.
3.2 Exchange-Traded Funds (ETFs)
ETFs provide investors with exposure to soft commodities without the need to directly trade futures contracts. For example, the Teucrium Corn Fund (CORN) and the Teucrium Soybean Fund (SOYB) offer investors a way to invest in these commodities through the stock market.
3.3 Physical Trading
Physical trading involves the buying and selling of actual commodities, often through long-term contracts between producers and consumers. Companies like ECOM Agroindustrial play a significant role in the physical trading of commodities such as coffee, cocoa, and cotton.
4. Factors Influencing Soft Commodity Markets
4.1 Weather and Climate Conditions
Adverse weather events like droughts, floods, and hurricanes can significantly impact the production of soft commodities, leading to supply shortages and price volatility.
4.2 Geopolitical Events
Political instability, trade disputes, and sanctions can disrupt supply chains and affect the prices of soft commodities.
4.3 Economic Policies
Government policies, such as subsidies, tariffs, and biofuel mandates, can influence the production and consumption of soft commodities, impacting their market dynamics.
4.4 Global Demand Trends
Changes in consumer preferences, population growth, and dietary habits can affect the demand for soft commodities, influencing their prices.
5. Challenges and Risks in Soft Commodity Markets
5.1 Price Volatility
Soft commodity markets are characterized by high price volatility due to factors like weather conditions, geopolitical events, and market speculation.
5.2 Supply Chain Disruptions
Natural disasters, transportation issues, and political instability can disrupt supply chains, leading to shortages and price increases.
5.3 Regulatory Uncertainty
Changes in government policies, such as trade restrictions and environmental regulations, can create uncertainty in the market.
6. Outlook for Soft Commodity Markets
6.1 Emerging Markets
Countries in Asia and Africa are becoming increasingly important players in the production and consumption of soft commodities, influencing global market trends.
6.2 Technological Advancements
Innovations in agricultural technology, such as precision farming and biotechnology, have the potential to improve yields and reduce the environmental impact of soft commodity production.
6.3 Sustainability Initiatives
There is a growing emphasis on sustainable practices in the production and trade of soft commodities, driven by consumer demand and regulatory pressures.
7. Conclusion
Soft commodities are integral to the global economy, influencing food security, industrial production, and trade dynamics. Their markets are complex and influenced by a myriad of factors, including weather conditions, geopolitical events, and economic policies. Understanding these markets is crucial for producers, traders, and investors alike to navigate the challenges and opportunities they present.
Will the U.S. Supreme Court strike down tariffs?In November 2025, the U.S. Supreme Court could issue a historic ruling: determining whether President Trump alone has the right to impose tariffs without going through Congress. Behind this legal debate lies a major issue for U.S. trade policy and the balance of powers.
The role of the Supreme Court
As the highest judicial authority in the country, the Supreme Court has the power to uphold or strike down any measure that does not comply with the Constitution. Its decisions are final and binding on all institutions. In this case, the Court must assess whether the President overstepped his authority by using the International Emergency Economic Powers Act (IEEPA) to impose tariffs.
Thanks to the principle of judicial review, the Court must verify whether the executive branch respects the separation of powers. For decades, presidents have invoked the IEEPA to act quickly, especially in times of economic tension. This practice, tolerated until now, is now being challenged.
A decisive choice – two possible outcomes:
• If the Court confirms presidential power, the White House will retain broad freedom to impose tariffs without immediate checks.
• If the Court limits or cancels this power, Congress will once again become the central actor in trade policy, slowing decisions but restoring institutional balance.
The issue goes beyond the legal framework. A confirmation would strengthen the executive and could encourage a more aggressive approach in international negotiations. Conversely, a restriction would force a return to legislative compromise, complicating the implementation of economic sanctions but providing greater predictability to trading partners.
A possible turning point for Fed monetary policy
This ruling could redefine U.S. trade policy for years to come. It will influence how Washington manages trade disputes, conducts international negotiations, and balances power between the President and Congress. It will also strongly impact the Fed’s future monetary policy trajectory and, more broadly, financial markets.
DISCLAIMER:
This content is intended for individuals who are familiar with financial markets and instruments and is for information purposes only. The presented idea (including market commentary, market data and observations) is not a work product of any research department of Swissquote or its affiliates. This material is intended to highlight market action and does not constitute investment, legal or tax advice. If you are a retail investor or lack experience in trading complex financial products, it is advisable to seek professional advice from licensed advisor before making any financial decisions.
This content is not intended to manipulate the market or encourage any specific financial behavior.
Swissquote makes no representation or warranty as to the quality, completeness, accuracy, comprehensiveness or non-infringement of such content. The views expressed are those of the consultant and are provided for educational purposes only. Any information provided relating to a product or market should not be construed as recommending an investment strategy or transaction. Past performance is not a guarantee of future results.
Swissquote and its employees and representatives shall in no event be held liable for any damages or losses arising directly or indirectly from decisions made on the basis of this content.
The use of any third-party brands or trademarks is for information only and does not imply endorsement by Swissquote, or that the trademark owner has authorised Swissquote to promote its products or services.
Swissquote is the marketing brand for the activities of Swissquote Bank Ltd (Switzerland) regulated by FINMA, Swissquote Capital Markets Limited regulated by CySEC (Cyprus), Swissquote Bank Europe SA (Luxembourg) regulated by the CSSF, Swissquote Ltd (UK) regulated by the FCA, Swissquote Financial Services (Malta) Ltd regulated by the Malta Financial Services Authority, Swissquote MEA Ltd. (UAE) regulated by the Dubai Financial Services Authority, Swissquote Pte Ltd (Singapore) regulated by the Monetary Authority of Singapore, Swissquote Asia Limited (Hong Kong) licensed by the Hong Kong Securities and Futures Commission (SFC) and Swissquote South Africa (Pty) Ltd supervised by the FSCA.
Products and services of Swissquote are only intended for those permitted to receive them under local law.
All investments carry a degree of risk. The risk of loss in trading or holding financial instruments can be substantial. The value of financial instruments, including but not limited to stocks, bonds, cryptocurrencies, and other assets, can fluctuate both upwards and downwards. There is a significant risk of financial loss when buying, selling, holding, staking, or investing in these instruments. SQBE makes no recommendations regarding any specific investment, transaction, or the use of any particular investment strategy.
CFDs are complex instruments and come with a high risk of losing money rapidly due to leverage. The vast majority of retail client accounts suffer capital losses when trading in CFDs. You should consider whether you understand how CFDs work and whether you can afford to take the high risk of losing your money.
Digital Assets are unregulated in most countries and consumer protection rules may not apply. As highly volatile speculative investments, Digital Assets are not suitable for investors without a high-risk tolerance. Make sure you understand each Digital Asset before you trade.
Cryptocurrencies are not considered legal tender in some jurisdictions and are subject to regulatory uncertainties.
The use of Internet-based systems can involve high risks, including, but not limited to, fraud, cyber-attacks, network and communication failures, as well as identity theft and phishing attacks related to crypto-assets.

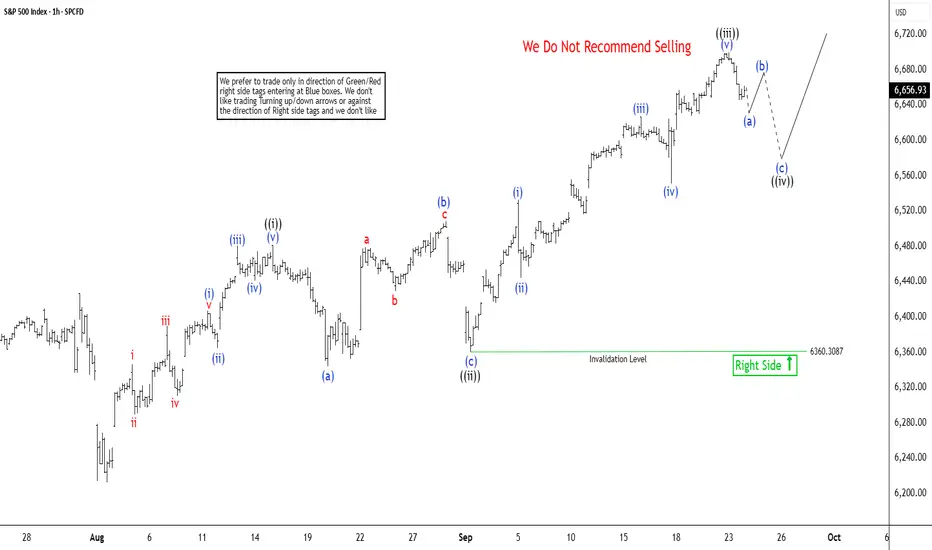
S&P 500 (SPX) Remains Bullish and Should See Support in 3, 7, 11The short-term Elliott Wave analysis for the S&P 500 (SPX) indicates that the cycle starting from the August 2, 2025 low is unfolding as a five-wave structure. From that low, wave ((i)) concluded at 6481.34. The subsequent pullback in wave ((ii)) developed as a running flat Elliott Wave pattern. In this structure, wave (a) declined to 6343.86, wave (b) rallied to 6508.23, and wave (c) fell to 6360.3, completing wave ((ii)) at a higher degree.
The Index then advanced in wave ((iii)). From the wave ((ii)) low, wave (i) reached 6532.65, followed by a dip in wave (ii) to 6443.98. The Index climbed higher in wave (iii) to 6626.99, with a pullback in wave (iv) ending at 6551.15. Wave (v) then pushed to 6699.52, finalizing wave ((iii)). Currently, wave ((iv)) is correcting the cycle from the September 2, 2025 low, expected to unfold in a 3, 7, or 11 swing pattern before the Index resumes its upward trajectory. In the near term, as long as the pivot low at 6360.3 holds, dips should attract buyers in a 3, 7, or 11 swing structure, supporting further upside.
Most underrated chart?? /// S&P500 /// $7500 bull market targetMost underrated chart out there? We are on the end of raging bull run where we broke out in 2013 and been going higher and higher since then. We gone top out at around $7500. The two green circles is where the points on the ray line is and the two other ray lines is a clone of that bottom line. Hope the chart is helpful. The stage is set. Hope this chart is helpful.
