SPX .Pulling back a tadBuyers will want to keep it above 6700
6680-6695 is a bull test area if it gets there
Trade ideas

SPX500 Price consolidation to the downside,The S&P 500 is showing signs of price consolidation to the downside, suggesting a potential test of near-term resistance before another decline toward key support levels.
U.S. stock futures opened the week flat as easing U.S.–China trade tensions offered some relief to investors. However, market participants are now shifting their focus toward a busy earnings week and upcoming inflation data. Additionally, attention is on the diplomatic meetings between U.S. and Chinese Treasury officials, which could influence broader sentiment.
The SPX500 remains under bearish pressure, with momentum indicators pointing lower while price continues to trade below key moving averages. A short-term rebound toward resistance may occur before sellers regain control. a First support 6,652 level could open the door for a deeper correction toward the 6,600 region.
You may find more details in the chart.
Trade wisely best for Luck Buddies.
Ps. Support with like and comments for better analysis Thanks For Supporting.

ESG Investing and Green FinanceIntroduction
In the 21st century, global finance has undergone a profound transformation. Investors, corporations, and governments are increasingly recognizing that economic growth must go hand in hand with environmental protection, social responsibility, and ethical governance. This shift has given rise to two major trends — ESG (Environmental, Social, and Governance) investing and Green Finance. Both concepts aim to align financial decision-making with sustainability goals, addressing global challenges such as climate change, inequality, and responsible corporate behavior. ESG investing and Green Finance are not just moral imperatives; they are strategic approaches that seek long-term value creation, risk management, and the transition to a low-carbon economy.
1. Understanding ESG Investing
ESG investing refers to an investment strategy that incorporates environmental, social, and governance factors into financial analysis and portfolio management. It goes beyond traditional financial metrics by assessing how companies manage sustainability-related risks and opportunities.
Environmental criteria evaluate how a company impacts the planet — through carbon emissions, waste management, water usage, renewable energy adoption, and biodiversity protection.
Social criteria examine how a company treats people — including employees, customers, suppliers, and local communities. It focuses on labor rights, diversity, equality, workplace safety, and human rights.
Governance criteria assess corporate ethics, transparency, board diversity, executive compensation, and shareholder rights.
In essence, ESG investing combines profitability with purpose, allowing investors to generate financial returns while contributing to positive social and environmental outcomes.
2. Evolution and Growth of ESG Investing
The origins of ESG investing can be traced back to socially responsible investing (SRI) movements of the 1960s and 1970s. Activist investors avoided industries such as tobacco, weapons, or apartheid-linked businesses. However, ESG investing evolved beyond exclusionary screening to focus on proactive investment in sustainable and responsible companies.
A significant milestone occurred in 2006, when the United Nations launched the Principles for Responsible Investment (UNPRI), encouraging institutional investors to integrate ESG principles into their investment decisions. Since then, ESG investing has grown exponentially.
By 2025, the global ESG assets under management (AUM) are projected to exceed $50 trillion, representing more than one-third of total global assets. Major asset managers like BlackRock, Vanguard, and Fidelity have incorporated ESG frameworks into their portfolios, while ESG-focused funds have outperformed traditional funds in many market cycles, particularly during crises such as the COVID-19 pandemic.
3. Key Components of ESG
(a) Environmental Factors
Environmental aspects are central to ESG investing. Investors assess a company’s carbon footprint, energy efficiency, waste disposal practices, and compliance with environmental laws. For instance, companies that transition toward renewable energy sources or adopt circular economy principles are considered environmentally sustainable.
Important sub-factors include:
Greenhouse gas (GHG) emissions and carbon neutrality goals
Renewable energy investment
Water conservation and pollution control
Sustainable supply chains
Biodiversity preservation
For example, Tesla and Ørsted attract ESG investors for their leadership in clean energy and low-carbon technologies.
(b) Social Factors
The social dimension emphasizes a company’s treatment of people and communities. This includes fair labor practices, human rights, product safety, customer privacy, and diversity initiatives. A company’s reputation and long-term success often depend on social responsibility and stakeholder trust.
Key areas include:
Employee welfare and workplace safety
Gender and racial diversity in leadership
Consumer protection and ethical marketing
Community development programs
Supply chain ethics
Firms like Unilever and Patagonia are known for integrating social responsibility into their corporate strategy, enhancing both brand loyalty and long-term profitability.
(c) Governance Factors
Governance ensures accountability, transparency, and ethical leadership. It involves assessing how decisions are made within an organization and whether management aligns with shareholders’ and stakeholders’ interests.
Governance evaluation considers:
Board composition and independence
Executive pay and accountability
Anti-corruption policies
Shareholder voting rights
Ethical corporate conduct
Poor governance can lead to scandals and losses, as seen in corporate collapses like Enron or Wirecard, where lack of oversight and transparency destroyed investor confidence.
4. ESG Investing Strategies
Investors use several methods to implement ESG principles:
Negative Screening: Excluding companies involved in harmful industries (e.g., fossil fuels, tobacco, or weapons).
Positive Screening: Selecting companies that perform better on ESG metrics than their peers.
Best-in-Class Approach: Investing in the most sustainable companies within each sector.
Thematic Investing: Focusing on specific sustainability themes such as renewable energy, clean water, or gender equality.
Impact Investing: Targeting measurable social and environmental outcomes alongside financial returns.
ESG Integration: Incorporating ESG data into traditional financial analysis to evaluate overall risk-adjusted returns.
These approaches allow investors to align their portfolios with their values and long-term sustainability goals.
5. Importance and Benefits of ESG Investing
ESG investing offers multiple advantages to investors, businesses, and society.
Risk Mitigation: Companies with strong ESG performance tend to manage risks better, reducing exposure to legal, environmental, and reputational crises.
Financial Performance: Numerous studies show a positive correlation between ESG integration and long-term financial returns. Sustainable firms are often more efficient, innovative, and resilient.
Investor Demand: Younger generations, especially Millennials and Gen Z, increasingly prefer ethical investments that align with their values.
Regulatory Support: Governments and regulators are promoting ESG disclosures, creating an environment where sustainability becomes a necessity rather than a choice.
Corporate Reputation: Strong ESG performance enhances brand image, attracting customers, investors, and top talent.
6. Understanding Green Finance
While ESG investing focuses on evaluating sustainability within investments, Green Finance refers to financial instruments and services that directly support environmentally beneficial projects. It aims to mobilize capital toward green initiatives that promote climate resilience, energy efficiency, and ecological sustainability.
Green Finance includes a wide range of products such as:
Green Bonds – bonds issued to finance renewable energy, clean transportation, and waste management projects.
Green Loans – loans with favorable terms for sustainable projects.
Green Mutual Funds and ETFs – investment funds focusing on companies or projects that meet environmental standards.
Carbon Markets and Credits – mechanisms that incentivize emissions reduction.
Sustainable Insurance and Banking – financial institutions offering eco-friendly products and services.
In essence, Green Finance channels money into projects that contribute to a low-carbon and sustainable future.
7. The Rise of Green Finance Globally
Green finance gained global recognition after the 2015 Paris Agreement, which called for aligning financial systems with climate goals. The agreement encouraged nations to mobilize trillions of dollars in climate finance to limit global warming to below 2°C.
Leading economies such as the European Union, China, and the United States have established green finance frameworks.
The EU Green Deal and EU Taxonomy for Sustainable Activities provide a clear classification system for green investments.
China’s Green Bond Endorsed Project Catalogue guides green bond issuance and has made China one of the largest green bond markets globally.
Multilateral institutions such as the World Bank and Asian Development Bank support developing nations in adopting green finance principles.
According to the Climate Bonds Initiative, global green bond issuance surpassed $600 billion in 2023, signaling the growing importance of sustainability-linked finance.
8. Relationship Between ESG Investing and Green Finance
While both concepts share sustainability as their foundation, they differ in scope and application.
ESG investing focuses on evaluating corporate behavior and integrating sustainability into investment decisions across all industries.
Green Finance specifically directs capital toward projects that have clear environmental benefits.
However, the two are interconnected. ESG investors often allocate capital to green financial instruments, while green finance initiatives rely on ESG metrics to ensure accountability and transparency. Together, they form the backbone of sustainable finance, promoting a more inclusive and climate-conscious global economy.
9. Challenges in ESG Investing and Green Finance
Despite their growth, both ESG investing and green finance face several challenges:
Lack of Standardization: Different countries and rating agencies use varied ESG criteria, leading to inconsistent assessments and “greenwashing.”
Greenwashing Risks: Some companies exaggerate their sustainability claims to attract investors without actual environmental commitment.
Data Availability: Reliable ESG data and performance metrics are limited, especially in developing markets.
Short-Term Investor Mindset: Many investors prioritize short-term gains over long-term sustainability impacts.
Regulatory Barriers: Inconsistent regulations across jurisdictions make it difficult to measure and compare ESG performance globally.
Transition Costs: Shifting to sustainable business models requires upfront investments that may deter smaller firms.
Addressing these challenges requires global cooperation, transparent reporting, and strong regulatory frameworks.
10. The Future of ESG and Green Finance
The future of finance is undeniably green and responsible. Governments, institutions, and individuals are realizing that sustainability is essential for economic resilience and planetary survival. Key future trends include:
Mandatory ESG Disclosure: Regulators in the EU, India, and the US are introducing compulsory ESG reporting standards for corporations.
Technology Integration: Artificial intelligence, blockchain, and big data analytics are improving ESG measurement and transparency.
Sustainable Development Goals (SDGs): ESG investing and green finance will play vital roles in achieving the United Nations’ 17 SDGs by 2030.
Green Central Banking: Central banks are increasingly integrating climate risks into monetary policies and lending frameworks.
Emerging Market Participation: Developing countries are adopting green finance to address energy transitions and attract foreign investment.
Ultimately, ESG and green finance are not temporary trends — they represent a long-term transformation of the global financial system.
Conclusion
ESG investing and Green Finance have redefined how the world views the relationship between money, ethics, and the environment. They demonstrate that profitability and sustainability can coexist, driving innovation, resilience, and inclusive growth. As climate change intensifies and social challenges persist, the role of finance as a catalyst for sustainable development has never been more crucial.
By integrating ESG principles and promoting green financial instruments, investors and policymakers can pave the way toward a more sustainable, equitable, and prosperous global economy. The future belongs to those who not only generate wealth but also protect the planet and uplift society — a vision where finance serves humanity, not just profits.

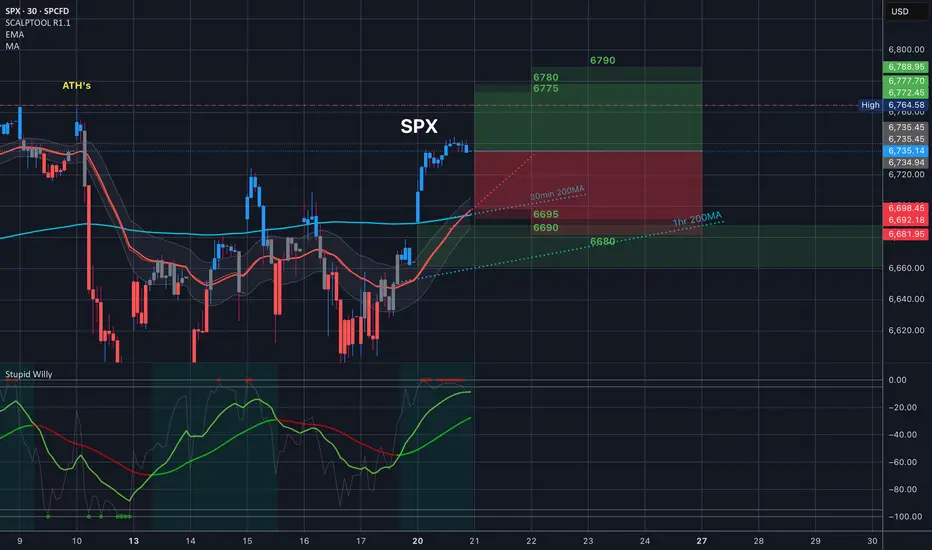
$SPX Tomorrow’s Trading Range 10.21.25
Alway’s know where your 35EMA is. It is underneath the implied move right now, which means tomorrow has a high probability of being flat or down. ATH’s are in tomorrow’s range above us, and 35EMA underneath us with that 30min 200 and also the bull gap from open as well… let’s go…
S&P500 - $8.000 is the ultimate target!🎊S&P500 ( TVC:SPX ) continues the bullrun:
🔎Analysis summary:
Over the course of the past couple of months, the S&P500 has been rallying +40%. However, this does not mean that the bullrun is over any time soon. Since the S&P500 perfectly respects the rising channel pattern, a move to the upper trendline is the target.
📝Levels to watch:
$8,000
SwingTraderPhil
SwingTrading.Simplified. | Investing.Simplified. | #LONGTERMVISION

Monday up, Thursday lowOr something like that. I expect a C wave down next which should take a few days at least. Gold also probably pulls back to 4100-4k. BTC probably lower, now at resistance. All moves down would likely be short lived, so caution is necessary.

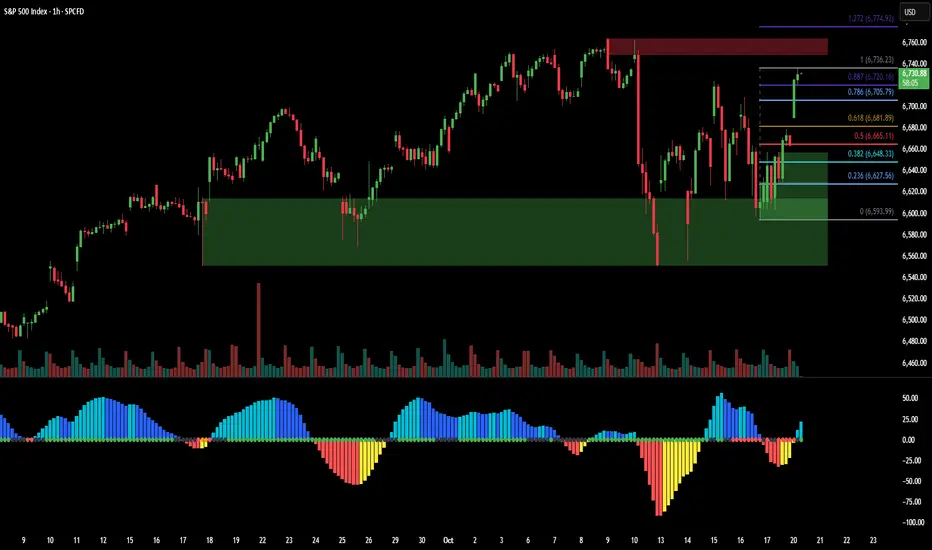
S&P 500 Index Near Key Resistance – Correction Ahead?Recently, the S&P 500 ( SP:SPX ) has seen some sharp moves with high momentum due to the tariff tensions between the US and China over the past couple of weeks. These moves have also impacted other correlated markets like cryptocurrency .
In the past day, news came out that Trump is planning to meet the Chinese president on October 31st . With markets opening, the S&P 500 started to rise and is currently moving near a Resistance zone($6,734_$6,690) and close to its Resistance lines .
From an Elliott Wave perspective, it seems that the S&P 500 is completing a microwave 5 of the main wave C , and the corrective structure looks like an Regular Flat(ABC/3-3-5) .
I expect that in the coming hours, the S&P 500 index could drop at least to around $6,641(First Target) .
Second Target: $6,611
Stop Loss(SL): $6,735
Note: The $6,641 level is quite important in the context of the recent rally and could act as both support and resistance for the S&P 500.
A possible decline or fall in the S&P 500 index could also cause Bitcoin to decline (due to Bitcoin's high correlation with the S&P 500 index in recent weeks).
Please respect each other's ideas and express them politely if you agree or disagree.
S&P 500 Index Analyze (SPX500USD), 1-hour time frame.
Be sure to follow the updated ideas.
Do not forget to put a Stop loss for your positions (For every position you want to open).
Please follow your strategy and updates; this is just my Idea, and I will gladly see your ideas in this post.
Please do not forget the ✅' like '✅ button 🙏😊 & Share it with your friends; thanks, and Trade safe.

SPX Hourly Structure: Rotation From Demand Toward SupplySPX has been climbing steadily off the mid-October demand base near 6,600–6,620, an area that absorbed multiple downside attempts over the past week. The current advance has now retraced the prior swing decline almost in full, reaching into the 0.886–1.0 Fibonacci zone near 6,720–6,736.
This region also overlaps with a prior overhead supply zone (≈ 6,740–6,760) that capped the early-October highs. That confluence makes this area a potential battleground between recovering buyers and residual sellers from the last breakdown.
Key structural notes:
Demand zone: 6,600 – 6,620 remains the short-term pivot for support.
Fib confluence: 0.786 – 1.0 zone aligns with prior rejection levels.
Momentum: Positive but flattening, hinting at possible consolidation if supply reacts.
Watching how SPX behaves inside this upper band will reveal whether the current move is part of a larger trend resumption or simply a retest within a range.
— Volatility Structure Notes
Educational analysis of SPX structure, supply/demand, and volatility context.
SP500 7000+++++In our latest analysis, we emphasized this region as decisive for seeking new highs.
Not much has changed since the last one, it made a small retraction and is already looking for the last ATH again.
Stay tuned in this price region, if it breaks we could soon see SP500 above 7000 points
Become a part of our Forex Dream Community

“SPX – 750-Point Range in Play”Date: 20-10-2025
#SPX - Current Price: $6,664.00
Pivot Point: $6,656.59 Support: $6,518.03 Resistance: $6,796.21
Upside Levels:
L1: $6,938.02 L2: $7,079.83 L3: $7,238.55 L4: $7,397.26
Downside Levels:
L1: $6,375.69 L2: $6,233.35 L3: $6,074.64 L4: $5,915.92
#SPX #TRADINGVIEW #DJI #NDQ # NIFTY

SPX into the open.Monday 20th OctoberLooking pretty bullish.Previous rez was above 6700.Lets see what happens above 6710 area

BUY SPX - S&P500- Profitable trade opportunity!Based on our deep analysis we can see that SPX (S&P500) will head to the upside. Great time to BUY - it is currently in a uptrend and is holding on to powerful support levels. The next target is the resistance level to the upside. This is a great low risk high reward trade. BUY NOW!

SPX500 – Overview | Bearish Pressure Below 6,699SPX500 – Overview | Bearish Pressure Below 6,699
U.S. stock futures opened the week flat, as easing U.S.–China trade tensions offered some relief to markets.
Investors are now turning their focus to a busy earnings week and upcoming inflation data, while diplomatic meetings between U.S. Treasury Secretary Scott Bessent and Chinese Vice Premier He Lifeng aim to further defuse tensions ahead of a potential Trump–Xi summit later this month.
🕯 Technical Outlook
SPX500 remains under bearish momentum while trading below 6,699, targeting 6,670 → 6,633 → 6,610.
If the price closes a 1H candle above 6,716, it would shift momentum bullish, with upside targets at 6,754 and beyond.
Pivot: 6,699
Support: 6,670 – 6,633 – 6,610
Resistance: 6,716 – 6,731 – 6,755

Or is this profit-taking ahead of year-end rebalancing?Or is this profit-taking ahead of year-end rebalancing?
1. US500 has reclaimed multiple EMAs, but price is still rotating around them—signaling range conditions and a wait for a clear break. With price hovering near the range top, the pullback is possible to extend consolidation or even shift to downtrend.
2. Failure to clear 6700 risks a roll-over beneath the EMAs toward 6500 support.
3. However, a decisive break/close above the 6700 swing high would confirm upside continuation and reopen the uptrend.
4. Equities investors paused ahead of big earnings and a delayed inflation print that could drive moves later this week. Markets were still nursing losses from bank-stress jitters, though solid U.S. regional bank results briefly calmed volatility.
5. Goldman Sachs said hedge funds sold U.S. equities at the fastest pace since early April, led by shorts in Macro Products and single names. U.S. ETF short interest saw its biggest jump in 5+ months, ending a seven-week net-buying streak.
6. Therefore, the failure to make a new high may signal profit-taking pressure, and the price could fall further as we approach year-end.
Analysis by: Krisada Yoonaisil, Financial Markets Strategist at Exness

SPX | DAILY ANALYSIS #6Hello and welcome back to DP.
Let’s kick off the weekday together by analyzing the **S&P 500 Index (SPX)**.
🟠 Market Overview
Previous Close: 6692.50
Current Daily Range: 6678.00 – 6705.80
Asia Session High: 6705.80
Asia Session Low: 6678.00
The index has seen significant selling pressure over the past week. She broke below the previous demand zone at 6715–6700, forming a new demand zone between 6680–6665.
This could suggest:
* Sellers are gaining momentum, OR
* Short positions were liquidated to make room for new entries.
🔵 Key Levels to Watch
Resistance Zone (Upside Target):
6711 – A break and hold above this level could lead to a test of 6735 and potentially new highs near 6755.
Support Zone (Blue Box):
6680 – 6665 – This is a critical support zone.
If broken, we may see the index fall toward:
First Support (Yellow Box): 6645
Deeper Support Zone: 6620 – 6605
If the 6680 zone holds and we see bullish confirmation (e.g., strong buying wicks, volume spike, or bullish engulfing candle), buyers may regain control and push the price back up toward the 6710–6730 range.
🧠 Trading Outlook
Bullish Bias Above: 6711
Bearish Bias Below: 6680
Neutral Zone: 6680–6710 (watch for consolidation or fakeouts)
📌 Note: The current structure suggests we are at a decision point. Be patient, wait for confirmation, and manage your risk accordingly.
Take care and have a great trading day!
For informational purposes only – not financial advice. © DIBAPRISM
Amir D. Kohn

S&P 500 Index Shows Elevated VolatilityS&P 500 Index Shows Elevated Volatility
On the 4-hour chart of the S&P 500 Index (US SPX 500 mini on FXOpen), the ATR indicator with standard settings has not fallen below the 30 mark, signalling higher current market volatility compared to previous periods. Traders’ decisions are being influenced by the ongoing government shutdown, developments around a potential US-China tariff deal, and an increasingly active earnings season. Market sentiment has also been shaped by renewed concerns over regional bank stability and profit-taking in AI-related stocks.
Looking ahead, the new week is also expected to bring heightened volatility, as:
→ US Treasury Secretary Scott Bessent and Chinese Vice Premier He Lifeng are set to meet in the coming days, paving the way for a potential meeting between Presidents Trump and Xi later this month.
→ Attention will also turn to quarterly results from Netflix, Coca-Cola, Tesla, IBM, and Intel. With key US economic data releases suspended due to the government shutdown, investors are likely to look to corporate earnings for direction.
Technical Analysis of the S&P 500 Chart
Major turning points on the 4-hour S&P 500 chart, highlighted in bold, outline a broad ascending channel that reflects the market’s expanded price swings.
From a bullish perspective:
→ The price remains in the upper half of the channel.
→ Market sentiment is improving, with prices moving closer to last week’s highs during the European session.
→ As indicated by the arrow, a wide bullish engulfing pattern formed near the lower boundary of the channel, confirming strong buying interest around the 6,560 level.
From a bearish standpoint:
→ Selling pressure was particularly aggressive near 6,720, pushing the price lower on 10 October.
→ Last week, this level once again acted as resistance, suggesting that bears maintain control there, limiting near-term upside potential.
Given these dynamics, traders may wish to adjust their strategies to account for the prevailing volatility. Should positive headlines emerge on US-China trade progress, supported by upbeat corporate forecasts, the S&P 500 could make a push towards the upper channel boundary, potentially setting a new record near the 6,800 mark.
This article represents the opinion of the Companies operating under the FXOpen brand only. It is not to be construed as an offer, solicitation, or recommendation with respect to products and services provided by the Companies operating under the FXOpen brand, nor is it to be considered financial advice.

SPX: Markets have spokenThe previous week continued to be volatile on US equity markets, after the Fridays sell off, two weeks ago. It seems like with all uncertainties coming from the US Government, the market took the time and said: it's enough. This was especially evident on intraday trading, where values of equity indicators were moving from highly negative to highly positive. It seemed like there was no direction in trading. Eventually, the Friday trading session ended up in a positive territory, where the S&P 500 closed the week at 6.664 or 0,5% higher for the day. In order to save the day, the US President commented shortly on Friday on social networks, that 100% tariffs on imports from China is not sustainable. Previously, Fed Chair Powell noted at NABE Conference that further cuts are still an option in the future period, but it will depend on data. At the same time, the US Government continues to be in the state of “shutdown”, not providing any relevant macro data. Both investors and the Fed are currently acting in a sort of blindfolded territory.
Nvidia was especially under pressure during the previous week. The only positive day for the stock was Friday, where the share price increased by 0,78%, but still marking negative territory for the second week in a row. Shares of Apple surged by 1,96% on Friday after the announcement of a contract between Apple and Formula 1 over five-year exclusive U.S. media-rights with Formula 1, starting from 2026, under which Apple TV will become the sole U.S. broadcaster of all F1 races. On the other hand, the semiconductor industry has not experienced such a high volatility. The TSMC delivered a standout performance, topping earnings expectations and raising its guidance, through which the company fuelled investors' confidence.
Without official macro data, the week ahead will be another one which will be guided by fundamentals and/or announcements from the US Administration. It means that markets are going to stay within the “yellow” zone. Analysts are commenting that this zone does not mean that the market will switch to the red zone and significant correction, but only that they are currently highly alerted.
US500 rallied despite lingering risks of regional banks stress
Fears surrounding regional banks that rattled markets quickly faded, as reassuring earnings results and President Trump’s conciliatory tone toward China restored investor confidence.
Earlier this week, Zions Bank and Western Alliance Bank reported losses tied to loan fraud, reviving fears reminiscent of the Silicon Valley Bank collapse. However, stronger-than-expected earnings and limited signs of credit deterioration reassured investors and eased market jitters. Moody’s noted that while concerns over bad loans persist, there is little evidence of systemic risk. They added that regional banks’ key health metrics remain solid.
US500 briefly tested the support at 6530 before approaching the resistance at 6700 again. The index remains above bullish EMAs, indicating a potential extension of bullish momentum.
If US500 closes above 6700, it may gain upward momentum toward the next resistance at 6800. Conversely, if it closes near EMA21, the index may retreat toward the next support at 6530.

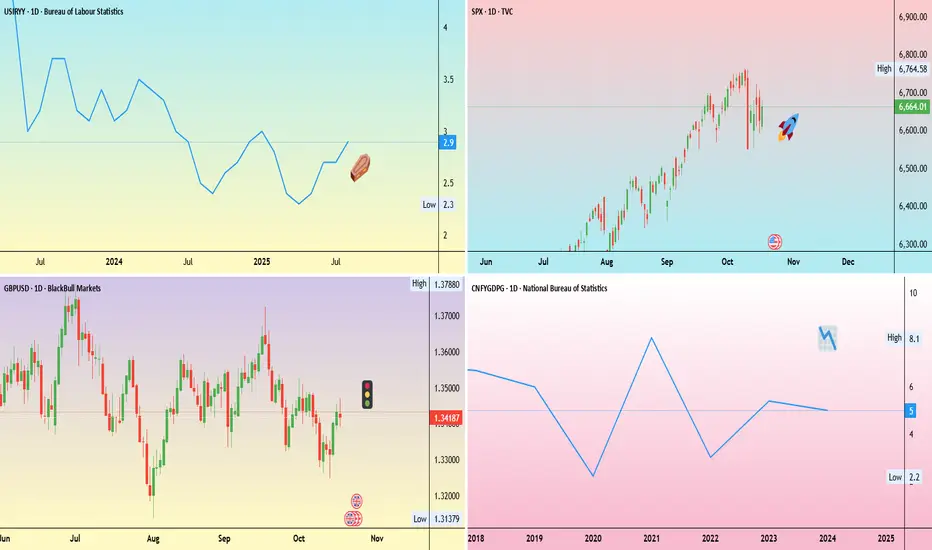
Weekly Trading Opportunities | October 21–25 • Monday: China GDP data
China’s third-quarter GDP report will be closely watched as growth is expected to slow to 4.8% year-on-year from 5.2% in Q2.
Slowing growth in China could reduce demand and prices for commodities. A surprise upside could support commodity prices.
• Tuesday: Coca-Cola and Netflix earnings.
Earnings season continues with Coca-Cola, Netflix, and others including Tesla, IBM, and Intel.
Strong results could offset soft U.S. data and help reignite the risk-on environment.
• Wednesday: U.K. inflation data and Tesla earnings
U.K. inflation is expected to edge back toward 4%. A softer reading could boost U.K. equities and pressure the pound.
• Thursday: Intel earnings
• Friday: U.S. CPI report
With the U.S. government shutdown entering its fourth week, the CPI release remains the week’s key data point. A hotter print could lift the dollar.
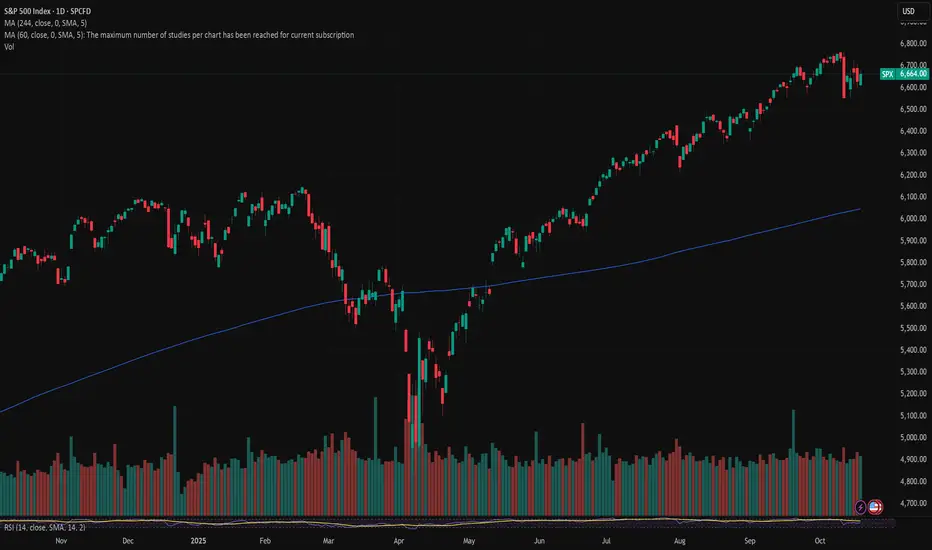
SPX: S&P500 An Economical Reset Again?Technically, the chart is vivid and self-explanatory.
The RSI (14) is implicating an obvious Negative Divergence before the last downturn and the chart recent structure.
The US treasury has no other option but printing more and more bucks, or cutting the interest rates. I don't know any other financial instruments.
Fundamentally, no market structure can soar or fall eternally.
I have had a look on BTC and Gold Futures. Gold has some room during the coming years. Yet, regarding bitcoin, according to futures I prefer not to be too optimistic.
The implications at the moment are only some assumptions and the future remains a uncertain. This is a systematic luck guess and bet.
We have several barometers and tools based on which we can Approximate the possibilities through a few scenarios and nothing more.
Eventually, we need to check those factors and barometers and practice several reasonable scenarios on our capital.
This is not a financial advice, but it is a serious warning against perils if an over-financialization phenomenon following almost a century from that black era of high unemployment and economical downturn that the US experienced in 1930s.
DYOR
Please like and follow and have your comments inhere.

S&P 500 Bear Market in 2026The Stock market is going to send Crypto into a Bear market in 2026.
It just broke it's weekly cycle count and it's currently painting a bullish divergence. This means only one thing - we are going into a blow-off top within the next 2 months.
We are going to top above 7000 area, and in case we don't have a proper retracement into the Weekly Cycle low within November, we are going to make a blow-off top in December/January.
2026 Year will be profit taking year and the stock market is expected to retrace 20%, while Bitcoin will go down by more than 50%.
It's the last leg of the bull and it's time to get allocated in the market.

BUY SPX - S&P500- Amazing low risk high reward trade!Based on our deep analysis we can see that SPX - S&P500 will head to the upside. Great time to buy - it has broken major resistance levels + trends.

Market Pulse: Cracks in the Bull?We kick off the week with the S&P still riding its two-month uptrend, supported by the 55-day MA at 6541. But signs of fatigue are emerging.
📉 Amazon is slipping below its 200-day MA 📊 NVIDIA’s recent high at 195.62 hovers near the 197 Fibonacci extension and the 200 psychological level
Technically, the uptrend holds—and if 6765 the recent high breaks, the bull may charge on. If the 55-day MA erodes, brace for a correction.
🔍 Keep chart levels in focus 📌 Tighten stops ⚠️ Not investment advice
#TechnicalAnalysis #SP500 #Amazon #NVIDIA #MarketUpdate #TradingStrategy #RiskManagement #Fibonacci #BullMarket #ChartWatch #FinanceTwitter #LinkedInFinance
