S&P500 pullback reaching pivotal zone at 6748The S&P 500 (+0.17%) eked out a small gain yesterday, but market breadth remained weak. The Magnificent 7 (+1.18%) continued to drive performance while the S&P 500 ex-Mag 7 (-0.30%) and equal-weighted index (-0.30%) both declined, highlighting the narrow leadership.
The main positive driver came from another AI-related deal—Amazon’s partnership with OpenAI, which boosted sentiment in large-cap tech. However, overall momentum was capped by soft economic data, hawkish Fed commentary, and concerns around a prolonged U.S. government shutdown, now matching the longest on record and set to surpass it by midnight.
Overnight sentiment turned weaker, with Palantir (-4% after hours) dragging tech sentiment lower after offering limited 2026 guidance despite solid results. Nasdaq and S&P futures are down -0.85% and -0.59%, respectively, and Asian markets are mostly lower, adding to the cautious tone.
Today’s focus:
Earnings: A busy session with results from AMD, Shopify, Uber, Pfizer, BP, and others, likely to shape sector moves.
Politics: U.S. state elections (New York mayoral, New Jersey and Virginia gubernatorial races) could test political sentiment but are unlikely to have major near-term market impact.
Outlook: Expect a softer start for the S&P 500 as tech momentum fades and macro uncertainty persists, with investor focus shifting to corporate earnings and central bank commentary for direction.
Key Support and Resistance Levels
Resistance Level 1: 6830
Resistance Level 2: 6857
Resistance Level 3: 6880
Support Level 1: 6748
Support Level 2: 6727
Support Level 3: 6707
This communication is for informational purposes only and should not be viewed as any form of recommendation as to a particular course of action or as investment advice. It is not intended as an offer or solicitation for the purchase or sale of any financial instrument or as an official confirmation of any transaction. Opinions, estimates and assumptions expressed herein are made as of the date of this communication and are subject to change without notice. This communication has been prepared based upon information, including market prices, data and other information, believed to be reliable; however, Trade Nation does not warrant its completeness or accuracy. All market prices and market data contained in or attached to this communication are indicative and subject to change without notice.
Trade ideas

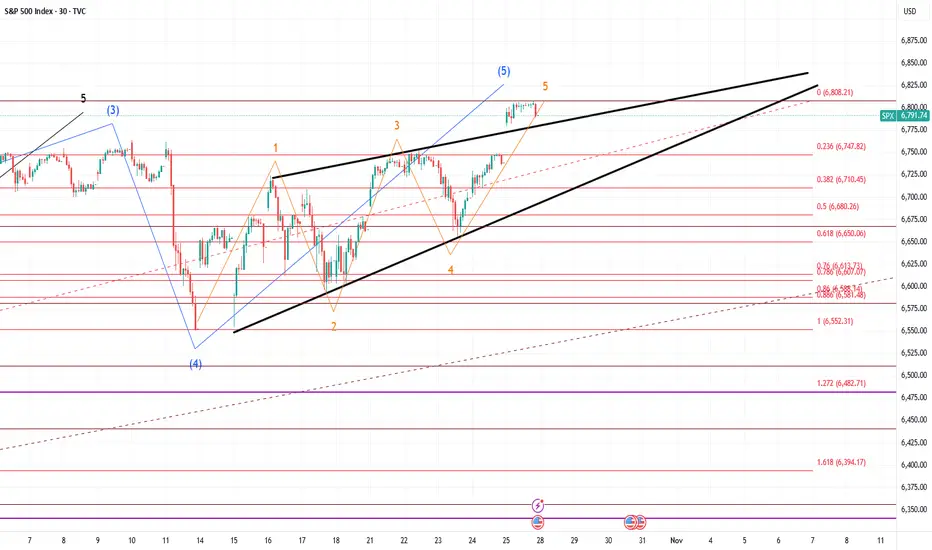
SPX | Daily Analysis #10 - 3 November 2025Hello and Welcome Back to DP,
Review & News Coverage:
Since our last SPX analysis, we mentioned that a broken trendline could open the door for downside movement. As we can see on the chart, the index fell toward the 1.68 Fibonacci zone before bouncing back.
This drop created about $44 of volatility — hopefully, you managed to catch that move! We had highlighted the 6811 area as a potential buy zone, and indeed, that level opened an opportunity for entries (I personally missed it since I needed more confirmation, but I hope some of you caught it).
From both the economic and political sides, several developments could shape SPX sentiment and direction:
Economic Calendar:
Monday: ISM Manufacturing PMI
Wednesday: ADP Non-Farm Employment Change & ISM Services PMI
Friday: Tentative Unemployment Rate
Stronger-than-expected data could strengthen the dollar and weigh on equities, while weaker readings may support a rebound if markets price in potential rate relief.
Political Landscape:
Watch for new announcements on funding negotiations or relief measures — any progress (or setback) in the government-shutdown talks could move markets.
The U.S. government shutdown remains a risk factor, with pressure building from expiring healthcare tax credits and food assistance programs.
And most importantly — keep an eye on “Trump’s Indicator” (his posts or tweets). His remarks often create sharp, short-term volatility across indices and sectors.
1H - 4H Technical Analysis:
On the charts, the SPX is struggling to regain upward momentum.
If price breaks the intraday trendline, room opens for a move down toward 6844 and 6829.
If those zones show strong volume and bullish candle patterns, we could look for buy entries around that range.
The key is to wait for confirmation — volume support and candle behavior will guide whether the market finds its footing or continues to slide.
Summary:
Short-term tone remains cautiously bullish while above 6811, but pressure remains from macro and political uncertainty.
Watch mid-week data and political headlines for volatility spikes.
Technical zones: Support 6829–6811, Resistance 6895–6920 (potential retest if sentiment turns).
Disclaimer:
This content is for informational purposes only and does not constitute financial or investment advice. © DIBAPRISM
Amir D.Kohn


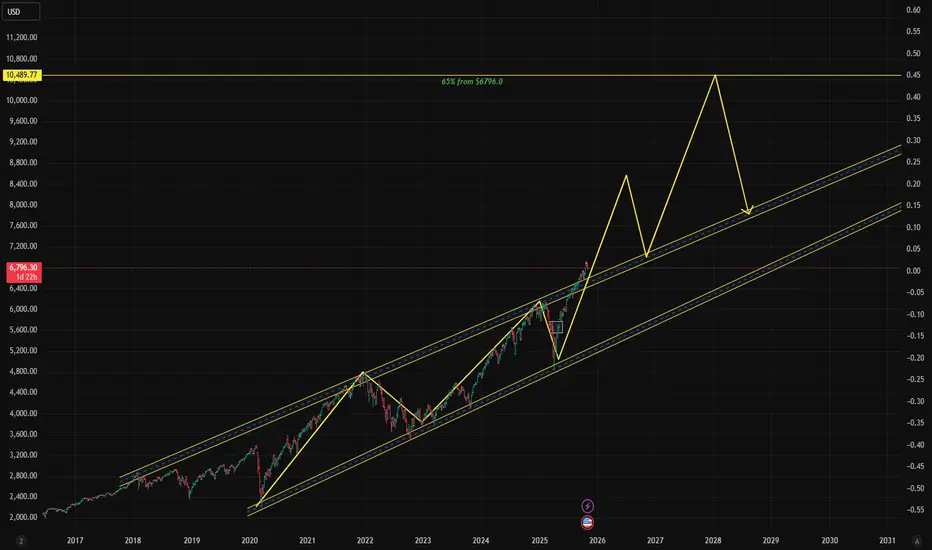
$SPX Hi, we are back with another one: SP:SPX !!!
As we can see we have SP:SPX sitting at $6796.30 with and expectation for a 65% pump.
That would bring us around $9-$10K per 1 SP:SPX .
Wouldn't that be incredible if we can see this by 2026 -2028 ?
What a time to be alive no ?
Don't forget to comment like and share for good luck :) !!!
US500 maintains inherently bullish structureFundamental Analysis
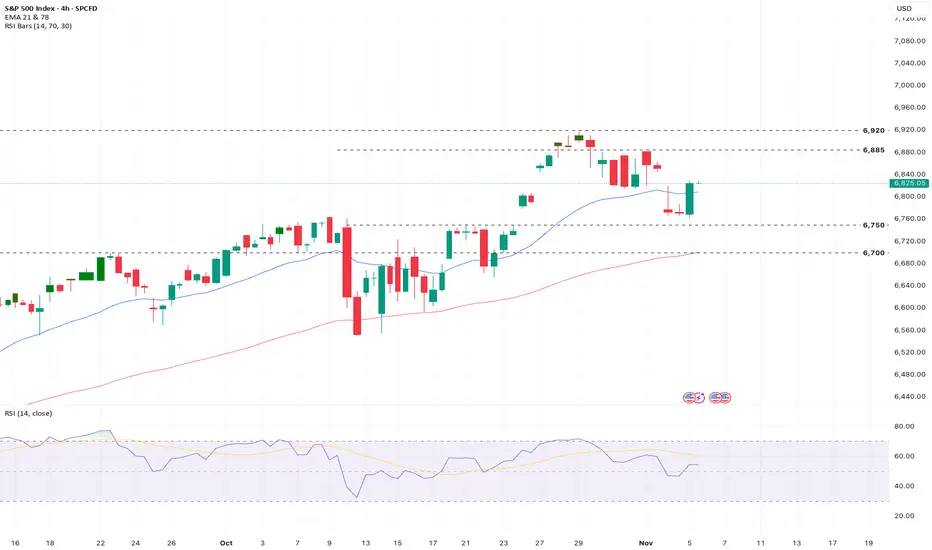
US500 maintains an inherently bullish structure, trading above both EMAs. Q3 earnings were strong, with 83% of companies beating expectations and delivering 13.8% blended EPS growth, largely thanks to megacap tech/AI. However, the forward P/E ratio is high at 23.1x (above the 5-year average of 19.9x), signaling elevated valuations. The recent profit taking in high growth names like AMD and Nvidia due to margin concerns and macro headwinds (high rates/inflation) exposes this valuation sensitivity.
Technical Analysis
The index is currently pulling back from all time highs near 6,900, consolidating in a short term support zone of 6,750. Momentum is neutralizing with RSI approx 51.6, indicating a pause rather than a reversal. Key technical battleground: Resistance at 6,885 and 6,920 versus support at 6,750 and the EMA at 6,700. Consolidation is the most probable short term path.
Sentiment Analysis
Sentiment is cautious to slightly negative. The sharp correction in AI leaders (AMD, NVDA) has fueled "AI bubble" fears, overriding fundamentally strong earnings reports. There is a clear, broad sector rotation occurring as investors de-risk and take year end profits from high growth tech toward defensive/value plays. The market is currently driven by nervousness about sustaining premium valuations against persistent macro uncertainty.
Outlook
The near term outlook is moderately cautious. While the long term bullish trend remains supported by healthy corporate earnings, the market faces an inflection point driven by overvaluation concerns in the tech sector. Further short term volatility is expected as the market digests earnings nuances (like margin guidance) and awaits clearer signals on US monetary policy and inflation. A decisive break of the 6,750 support or 6,885 resistance will likely define the next directional move.
Analysis is by Terence Hove, Senior Financial Markets Strategist at Exness

SPX500 Trading Strategy Explained: From Entry to Exit⚡ SPX500 “STANDARD & POOR” Indices Market Wealth Strategy Map ⚡
(Swing / Day Trade Plan – Thief OG Style)
🧭 Plan
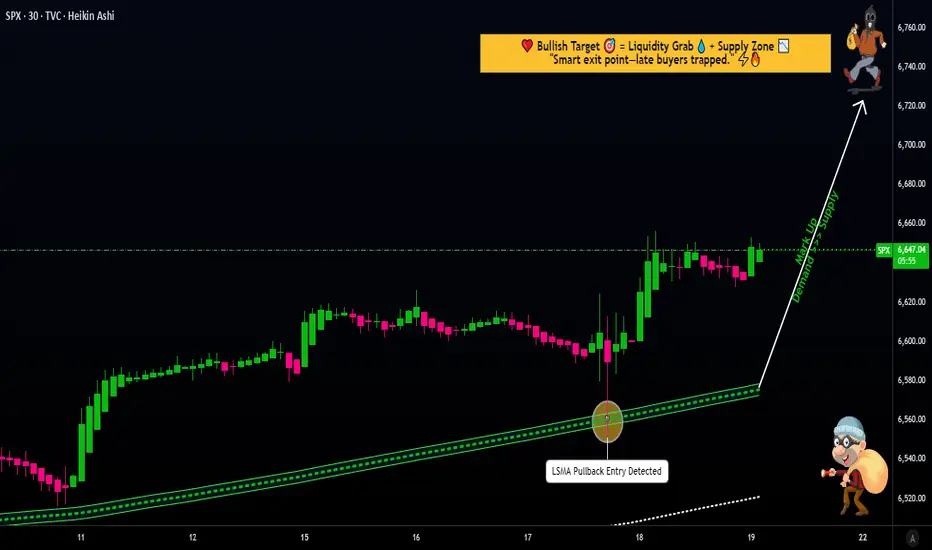
📈 Bias: Bullish confirmed with 30m LSMA pullback + 0.786 Fibonacci-based MA confluence.
💡 Entry Approach (Thief Layering Strategy™):
Instead of one-shot entry, I place multiple buy-limit layers to average into strength. Example setup:
Buy limit: 6600
Buy limit: 6620
Buy limit: 6640
👉 You can extend or adjust the layering based on your own strategy.
🎯 Stop Loss (SL)
This is my Thief SL @6560.
⚠️ Note to Ladies & Gentlemen (Thief OG’s): This SL is not a recommendation. Use your own judgment — protect your loot at your own risk.
💰 Target (TP)
📌 6750 — sitting at strong resistance + overbought zone + possible bull-trap.
⚠️ Again, OG’s — this is not financial advice. Take profit when it fits your plan. Secure the bag, then enjoy the loot!
🔍 Related Pairs to Watch
Keep an eye on these correlated assets to confirm the SPX500’s move:
NASDAQ:NDX (Nasdaq 100): Tech-heavy index with strong correlation to SPX500. If tech stocks are pumping, it’s a bullish signal for our trade. 📊
TVC:DXY (US Dollar Index): A weaker dollar often boosts equities. Watch for inverse correlation—DXY dropping could mean SPX500 is ready to fly! 🚀
TVC:VIX (Volatility Index): Low VIX levels signal market calm, supporting our bullish setup. A spike in VIX could warn of trouble, so stay sharp! ⚡
Key Correlation Insight: SPX500 often moves in tandem with NASDAQ:NDX due to shared tech giants (think Apple, Microsoft). If NASDAQ:NDX is rallying, it’s a tailwind for our trade. Conversely, a rising TVC:DXY or TVC:VIX could signal caution.
📝 Thief Note
Dear Ladies & Gentlemen (Thief OG’s):
This map is my personal swing/day trade playbook — not a fixed recommendation. Layer entries, cut losers fast, and loot when you can. Market moves are wild; manage risk like a true OG.
✨ “If you find value in my analysis, a 👍 and 🚀 boost is much appreciated — it helps me share more setups with the community!”
⚠️ Disclaimer: This is a Thief-style trading strategy shared just for fun & educational vibes. Not financial advice. DYOR & trade responsibly.
Double TopWe have a double top pattern followed a strong bearish engulfing candle, this shows that the price is most likely to fall and make a lower low

S&P500 INDEX | Bulls in Control Above 6,889 Ahead of Fed CutSPX500 – MARKET OVERVIEW | Bullish Momentum Builds Ahead of Fed Decision 🇺🇸
Barclays equity strategists believe stocks will continue their strong rally into year-end, despite some “pockets of froth.”
The Federal Reserve is widely expected to cut interest rates later today, with growing speculation it may also slow or end balance sheet reduction, further supporting risk assets.
Technically, the SPX500 has stabilized above 6,889, confirming bullish momentum and signaling potential continuation toward 6,941 and 6,991.
As long as the index trades above 6,889, the bias remains bullish.
However, to shift toward a bearish trend, the price would need to stabilize below 6,889, which could trigger a decline toward 6,842 and 6,755.
Key Technical Levels
Pivot Line: 6,889
Resistance: 6,941 · 6,991
Support: 6,843 · 6,760
Outlook:
SPX500 remains bullish above 6,889, supported by expectations of a Fed rate cut and year-end equity strength.
A confirmed break below 6,889 would shift momentum to bearish, targeting deeper corrections toward 6,842–6,755.

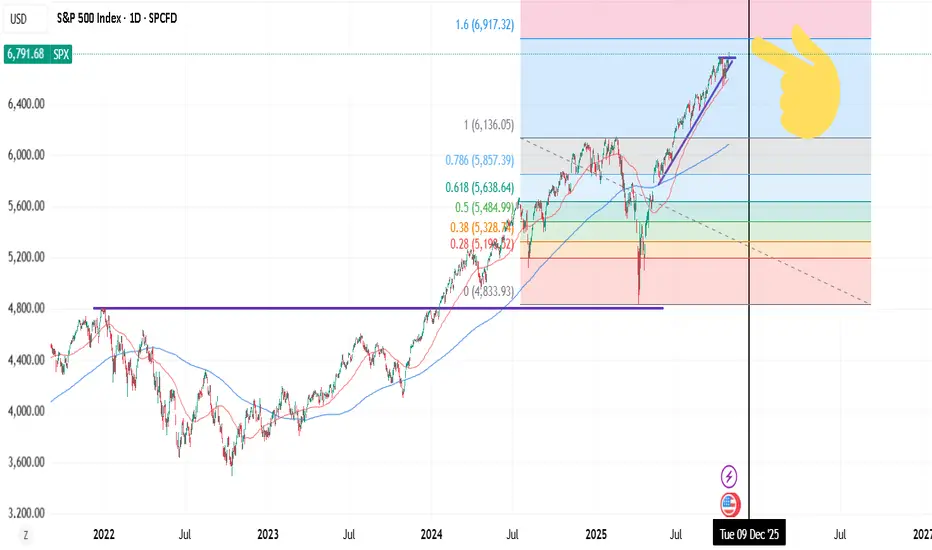
1.6 FIB Ceiling - Stock market correction soon in NOV/DEC.You can apply 1.6 FIB to FAANG or QQQ for high probability ceilings. VIX "structure" (pattern) or setup also indicates it. Stocks forming a sharp "wedge drop", extension from 50dma.
Bullish near term (probably?), correction in NOV/DEC.
I wonder if the first 5 (monthly) trading days in NOV are not volatile AF. 😂
SPX500 H4 | Potential Bearish ReversalS&P500 is reacting off the sell entry at 6,888.42, which aligns with the 100% Fibonacci projection and could reverse from this level to the take profit.
Stop loss is at 6,950, whic is a swing high resistance level.
Take profit is at 6,761.08, which is a pullback support that aligns with the 38.2% Fibonacci retracement.
Stratos Markets Limited (tradu.com ):
CFDs are complex instruments and come with a high risk of losing money rapidly due to leverage. 68% of retail investor accounts lose money when trading CFDs with this provider. You should consider whether you understand how CFDs work and whether you can afford to take the high risk of losing your money.
Stratos Europe Ltd (tradu.com ):
CFDs are complex instruments and come with a high risk of losing money rapidly due to leverage. 70% of retail investor accounts lose money when trading CFDs with this provider. You should consider whether you understand how CFDs work and whether you can afford to take the high risk of losing your money.

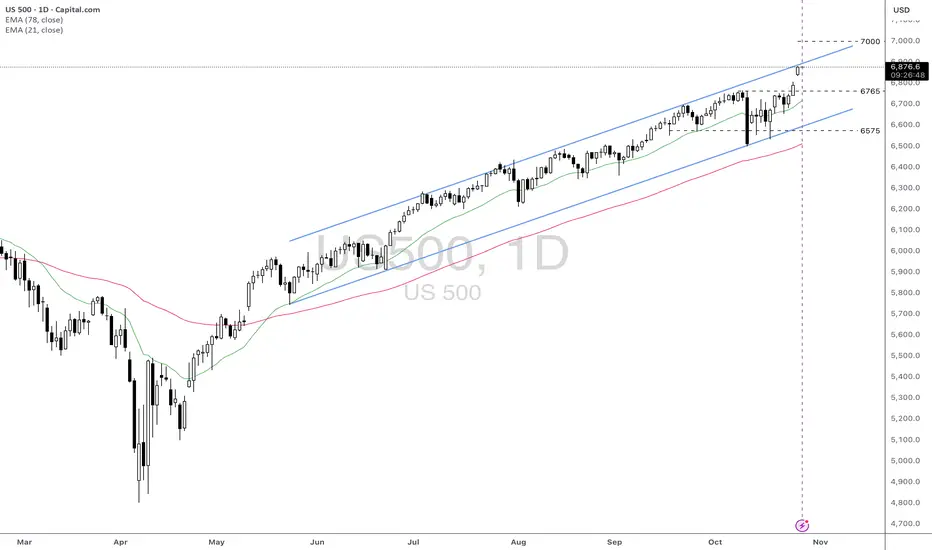
US500: Strong Upward Momentum Approaching 7000 LevelFundamental approach:
- The US500 advanced this week, propelled by strong earnings momentum from tech giants and robust performance in select sectors. Among top movers, Qualcomm rose over 11% following upbeat earnings guidance, while Alphabet and Tesla also rallied ahead of their highly anticipated quarterly results. W.R. Berkley Corporation and Welltower Inc. were notable gainers, reflecting sector rotation and risk-on flows in the index.
- Earnings from the 'Magnificent Seven', including Microsoft, Alphabet, and Meta, drove sentiment, with over 86% of S&P 500 companies reporting results above consensus expectations so far this quarter. Tesla's performance was mixed, while Amazon is set to announce slightly lower profits, but the broader group is still outpacing the rest of the market in earnings growth.
- Tech earnings and the upcoming FOMC decision are key catalysts that may influence future US500 moves. Broad sector participation and ongoing AI investment could sustain upward momentum if macroeconomic conditions remain supportive.
Technical approach:
- US500 created a new all-time high this week after breaching the key level at around 6765. The index showed an urgency in moving upward, creating a gap that remains unfilled. US500 is well above the diverging EMAs, indicating a strong upward momentum. However, the index is approaching the upper bound of the ascending channel, which may limit the price movement.
- If the current gap remains unfilled, the US500 may continue to move upward and test the psychological resistance at 7000.
- On the contrary, rejecting the channel's upper bound may prompt a correction and fill the gap around 6790, retesting the broken level at 6765.
Analysis by: Dat Tong, Senior Financial Markets Strategist at Exness
S&P Nearing Major Resistance (Update)This updates my previous S&P chart back last year showing the S&P still had room to run until any major resistance. We're nearing that major resistance at 7577. Looks like it might hit around January 2026.
The trouble is this trend is heating up and we needed a pullback to 6295. With all the excitement from Nvidia and other major Hyperscalers I'm worried it's going to just go straight to Major resistance. *If it does* we could be looking at a decently large pullback next year (finishing around August) down to that 6295 area and back into the supporting trend line for the next big uptrend to start.
If however we slow down here and get a pullback back to 6295 then I think we're good to make it over the major resistance without that big pullback next year.
Either way once we hit the major resistance at 7577 we'll need to get close to that lower trend line at some point to begin a new bull run.
Good luck and take caution as we approach this resistance!

SPX500 Eyes 7000 — Breakout or Bull Trap Ahead?🦸♂️ SPX 500 Heist: The 7K Bull Run Playbook (Swing Trade Setup) ✅
Alright, crew, listen up! The market is a vault, and we're here to make a strategic withdrawal. The SPX 500 is showing us the blueprints for a potential bullish breakout. This is our plan to ride the wave.
🎯 The Master Plan: BULLISH
We're looking for a classic breakout play. The gates are at 6780, and once they're open, we're going in.
⚡ Entry Signal (The "Go" Signal)
Action: Consider long positions ONLY AFTER a confirmed daily breakout and close above the key level of 🎯 6780.00.
Translation: Don't jump the gun. Wait for the market to show its hand.
🚨 Stop Loss (The "Escape Route")
Location: My suggested escape hatch is down at 🛡️ 6600.00. Place it after the breakout we talked about.
A Note from the OG: "Dear Ladies & Gentleman (Thief OG's), I am not recommending you set only my SL. It's your own choice. You can make money, then take money at your own risk." 😉
💰 Profit Target (The "Loot Bag")
Destination: We're aiming for the major resistance zone at 🎯 7000.00. This is a psychological magnet and a previous area where sellers stepped in.
Why Here? It's a zone of strong resistance, potential overbought conditions, and traps for the greedy. Be smart and escape with your profits!
Another OG Note: "Dear Ladies & Gentleman (Thief OG's), I am not recommending you set only my TP. It's your own choice. You can make money, then take money at your own risk." 😎
🔍 Market Intel: Pairs to Watch
A master thief always checks the surrounding area. Keep an eye on these correlated assets:
AMEX:SPY (SPDR S&P 500 ETF): The direct tracker. Moves almost tick-for-tick with the SPX.
NASDAQ:NDX (Nasdaq 100): Tech-heavy cousin. If NDX is strong, it often pulls SPX up with it.
TVC:DXY (U.S. Dollar Index): Our usual antagonist. A stronger dollar can be a headwind for large-cap stocks.
CME_MINI:ES1! (S&P 500 E-mini Futures): The real-time action. This is where the big moves often happen first.
✨ Community Boost
If you find value in my analysis, a 👍 and 🚀 boost is much appreciated — it helps me share more setups with the community!
#SPX500 #SP500 #SwingTrading #MarketPlaybook #PriceAction #ThiefTrader #IndexAnalysis #TechnicalAnalysis #TradingStrategy #US500 #Equities #BreakoutStrategy #TradingView #StockMarket #RiskManagement

SPX500 | Consolidation Phase Before BreakoutSPX500 – MARKET OUTLOOK | Consolidation Phase Before Breakout 🇺🇸
The S&P 500 is consolidating between 6,918 and 6,879, as traders await the next breakout following recent Fed guidance and earnings results.
Above 6,918: Bullish continuation toward 6,941 → 6,991.
Below 6,879: Opens correction toward 6,842 → 6,770.
Pivot: 6,918
Support: 6,879 · 6,843 · 6,770
Resistance: 6,941 · 6,991
SPX500 remains range-bound, but a breakout from this zone will define the next trend direction.

Forget A Pump In SPX Expect A Dump!Hey fellow traders!
We made good money on the SPX pump now it's time to make more on the dump.
8hr chart is making a inverted V pattern another name is a A pattern, none the less we be dropping a long way if we take out and have a 2hr candle close below the break-line of 6859.3 area.
Target 1) 6799.8 area fills a gap.
Target 2) 6691.6 area is a long way down making bears good money :) $$$
Best of luck in all your trades.

This is the END(ing diagonal)The ending diagonal has formed. If you check RSI you will see a double daily and fresh WEEKLY divergence. It will crash hard next week. 6480 is the first target, but it can be just a bounce area. 1.618 level from low to top of the diagonal is at 6400 level on SPX and at 6300 level on US500 - I think we can get a flash-crash into this area next week. And if this is a reversal, it can trend down to February peak and lower according to fibs.
Weekend Analysis: DXY, BTC, Gold, Silver, Nas100 and SPX500In this video presentation I am expecting the dollar index to continue its uptrend on the lower time frame towards the liquidation level target of 99.500.
Bitcoin is still in a distribution range and currently correcting the sharp sell off from $126,296. I am observing an A-B-C corrective pattern potentially to targets of either $115,044 or $117,653. These are confluence of resistance level and will be expecting a sell off from these levels. If these levels gets invalidated then potentially the all time highs of $126k is in view. However that's not my expectation so a breach of the target level will invalidate the bearish analysis on Bitcoin.
I think Gold and Silver have peaked out for now and smart money is off loading to FOMO retail traders. I am expect Silver to sell off much faster than Gold.
Nas100 and SPX500 clinched to a breakout of new highs but the buying volume is fading out and seems to be a fake out. I will be watching if the breakout levels gets support or breakdown on pullback to decide a long position or short position.
This is my opinion on the market this week and I thank you for your time to visit my publications.
Have a great trading week and don't forget risk and money management is your first job as trader or investor. Cheers!!

SPX500 H1 | Bullish Bounce OffS&P500 has bounced off the buy entry at 6,839.32, which is a pullback support that aligns with the 23.6% Fibonacci retracement and could rise from this level to the take profit.
Stop loss is at 6,793.88, which is a pullback support that lines up with the 50% Fibonacci retracement.
Take profit is at 6,926.57, which s a swing high resistance.
Stratos Markets Limited (tradu.com ):
CFDs are complex instruments and come with a high risk of losing money rapidly due to leverage. 68% of retail investor accounts lose money when trading CFDs with this provider. You should consider whether you understand how CFDs work and whether you can afford to take the high risk of losing your money.
Stratos Europe Ltd (tradu.com ):
CFDs are complex instruments and come with a high risk of losing money rapidly due to leverage. 70% of retail investor accounts lose money when trading CFDs with this provider. You should consider whether you understand how CFDs work and whether you can afford to take the high risk of losing your money.

S&P 500 Consolidation Turning Bullish StructureThe S&P 500 remains in a consolidation phase, leaning toward a bullish trend as it aims for new record highs once again.
Global stocks jumped on Monday to fresh intraday records, while the U.S. dollar eased on optimism that a potential trade deal between China and the U.S. may be approaching. Investors are also awaiting a series of central bank policy meetings and key earnings reports from several mega-cap companies.
From a technical perspective, prices continue to react strongly to the upside. If this upward momentum persists, the next resistance level is seen around 6,950.10.
You may find more details in the chart.
Trade wisely best of Luck buddies,
Ps; Support with like and comments for better analysis Thanks for Supporting.

Thursday updateMarket sold off but the after hours bounced hard. Many of the markets need to make a decision tomorrow. Bias is still up on the SPX. Vix still above support. Gold looking bear flag like. BTC bounced to 110k to test resistance there. Oil still above the 18ma and consolidating still.

SPX | Daily Analysis #9 - 30 October 2025Hello and welcome back to DP,
Market Review:
Well, yesterday was a significant day across global markets — from U.S. stock indexes to crypto assets — with investors digesting major developments from the Federal Reserve and the renewed U.S.–China trade dialogue. The yesterday’s market summery:
- Monetary policy / central bank: The Fed’s decision to cut interest rates by 25 basis points (as expected) was overshadowed by Powell’s cautious tone about future cuts. However, optimism was tempered by comments from Jerome Powell indicating that another rate cut in December is not guaranteed. That caused some caution in the market.
- S&P 500: 6,890.59 (down ~0.30 points). Dow Jones Industrial Average: 47,632.00 (down ~74.37 points, ~0.2%). Nasdaq Composite: 23,958.47 (up ~130.98 points, ~0.5%).One of the biggest drivers: Nvidia Corporation became the first public company to reach a roughly $5 trillion market valuation, boosting the tech segment.
- Trade & geopolitics: The U.S. signalled progress in trade and industrial policy with China: comments from Donald Trump hinted at easing of some tariffs (e.g., on fentanyl-related goods) and possible cooperation on rare-earth export controls. The U.S. will reduce some tariffs on Chinese goods: for example, tariff on certain chemicals tied to fentanyl production will go from 20 % down to 10 %, and overall U.S. duties on Chinese imports shift from ~57 % to ~47 %. China agreed to resume more agricultural purchases from the U.S. (e.g., soybeans, sorghum) and to postpone export restrictions on rare earth materials for about one year.
- And for watching ahead is earnings: Big names like Apple Inc. (AAPL) and Amazon .com Inc. (AMZN) are due after market close, which could influence the market.
- The overall crypto market cap held steady near $3.2 trillion, with sentiment described as “risk-on, but wary.”
1H – 4H Technical Analysis:
As observed on the chart, price has broken below the bullish trend line and moved through yesterday’s key demand zone, signaling a potential shift in short-term momentum.
Currently, the price is declining, approaching lower demand areas. As of this analysis, SPX is retracing and may find temporary support around the 6,842 level, where a short-term rebound toward 6,877 is possible before the next move unfolds.
However, if bullish momentum fails to hold above that level, a drop through the gap zone could follow, pushing price action toward the 6,810 support region, which aligns with the next major demand zone on the 4-hour chart. This zone may serve as a stronger accumulation area for potential medium-term buyers.
From a broader perspective, the recent U.S.–China trade truce provides a fundamental tailwind for the market — a bullish catalyst that could limit downside extensions and support sentiment in the coming sessions.
It’s also notable that the S&P 500’s annual return now stands near +16 %, compared with roughly +24 % two years ago. This suggests that while growth has moderated, there remains room for further upside if macro conditions stay supportive and earnings momentum continues.
Disclaimer:
This content is for informational purposes only and does not constitute financial or investment advice. © DIBAPRISM
Amir D.Kohn

SPXShift prediction to the right.
Global market cooler anticipated. Crypto should be hit the hardest and fastest.
Most anticipating rally continuation like post-COVID...
I think that will cause a surprise.
