SRG IDEARUN AWAY GAP
Filling Gap = entering blue box
+ Crossed Yearly Level
+ Non Failure swing on Daily if FIB 382 is tested
+ Entering on annual level = high R2R
+ Only one more supply on the top
+ 4.618 aligns with target
- 2.618 aligns with ICO price
- Annual level not tested
Next report date
—
Report period
—
EPS estimate
—
Revenue estimate
—
0.0527 USD
31.22 M USD
870.18 M USD
534.68 M
About SRG Global Limited
Sector
Industry
CEO
David Macgeorge
Website
Headquarters
Subiaco
Founded
2003
IPO date
Aug 17, 2007
Identifiers
2
ISIN AU0000032914
SRG Global Ltd. engages in the provision of asset services on land. It operates through the following segments: Maintenance and Industrial Services, Engineering and Construction, and Corporate. The Maintenance and Industrial Services segment focuses on supplying integrated services to customers across the entire asset life cycle. The Engineering and Construction segment is involved in supplying integrated products and services to customers involved in the construction of complex infrastructure. The company was founded in 1961 and is headquartered in Subiaco, Australia.
Related stocks

SRG Global - Cup and Handle Pattern - Bullish!Solid volume coming through the last few days.
If SRG can close above the 62 mark I'm thinking thats confirmation of the cup and handle breakout and the start of a nice bullish run.
Additionally the Moving average compression is breaking to the upside and the relative strength v Index is strong.

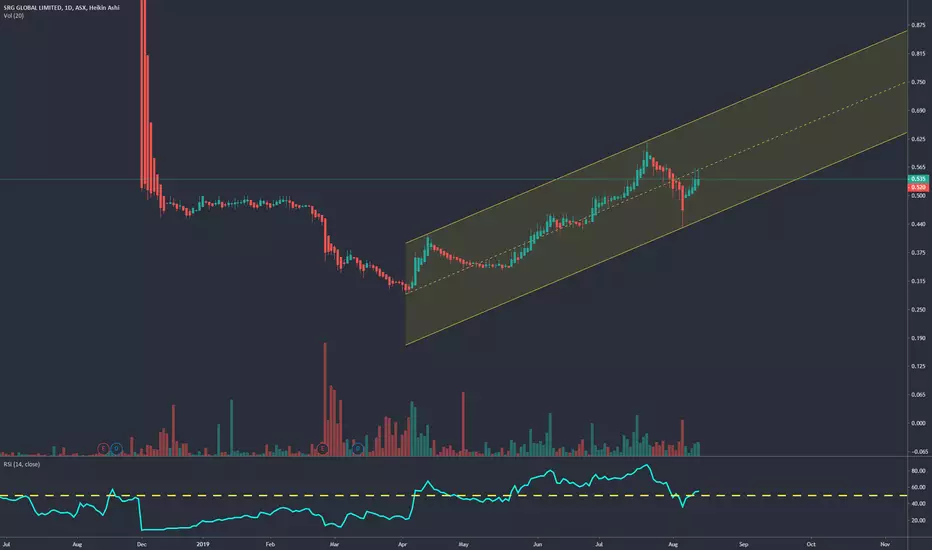
Channel action with some big long term targetswell established and respected channel movement. great volume coming in on price bounce from bottom trent line. Short term opportunity for rise to top of channel. Long term opportunity for rise to highs of july 2019. Massive opportunity for long term gap fill from december 2018.
Entry 0.505
Target


See all ideas
An aggregate view of professional's ratings.
Neutral
SellBuy
Strong sellStrong buy
Strong sellSellNeutralBuyStrong buy
Neutral
SellBuy
Strong sellStrong buy
Strong sellSellNeutralBuyStrong buy
Neutral
SellBuy
Strong sellStrong buy
Strong sellSellNeutralBuyStrong buy
Displays a symbol's price movements over previous years to identify recurring trends.
Frequently Asked Questions
The current price of SRGGF is 0.8176 USD — it has increased by 46.00% in the past 24 hours. Watch SRG Global Ltd. stock price performance more closely on the chart.
Depending on the exchange, the stock ticker may vary. For instance, on OTC exchange SRG Global Ltd. stocks are traded under the ticker SRGGF.
We've gathered analysts' opinions on SRG Global Ltd. future price: according to them, SRGGF price has a max estimate of 2.38 USD and a min estimate of 2.10 USD. Watch SRGGF chart and read a more detailed SRG Global Ltd. stock forecast: see what analysts think of SRG Global Ltd. and suggest that you do with its stocks.
SRGGF reached its all-time high on Mar 10, 2025 with the price of 0.8176 USD, and its all-time low was 0.4547 USD and was reached on Jan 18, 2023. View more price dynamics on SRGGF chart.
See other stocks reaching their highest and lowest prices.
See other stocks reaching their highest and lowest prices.
SRGGF stock is 31.51% volatile and has beta coefficient of 1.12. Track SRG Global Ltd. stock price on the chart and check out the list of the most volatile stocks — is SRG Global Ltd. there?
Today SRG Global Ltd. has the market capitalization of 1.31 B, it has decreased by −5.60% over the last week.
Yes, you can track SRG Global Ltd. financials in yearly and quarterly reports right on TradingView.
SRG Global Ltd. is going to release the next earnings report on Feb 17, 2026. Keep track of upcoming events with our Earnings Calendar.
SRGGF earnings for the last half-year are 0.04 USD per share, whereas the estimation was 0.03 USD, resulting in a 8.65% surprise. The estimated earnings for the next half-year are 0.04 USD per share. See more details about SRG Global Ltd. earnings.
SRG Global Ltd. revenue for the last half-year amounts to 462.94 M USD, despite the estimated figure of 461.36 M USD. In the next half-year revenue is expected to reach 492.20 M USD.
SRGGF net income for the last half-year is 18.77 M USD, while the previous report showed 11.72 M USD of net income which accounts for 60.20% change. Track more SRG Global Ltd. financial stats to get the full picture.
SRG Global Ltd. dividend yield was 3.19% in 2025, and payout ratio reached 68.41%. The year before the numbers were 5.39% and 68.08% correspondingly. See high-dividend stocks and find more opportunities for your portfolio.
EBITDA measures a company's operating performance, its growth signifies an improvement in the efficiency of a company. SRG Global Ltd. EBITDA is 78.79 M USD, and current EBITDA margin is 8.98%. See more stats in SRG Global Ltd. financial statements.
Like other stocks, SRGGF shares are traded on stock exchanges, e.g. Nasdaq, Nyse, Euronext, and the easiest way to buy them is through an online stock broker. To do this, you need to open an account and follow a broker's procedures, then start trading. You can trade SRG Global Ltd. stock right from TradingView charts — choose your broker and connect to your account.