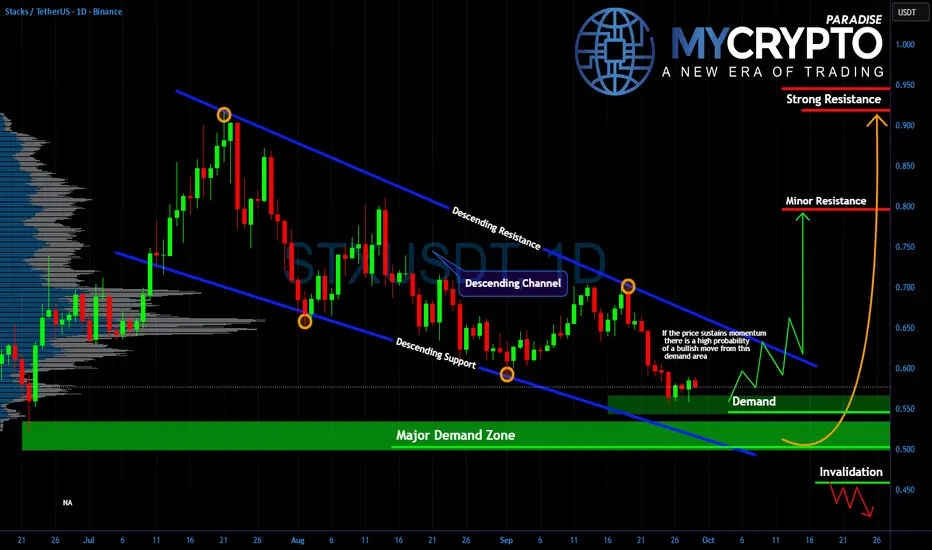
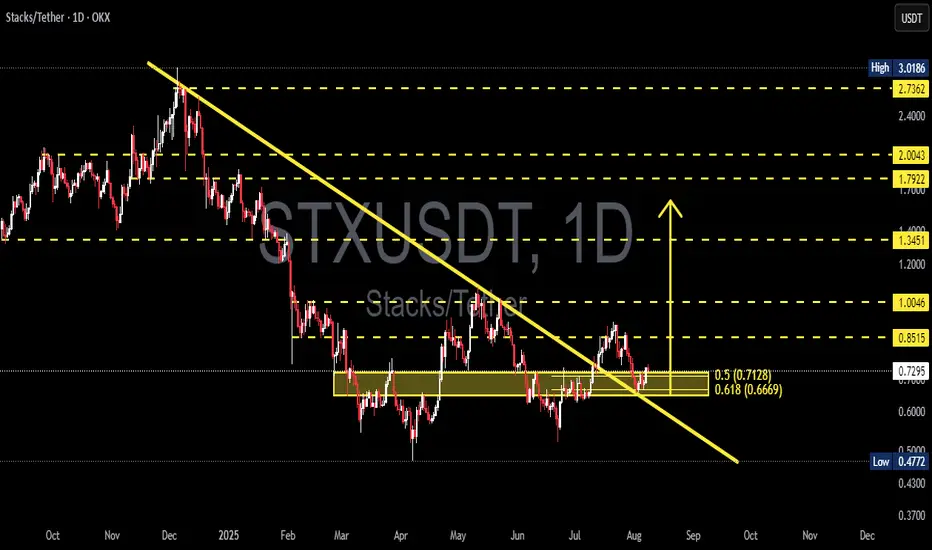
Is STX About to Explode or Collapse From This Demand Zone?Yello Paradisers, what if I told you that the next big move on STX could decide whether traders print money or get wiped out in days? The chart is painting a dangerous setup, and ignoring it could be costly.
💎#STXUSDT has been stuck in a clear descending channel, repeatedly rejecting from its resis
Related pairs
Is #STX Ready to Make an Explosive Bullish Move? Must Watch Yello Paradisers! Are we about to witness a powerful breakout of #STX, or is a trap lurking right under our feet? Let's decode this #STXUSDT setup before it’s too late:
💎#Stacks has been stuck in a clear falling wedge on the daily timeframe by consistently respecting both the descending resistance
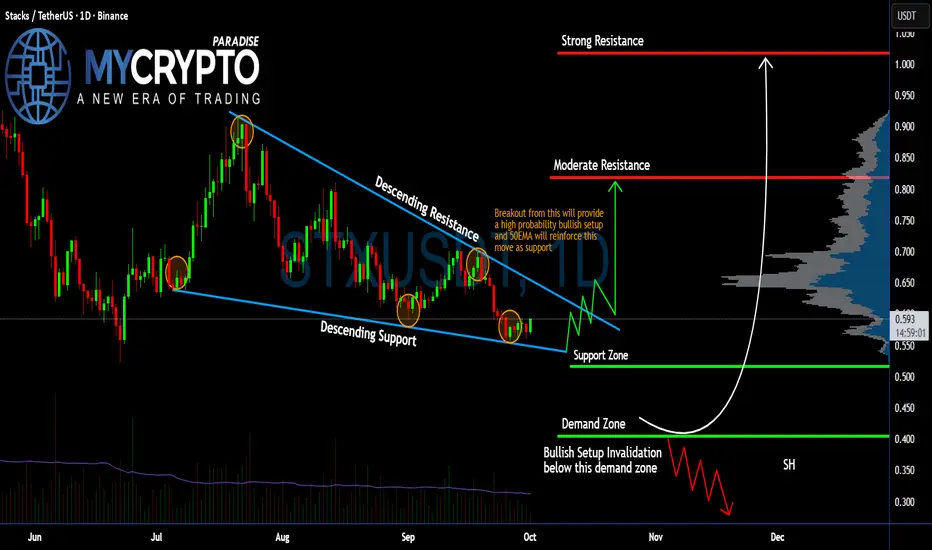
STX outlookSTX is on the bullish horizon I expect a bullish candle soon, as it breaks all the mini resistance
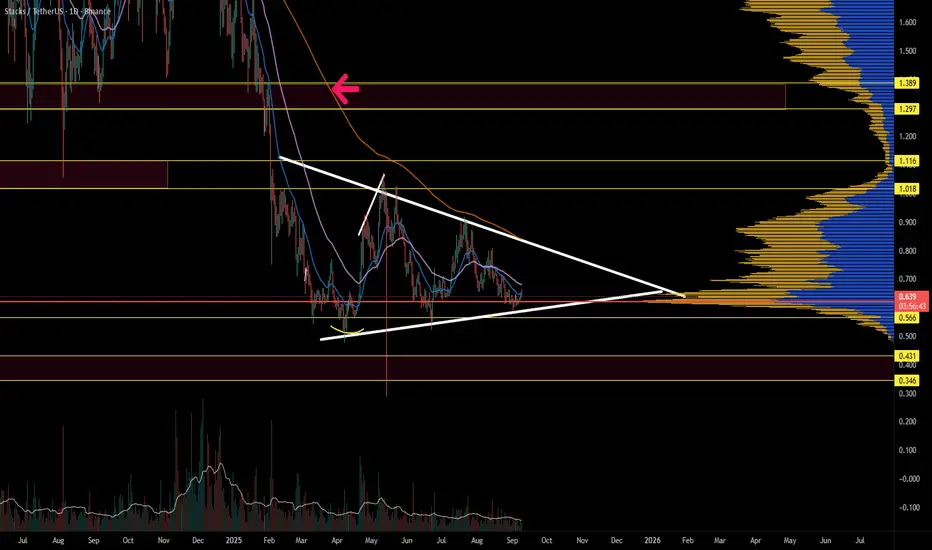
STX/USDT — Key Support Test, Break or Bounce?Stacks (STX/USDT) is currently sitting at a critical make-or-break zone that will define its medium- to long-term direction. On the weekly chart, price has returned to the historical demand zone at $0.42 – $0.58 (yellow box). This area has acted as a strong accumulation level multiple times before —

STX (SPOT)BINANCE:STXUSDT
#STX / USDT
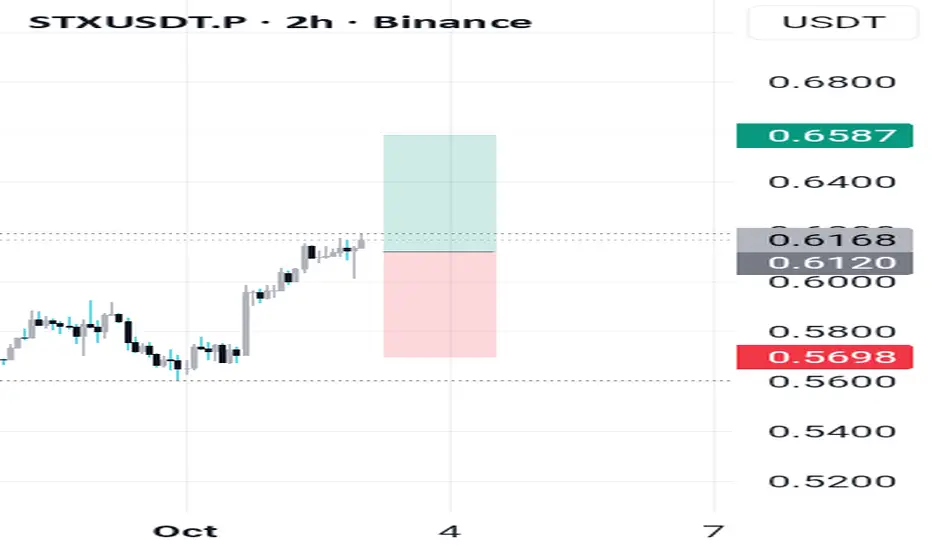
Entry range (0.650- 0.670)
SL 4H close below 0.630
T1 0.760
T2 0.840
T3 1.000
2 Extra Targets is optional 1.300 and 1.600
_______________________________________________________
Golden Advices.
********************
* collect the coin slowly in the entry range.
* P

STACKS is approaching a breakout momentSTX is consolidating nicely within a triangular formation as volume decreases; eventually, the price is expected to squeeze. The question is, in which direction? The fact is, such a structure has a high chance of continuation, but a swing failure could cause the price to shift up. DCA moment. NFA
STXlet see what will happen my expactation it is. it is doing w and high. there is idm level and below of it exist fvg and order block when you check daily and weekly you will see the level which i mention

Breakout Confirmed – Is STX/USDT Ready for a Trend Reversal?Technical Analysis – STX/USDT (Daily Timeframe)
STX/USDT has shown a significant technical breakout after successfully breaching the descending trendline that has acted as a dynamic resistance since early 2025.
Currently, price is retesting a key support zone, which was a former resistance level—i
Stacks · Major Flush Reveals End of Correction · New CycleStacks all-time high was hit April 2024. This ATH comes as a long-term double-top because it happened within the same November 2021 peak price range.
After a major wave there is always a correction. A correction can happen in any direction. If the trend is bearish, the correction is an up-move. If

$STX Stacks Bullish Continuation? 70% retracement from ATHNASDAQ:STX (Stacks) – Bigger Picture: Uptrend/Bullish Continuation
3-Day Timeframe
Current Price: $1.00
NASDAQ:STX has retraced over 70% from its all-time high of $3.80, indicating a deep correction phase that may now be reaching exhaustion.
If the price breaks out of this falling channel, whi

See all ideas
Summarizing what the indicators are suggesting.
Oscillators
Neutral
SellBuy
Strong sellStrong buy
Strong sellSellNeutralBuyStrong buy
Oscillators
Neutral
SellBuy
Strong sellStrong buy
Strong sellSellNeutralBuyStrong buy
Summary
Neutral
SellBuy
Strong sellStrong buy
Strong sellSellNeutralBuyStrong buy
Summary
Neutral
SellBuy
Strong sellStrong buy
Strong sellSellNeutralBuyStrong buy
Summary
Neutral
SellBuy
Strong sellStrong buy
Strong sellSellNeutralBuyStrong buy
Moving Averages
Neutral
SellBuy
Strong sellStrong buy
Strong sellSellNeutralBuyStrong buy
Moving Averages
Neutral
SellBuy
Strong sellStrong buy
Strong sellSellNeutralBuyStrong buy
Curated watchlists where STXUST is featured.

Smart contracts: Make the smart decision
36 No. of Symbols
See all sparks
Frequently Asked Questions
The current price of STX / UST (STX) is 0.60376000 USDT — it has fallen −4.26% in the past 24 hours. Try placing this info into the context by checking out what coins are also gaining and losing at the moment and seeing STX price chart.
STX / UST price has risen by 5.85% over the last week, its month performance shows a −4.01% decrease, and as for the last year, STX / UST has increased by 0.80%. See more dynamics on STX price chart.
Keep track of coins' changes with our Crypto Coins Heatmap.
Keep track of coins' changes with our Crypto Coins Heatmap.
STX / UST (STX) reached its highest price on May 11, 2025 — it amounted to 1.02250000 USDT. Find more insights on the STX price chart.
See the list of crypto gainers and choose what best fits your strategy.
See the list of crypto gainers and choose what best fits your strategy.
STX / UST (STX) reached the lowest price of 0.52639000 USDT on Jun 22, 2025. View more STX / UST dynamics on the price chart.
See the list of crypto losers to find unexpected opportunities.
See the list of crypto losers to find unexpected opportunities.
The safest choice when buying STX is to go to a well-known crypto exchange. Some of the popular names are Binance, Coinbase, Kraken. But you'll have to find a reliable broker and create an account first. You can trade STX right from TradingView charts — just choose a broker and connect to your account.
STX / UST (STX) is just as reliable as any other crypto asset — this corner of the world market is highly volatile. Today, for instance, STX / UST is estimated as 0.56% volatile. The only thing it means is that you must prepare and examine all available information before making a decision. And if you're not sure about STX / UST, you can find more inspiration in our curated watchlists.
You can discuss STX / UST (STX) with other users in our public chats, Minds or in the comments to Ideas.