SUI/USDT --> Two-Step Setup: Retest QML, Then RallyHello guys!
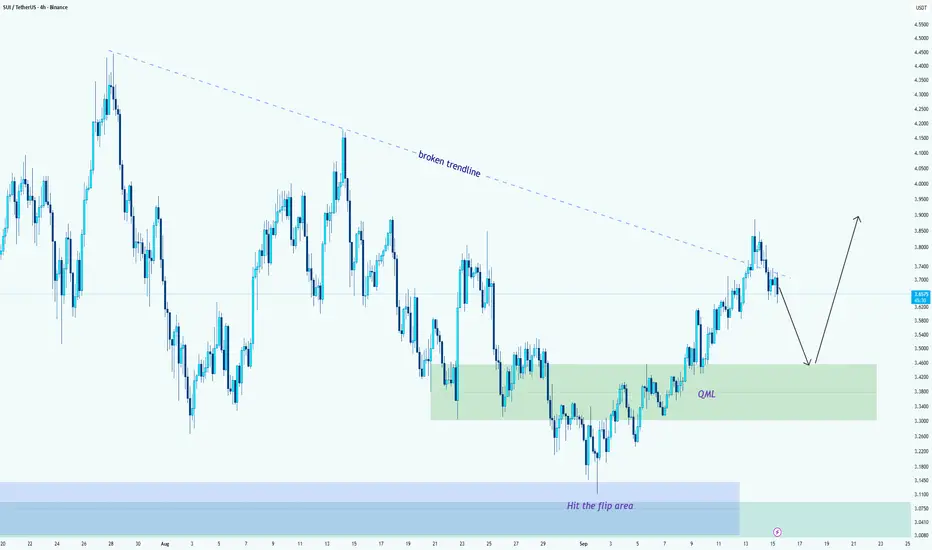
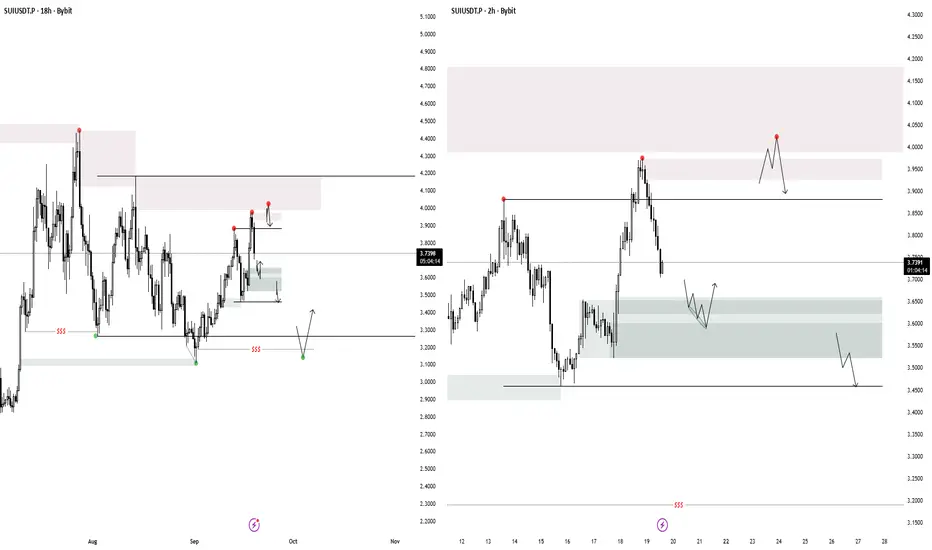
Short version first: I expect a pullback to the QML (3.30–3.45), then a bounce that resumes the upside toward 3.80–3.90 (and potentially higher if momentum continues).
Why this makes sense (the plan):
Step 1 --> Pullback to QML:
Price broke the long descending trendline and impulsed higher, but the move is showing a normal two-leg structure: first leg up, now a corrective leg down. The green QML box (3.30–3.45) is the nearby demand zone and the most logical place for buyers to re-enter.
Step 2 --> Bounce & continuation:
If the QML holds and we get a bullish rejection (pinbar, engulfing, clear wick rejection, or a nice bullish close), the most likely path is a continuation back toward the recent supply area — 3.80– 3.90 as the first meaningful resistance. If momentum keeps, extensions toward the next structural highs become possible.
Final note
This is a two-step game: first, the retest, then the real trade. Don’t chase the breakout now; patience at the QML will give a cleaner, higher-reward setup.
SUIUSDT.P trade ideas
The path ahead that we expect.Hello friends....
The cryptocurrency Sui has been one of the good cryptocurrencies in the market for the past 2 years, and the reason for this is that it is a viable project.
According to the news from the Federal Reserve last night, the future direction for this cryptocurrency could be as follows.
It is a good place to buy for a step, if it falls, you can buy more in the next steps, because in my opinion it is a cryptocurrency with high potential.
Until the upcoming Alt Season, I will try to share with you the cryptocurrencies that have the most potential for growth, so be sure to follow the page.
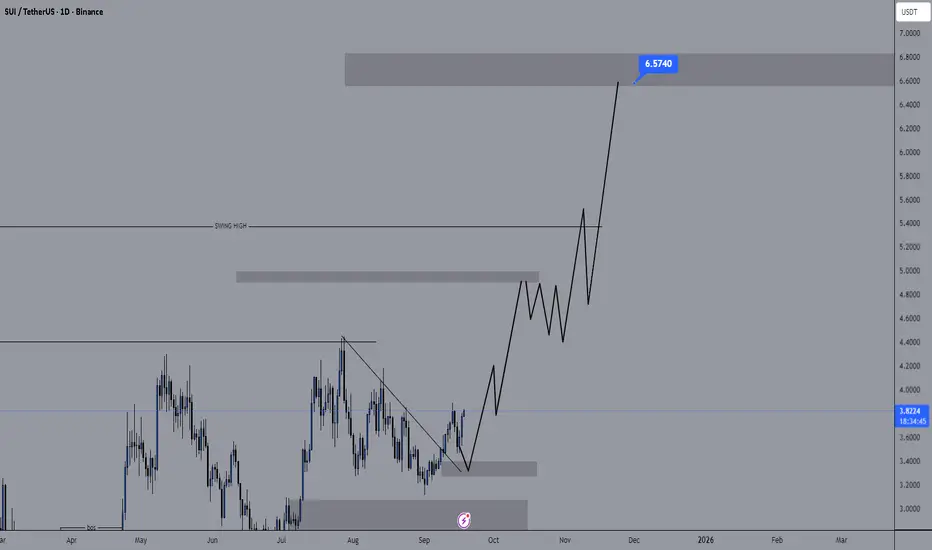
The key is whether it can rise above 3.9509
Hello, fellow traders.
Please "Follow" to always get the latest information quickly.
Have a great day.
-------------------------------------
(SUIUSDT 1D Chart)
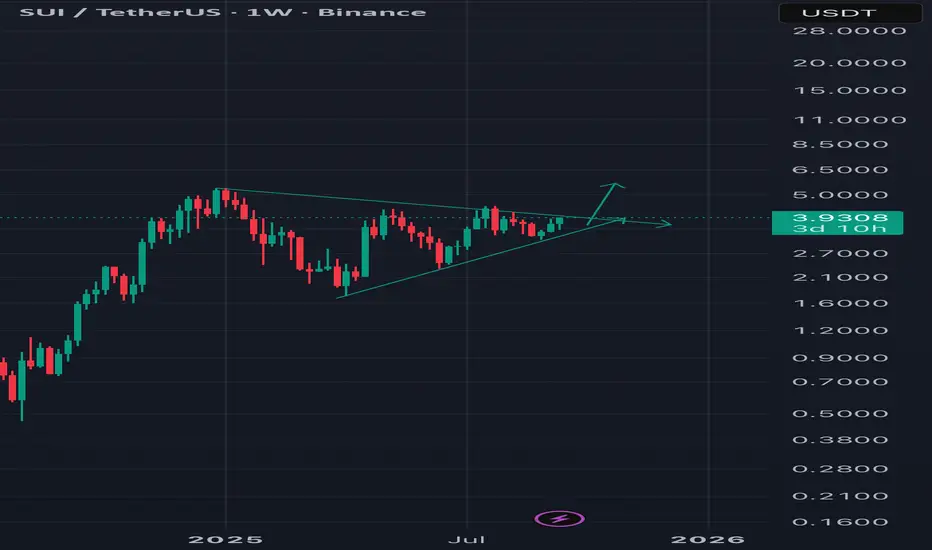
Since the HA-High ~ DOM (60) ranges on the 1W and 1D charts partially overlap, a breakout above the 3.9509-4.7328 range is expected to lead to a sharp rise.
Therefore, the 3.9509-4.7328 range is considered a resistance zone.
The HA-Low and HA-High indicators are converging as price movements move.
If this convergence occurs, the converged range, i.e., the HA-Low ~ HA-High range, can be considered a buy zone.
If the price falls below the 2.4495-2.8161 range, trading should be halted and the situation should be monitored.
Currently, the M-Signal indicator on the 1M chart is moving between 2.4495 and 2.8161. Therefore, if the price falls below this level, a stop loss should be considered and a response strategy should be developed.
Based on a basic trading strategy, a buy signal is signaled when support is found in the 2.4495-2.8161 range.
However, if the price falls below the M-Signal indicator on the 1M chart, a downtrend is likely, requiring a response strategy.
-
I mentioned the resistance range as 3.9509-4.7328. However, since the HA-High ~ DOM (60) range on the 1D chart is 3.9509-4.3260, a buy signal can be made when the price finds support within this range and rises.
However, since the buy signal is near the resistance level, a quick and short response is required.
The first sell range is 4.7328-4.96.
-
Thank you for reading to the end.
I wish you successful trading.
--------------------------------------------------

SUIUSDT.P SHORTSUIUSDT.P SHORT
The market has the potential for an downtrend to 200 MA
Price: 3.8 $
Main target 3.7441 $
SL 3.8919 $

SUI Game Plan - Suinetwork📊 Market Sentiment
Market sentiment remains strongly bullish as the FED is expected to deliver a 0.25% rate cut, with speculation building for a possible 0.5% cut in September. Monetary policy shifts are being driven by both inflation trends and weakening labor market data. The latest August and September job reports were soft, signaling that the economy is cooling rapidly. This environment continues to fuel expectations for a major bullish run in the weeks ahead.
📈 Technical Analysis
Price is on HTF bullish trend so we will be looking only long setups.
Price ran HTF liquidity and closed above then broke the market on daily-weekly timeframe, creating the Daily Demand Zone.
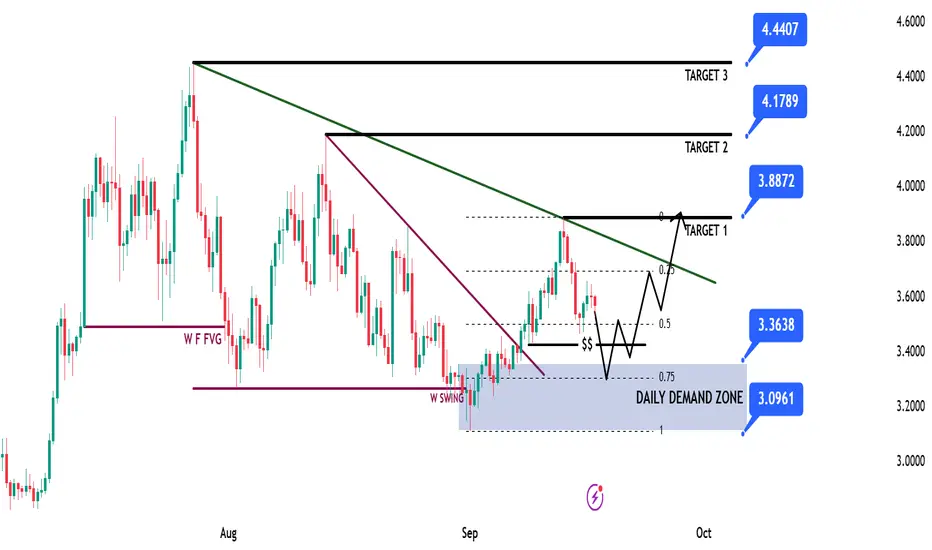
Moreover, price broke the bearish trendline and closed above, giving strong upward momentum. Now price is retracing back into the Daily Demand Zone.
📌 Game Plan
1-Price to hit back to Daily Demand Zone
2-Price to hit possibly 0.75 max discount range zone. If not, I’ll still enter with LTF confirmation.
🎯 Setup Trigger
4H break of structure after hitting 3.36$ level. I won’t enter unless I see the 4H BOS.
📋 Trade Management
Stoploss: Below 4H swing low responsible for BOS
Targets:
TP1: 3.88$
TP2: 4.17$
TP3: 4.44$
💬 Like, follow, and comment if you find this setup valuable!
⚠️ Disclaimer: This content is for informational and educational purposes only and does not constitute financial, investment, or trading advice. Always DYOR before making any financial decisions.
#SUI/USDT mid-term I believe this one will pump#SUI
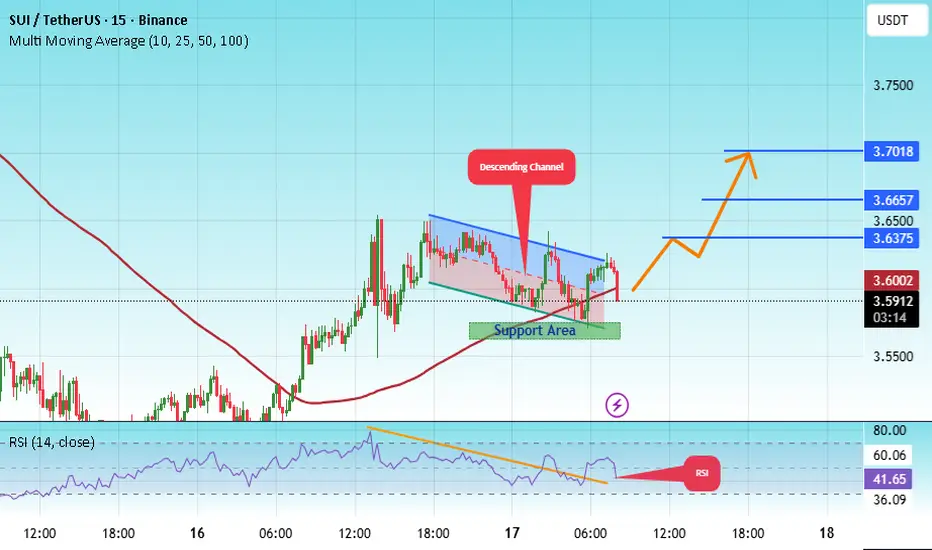
The price is moving in a descending channel on the 1-hour frame and is expected to break and continue upward.
We have a trend to stabilize above the 100 moving average once again.
We have a downtrend on the RSI indicator that supports the upward move with a breakout.
We have a major support area in green that pushed the price higher at 3.62.
Entry price: 3.70.
First target: 3.75.
Second target: 3.82.
Third target: 3.90.
To manage risk, don't forget stop loss and capital management.
When you reach the first target, save some profits and then change the stop order to an entry order.
For inquiries, please comment.
Thank you.

SuiusdSoon break to the upside . Alt coins ETFs getting approved alt season starts next I think sui goes re test all time high and possible higher before the run is over we will see if it breaks to the upside
#SUI/USDT bullish structure formed at the chart#SUI
The price is moving within a descending channel on the 1-hour frame, adhering well to it, and is heading for a strong breakout and retest.
We have a bearish trend on the RSI indicator that is about to be broken and retested, which supports the upward breakout.
There is a major support area in green at 3.56, representing a strong support point.
We are heading for consolidation above the 100 moving average.
Entry price: 3.60
First target: 3.64
Second target: 3.66
Third target: 3.70
Don't forget a simple matter: capital management.
When you reach the first target, save some money and then change your stop-loss order to an entry order.
For inquiries, please leave a comment.
Thank you.
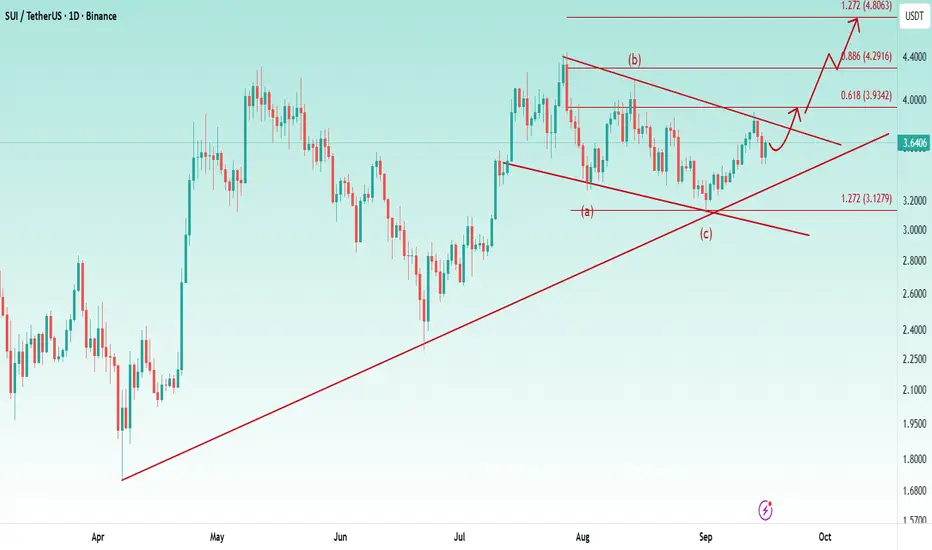
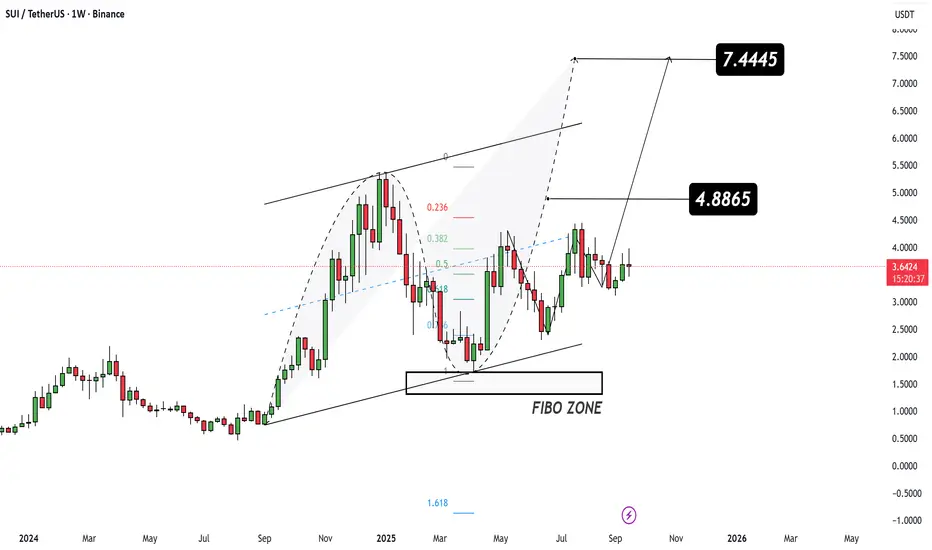
perfect bullish structure formed at the chart 👉 There is a strong bullish structure as the price has perfectly bounced from the 1.272% Fibonacci level and the trendline. A bullish flag is also forming on the chart, and I expect a breakout from this flag soon. Totally the structure is bullish for me
✅ Targets : 3.93$, 4.3$ And 4.8$
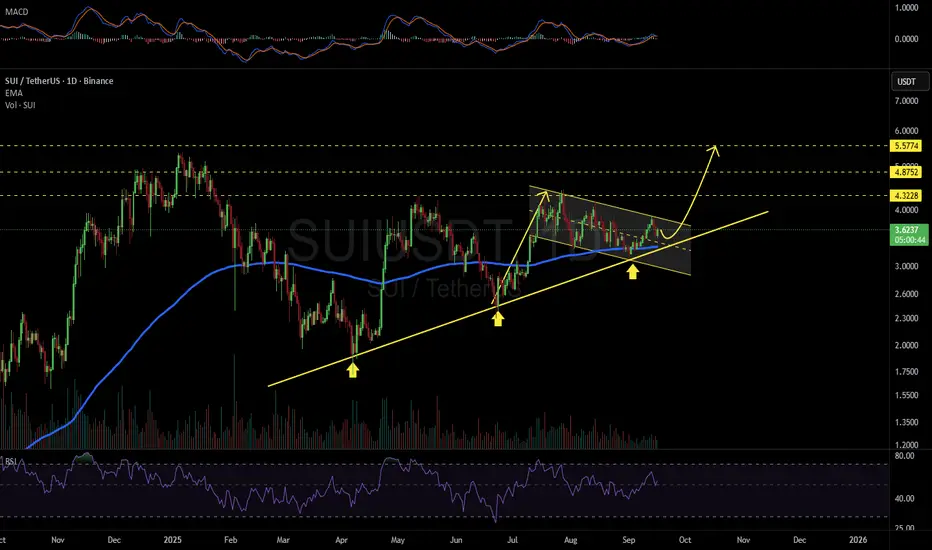
SUIUSDT 1D#SUI is moving within a bullish flag pattern on the daily chart and is currently holding above the flag’s midline and the daily EMA200. If it breaks out above the flag resistance, the potential targets are:
🎯 $4.3228
🎯 $4.8752
🎯 $5.5774
⚠️ Always remember to use a tight stop-loss and follow proper risk management.
SUI 19.09.25SUI is looking good for a potential distribution. If it can confirm a distribution model after mitigating the supply chain it could go down to the MTF accumulation POI's, since there is nothing but liquidity below.
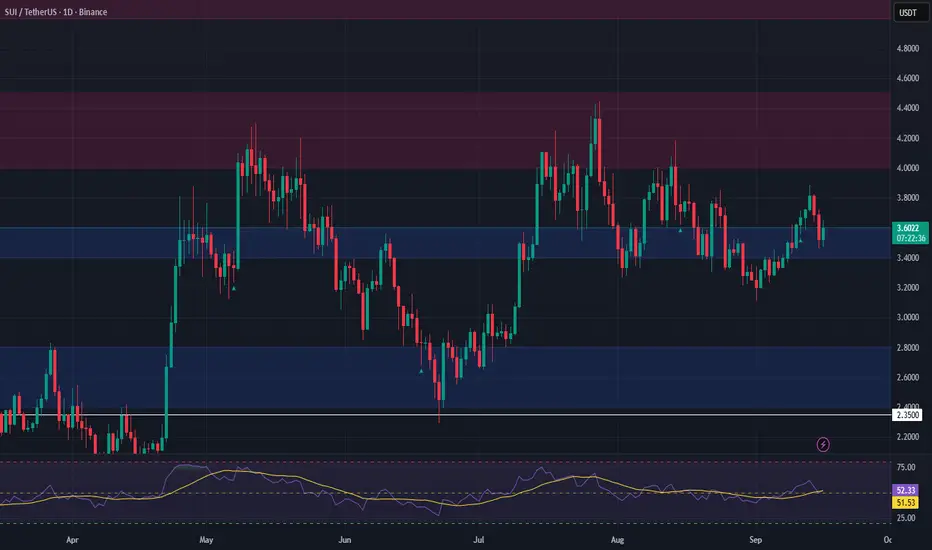
SUI Trade Setup – Bullish Structure Intact Amid VolatilitySUI continues to hold a bullish market structure despite increased volatility driven by macro headlines. Price action remains above the bull market support band, indicating strength and resilience. A notable confluence zone has formed between $2.40 and $2.80, where buyers previously stepped in aggressively.
This area is shaping up as a high-probability accumulation zone, especially if a liquidation wick drives price into it. A bounce from this range could initiate the next expansion leg upward.
🔹 Trade Setup
• Entry Zone: $2.40 – $2.80
• Take Profit Targets:
🥇 $3.40 – $3.60
🥈 $4.00 – $4.50
• Stop Loss: Daily close below $2.35
Double-digit SUI is only a matter of time#SUI Still deeply undervalued, aside from strong fundamentals we have bullish technical setup🔥
We’re seeing a local bullish pennant — its breakout will unfold a breakout of the bigger structure → which is 300 Days accumulation inside the Symmetrical Triangle💁♂️
In mid-term I believe this one will pump The chart pattern, combined with the project’s fundamentals and strong social-media sentiment, led me to give this cryptocurrency serious consideration.
I have found a good opinion about it in the midterm.

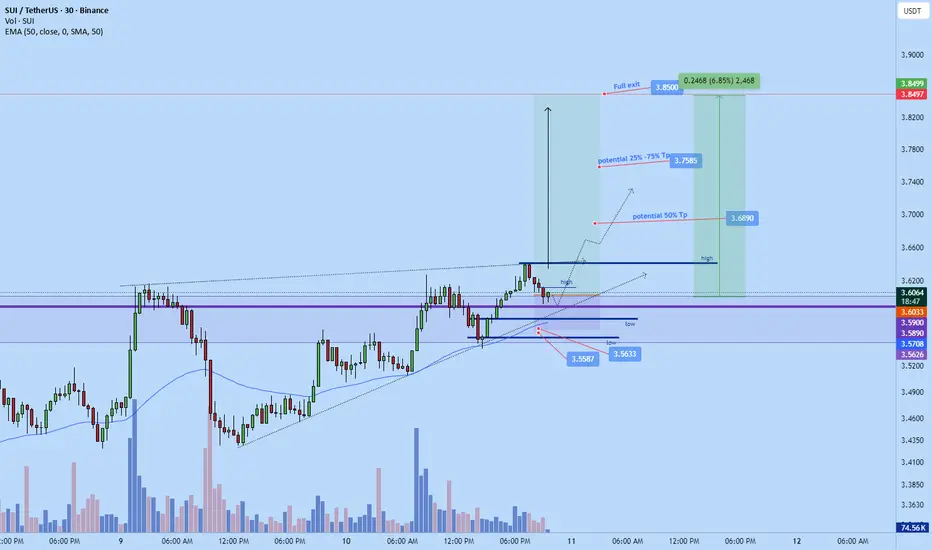
SUI BIG LONG NOW!!!URGENTJust took this sui long a while ago..Might not exactly be ready yet but soon. If we push its likely gonna fly aggressively to $3.85 area
sl: 3.5633 area - $3.5587 or lower . Ideally 3.5385 if conservative
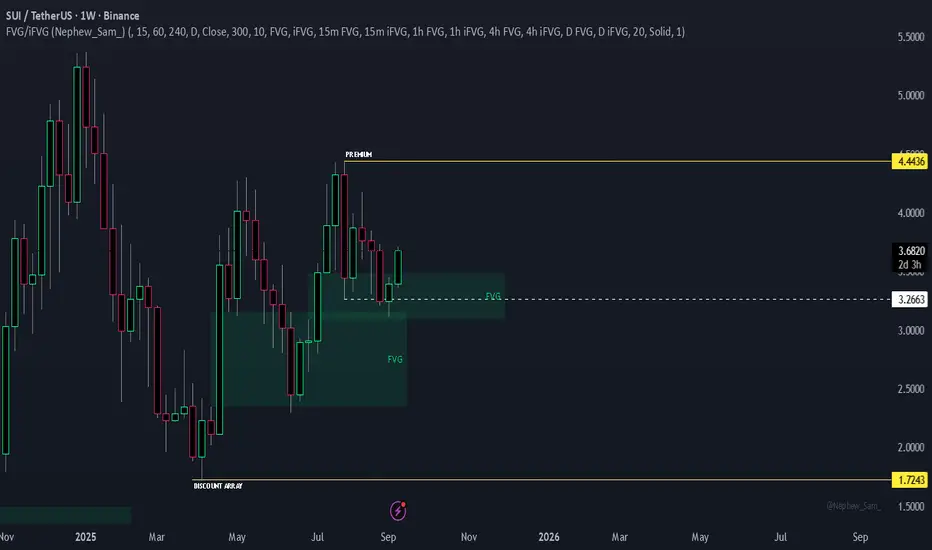
SUI/USDT WEEKLY DISCOUNT ARRAYDISCOUNT ARRAY
Price bounced off a WEEKLY FVG and seems to have found support.
Sweep of origin bar low confirms a possible liquidity grab.
Target PREMIUM.
🚩 Invalidation: You will need to manage your weekly trades on lower time-frames.
SUI Swing Long Opportunity - AltcoinSUI Swing Long Opportunity
📊 Market Sentiment
Market sentiment remains strongly bullish as the FED is expected to deliver a 0.25% rate cut, with speculation building for a possible 0.5% cut in September. Monetary policy shifts are being driven by both inflation trends and weakening labor market data. The latest August and September job reports were soft, signaling that the economy is cooling rapidly. This environment continues to fuel expectations for a major bullish run in the weeks ahead.
📈 Technical Analysis
Price ran the HTF liquidity and bounced from there.
Price tested the HTF key resistance level three times and was rejected, but today it finally broke and closed above the HTF key SR. I expect this level to hold.
Price also broke the bearish trendline that had been controlling the bearish trend since July 27th.
📌 Game Plan
I will be looking to build a long position when we retest the broken HTF Key Level at $3.44.
Possibly, price may also retest the broken trendline, but I won’t be relying on that scenario.
🎯 Setup Trigger
Retest of the broken HTF key level.
📋 Trade Management
Stoploss: $3.34 (below the HTF key level with 2 consecutive 4H candle closures)
Target:
TP: $3.71
💬 Like, follow, and comment if you find this setup valuable!
⚠️ Disclaimer: This content is for informational and educational purposes only and does not constitute financial, investment, or trading advice. Always do your own research before making any financial decisions.

Sui (SUI): Expecting 200% Market price Movement Very SoonSUI has a sleeper setup, which can give us potentially 200% of movement very, very soon. We are in a bullish trend so expecting a bounce from here.
More in-depth info is in the video—enjoy!
Swallow Academy

$sui long well playedCRYPTOCAP:SUI jumped exactly from our entry and good 17% profit if you entered long with leverage then congratulations for listening to my call.
Taking partial profits here.

DeGRAM | SUIUSD is aiming to retest support📊 Technical Analysis
● Price is holding above the rising support trendline and key horizontal support near $3.31, setting up a potential rebound.
● A sustained break above the descending resistance around $4.44 could pave the way for a run toward recent highs near $4.80–$5.00, aligned with the upper channel.
💡 Fundamental Analysis
● SUI’s DeFi ecosystem continues to surge—TVL has topped $2 billion, and institutional interest is growing (e.g., Mill City Ventures’ $450M accumulation and Robinhood listing).
✨ Summary
Long above $3.31; breakout above $4.44 targets $4.80 → $5.00. Invalidation below $3.31.
-------------------
Share your opinion in the comments and support the idea with a like. Thanks for your support!

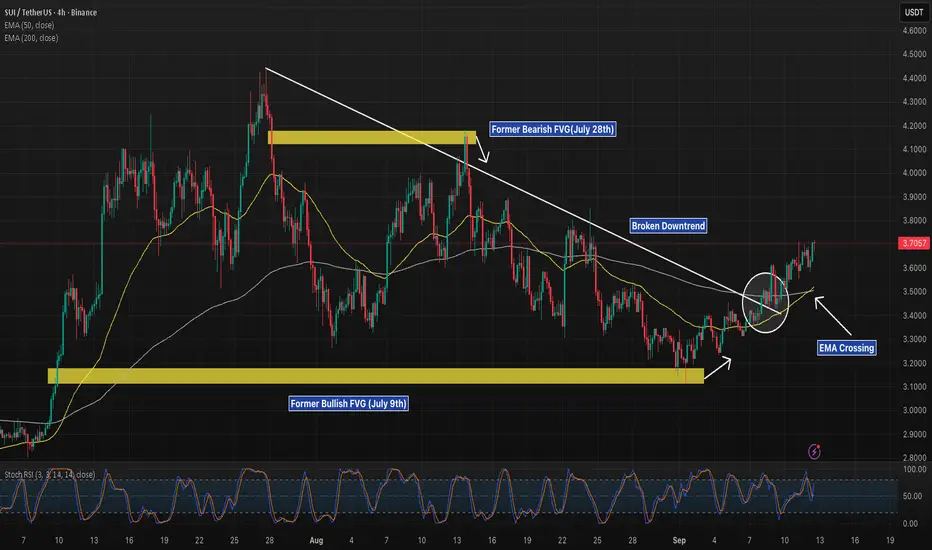
SUI 4H – EMA Cross Attempt After Trendline BreakSUI has broken out of its downtrend line and is now attempting an EMA cross, a potential signal for trend reversal strength.
Upside:
Holding above the EMA cross supports momentum continuation toward the next supply zone.
Confirmation of this cross could drive SUI into a stronger bullish leg.
Downside:
If the EMA cross fails, support lies near the $3.20 demand zone.
Below that, the deeper base of the demand box would be the key defense level.
📊 Key focus: Will the EMA cross confirm and fuel a stronger rally, or will price roll over into demand for a retest?
SUI | Watching for Key Resistance Flip — Long Setup BuildingDescription:
Sui (SUI) is shaping up for a potential bullish continuation, with price action currently hovering just below a critical resistance zone. A confirmed break and retest of this level could open the door for a strong upside move.
📍 Trade Setup:
Entry Zone: $3.40 – $3.60
Stop Loss: Just below $3.30
Take Profit Targets:
TP1: $4.00 – $4.20
TP2: $5.00 – $5.20
This setup is built around a support-to-resistance flip. If bulls can reclaim the overhead resistance and turn it into a base, it could confirm bullish momentum continuation.
#SUI #Crypto #Altcoins #SwingTrade #TechnicalAnalysis #TradingSetup

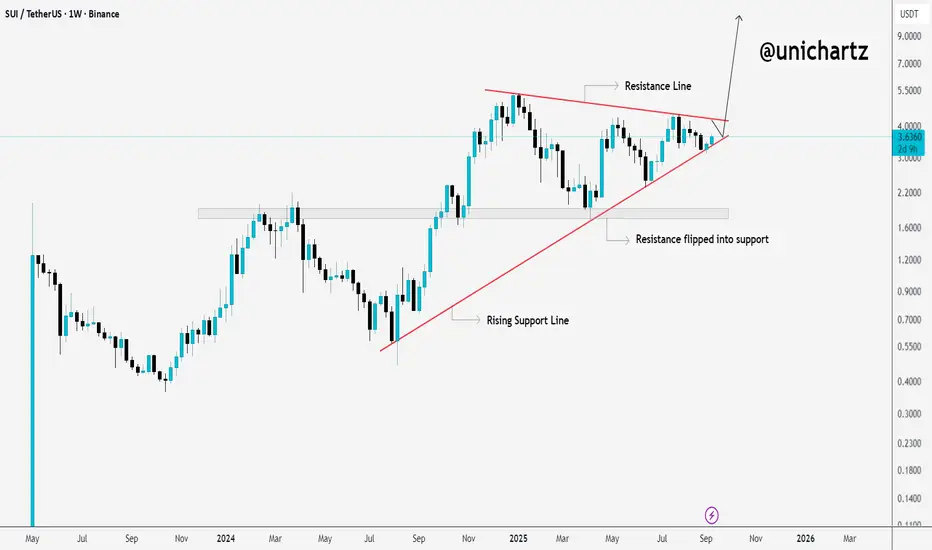
SUI at a Crossroads: Next Move Could Be HugeCRYPTOCAP:SUI has been moving inside a big triangle pattern, with rising support holding the lows and strong resistance capping the highs. Notice how the old resistance around $1.60 has already flipped into support, a healthy sign showing buyers are still in control.
Right now, SUI is sitting at the apex of the triangle. A breakout above resistance could open the door for a sharp move higher, while losing that rising support would mean buyers need to regroup at lower levels.
In simple terms: the squeeze is on, and whichever side breaks, momentum will likely follow fast.
DYOR, NFA
Stay updated everyday follow us on TradingView
#PEACE