AMZN — Earnings Base Case: Short-Term Correction Before Next LegAmazon reports earnings tomorrow, and expectations look well-balanced. Fundamentally, the base case suggests in-line results near guidance — roughly $177–$178B revenue and ~$18B operating income. AWS growth likely holds steady around 17–18% YoY, and Ads should remain strong but may decelerate slight
Key facts today
Next report date
—
Report period
—
EPS estimate
—
Revenue estimate
—
6.15 EUR
57.23 B EUR
616.25 B EUR
9.58 B
About Amazon.com, Inc.
Sector
Industry
CEO
Andrew R. Jassy
Website
Headquarters
Seattle
Founded
1994
ISIN
US0231351067
FIGI
BBG000BWBBZ1
Amazon.com, Inc. is a multinational technology company, which engages in the provision of online retail shopping services. It operates through the following segments: North America, International, and Amazon Web Services (AWS). The North America segment offers retail sale of consumer products, including from sellers, advertising, and subscriptions services through North America-focused online and physical stores. The International segment focuses on retail sale of consumer products, including from sellers, advertising, and subscription services through internationally-focused online stores. The AWS segment is composed of global sales of compute, storage, database, and other services for start-ups, enterprises, government agencies, and academic institutions. The company was founded by Jeffrey P. Bezos in July 1994 and is headquartered in Seattle, WA.
Related stocks

Stocks AmazonPDH/L Strategy with specific patterns that can give us an edge whjile fighting this war zone everyday.

Why Your Next Trade Means Nothing
🧠 The Notebook Process #2 — Understanding the True Nature of Trading.
Some laws govern everything we do, and trading is no exception, even if it often feels like pure chaos.
Every tick looks random. Every trade feels unique. Yet beneath that noise, a hidden law quietly shapes your results. It’

AMZN Poised for a Friday Momentum Play: (Oct. 24 Outlook)Will $223 Breakout Trigger a Squeeze Toward $227? 📦
1. Market Structure (1H & 15M)
Amazon’s current market structure shows controlled bullish accumulation following a textbook CHoCH-BOS rotation from the $215–$217 demand base. On the 1-hour chart, AMZN reclaimed structure with a decisive Break of

$AMZN is going to run up to earnings. Target #1 $134 then Target #2 $238 and could reach new ATH for earnings.

Amazon (AMZN): Ready for a New Breakout!Amazon isn’t just delivering packages — it’s delivering earnings surprises and a chart breakout too! 😎
After reporting strong Q3 earnings on 30 Oct 2025 , AMZN’s chart popped with a clean cup & handle breakout on 31 Oct 2025 — just in time for a bullish Halloween rally 🎃🐂
💰 Earnings Highligh

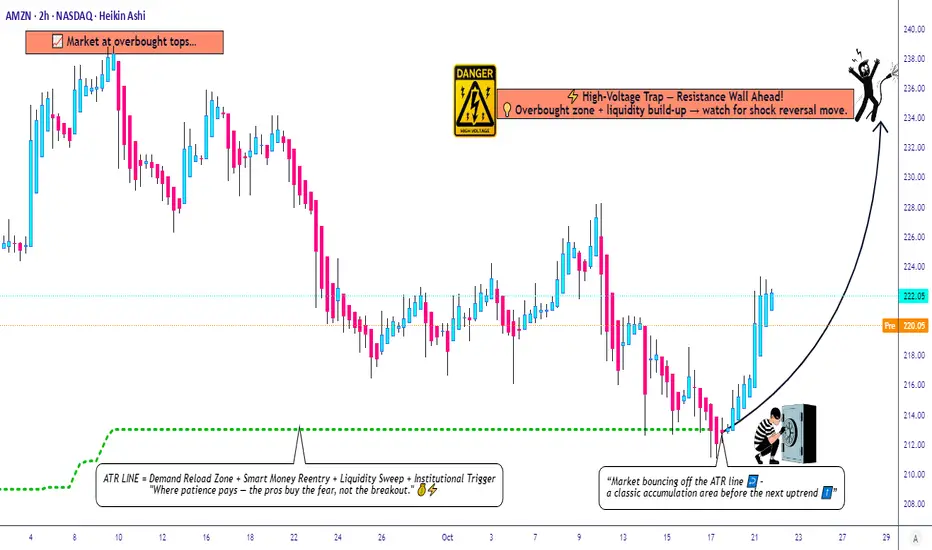
Amazon’s Hidden Pullback Opportunity – Smart Risk, Smart Entry🎯 AMZN: The "Thief's Playbook" — Stealing Profits Like a Wall Street Ninja
📊 Asset Overview
AMAZON.COM INC (NASDAQ: AMZN) — The E-Commerce Titan & Cloud King 👑
Strategy Type: Swing/Day Trade — Bullish Pullback Setup
Confirmation Tool: ATR (Average True Range) ✅
🎭 The "Thief Strategy" Explained
Lis
AMZN Break Out -- Bullish1HR time frame paints a good picture of what's to come in the short term...at least from my perspective.
AMZN finally broke through the sideways chop today with momentum and pushed to the 1.618 fib (from the closed peak of the last wave on 10/3 to the closed low on 10/6).
RSI showing momentum and

$AMZN💼 NASDAQ:AMZN Trading Review
I believe NASDAQ:AMZN is still a strong company. They control a significant share across multiple markets, from e‑commerce and cloud computing to logistics and advertising.
Looking at our charts, the RSI indicates that sellers aren’t willing to push below $220 many

AMAZONAMAZON has started the push up after the complete correction, let's see if it holds this upside momentum and breaks the top one more time.
Disclosure: We are part of Trade Nation's Influencer program and receive a monthly fee for using their TradingView charts in our analysis.

See all ideas
Summarizing what the indicators are suggesting.
Neutral
SellBuy
Strong sellStrong buy
Strong sellSellNeutralBuyStrong buy
Neutral
SellBuy
Strong sellStrong buy
Strong sellSellNeutralBuyStrong buy
Neutral
SellBuy
Strong sellStrong buy
Strong sellSellNeutralBuyStrong buy
An aggregate view of professional's ratings.
Neutral
SellBuy
Strong sellStrong buy
Strong sellSellNeutralBuyStrong buy
Neutral
SellBuy
Strong sellStrong buy
Strong sellSellNeutralBuyStrong buy
Neutral
SellBuy
Strong sellStrong buy
Strong sellSellNeutralBuyStrong buy
Displays a symbol's price movements over previous years to identify recurring trends.
US23135CC8
Amazon.com, Inc. 3.25% 12-MAY-2061Yield to maturity
5.38%
Maturity date
May 12, 2061
US23135CJ3
Amazon.com, Inc. 3.95% 13-APR-2052Yield to maturity
5.37%
Maturity date
Apr 13, 2052
US23135CK0
Amazon.com, Inc. 4.1% 13-APR-2062Yield to maturity
5.37%
Maturity date
Apr 13, 2062
AMZN5182959
Amazon.com, Inc. 3.1% 12-MAY-2051Yield to maturity
5.36%
Maturity date
May 12, 2051
AMZN4531868
Amazon.com, Inc. 4.25% 22-AUG-2057Yield to maturity
5.35%
Maturity date
Aug 22, 2057
US23135BT2
Amazon.com, Inc. 2.5% 03-JUN-2050Yield to maturity
5.35%
Maturity date
Jun 3, 2050
AMZN4531866
Amazon.com, Inc. 4.05% 22-AUG-2047Yield to maturity
5.30%
Maturity date
Aug 22, 2047
AMZN4996701
Amazon.com, Inc. 2.7% 03-JUN-2060Yield to maturity
5.30%
Maturity date
Jun 3, 2060
US23135AQ9
Amazon.com, Inc. 4.95% 05-DEC-2044Yield to maturity
5.10%
Maturity date
Dec 5, 2044
AMZN5182958
Amazon.com, Inc. 2.875% 12-MAY-2041Yield to maturity
5.07%
Maturity date
May 12, 2041
AMZN5508427
Amazon.com, Inc. 4.6% 01-DEC-2025Yield to maturity
4.80%
Maturity date
Dec 1, 2025
See all AMZ bonds
Curated watchlists where AMZ is featured.


Frequently Asked Questions
The current price of AMZ is 212.00 EUR — it has decreased by −1.17% in the past 24 hours. Watch Amazon.com, Inc. stock price performance more closely on the chart.
Depending on the exchange, the stock ticker may vary. For instance, on SWB exchange Amazon.com, Inc. stocks are traded under the ticker AMZ.
AMZ stock has risen by 11.41% compared to the previous week, the month change is a 14.31% rise, over the last year Amazon.com, Inc. has showed a 20.70% increase.
We've gathered analysts' opinions on Amazon.com, Inc. future price: according to them, AMZ price has a max estimate of 289.61 EUR and a min estimate of 207.48 EUR. Watch AMZ chart and read a more detailed Amazon.com, Inc. stock forecast: see what analysts think of Amazon.com, Inc. and suggest that you do with its stocks.
AMZ stock is 3.25% volatile and has beta coefficient of 1.31. Track Amazon.com, Inc. stock price on the chart and check out the list of the most volatile stocks — is Amazon.com, Inc. there?
Today Amazon.com, Inc. has the market capitalization of 2.25 T, it has increased by 3.35% over the last week.
Yes, you can track Amazon.com, Inc. financials in yearly and quarterly reports right on TradingView.
Amazon.com, Inc. is going to release the next earnings report on Jan 29, 2026. Keep track of upcoming events with our Earnings Calendar.
AMZ earnings for the last quarter are 1.66 EUR per share, whereas the estimation was 1.34 EUR resulting in a 24.34% surprise. The estimated earnings for the next quarter are 1.67 EUR per share. See more details about Amazon.com, Inc. earnings.
Amazon.com, Inc. revenue for the last quarter amounts to 153.54 B EUR, despite the estimated figure of 151.62 B EUR. In the next quarter, revenue is expected to reach 181.74 B EUR.
AMZ net income for the last quarter is 18.06 B EUR, while the quarter before that showed 15.42 B EUR of net income which accounts for 17.10% change. Track more Amazon.com, Inc. financial stats to get the full picture.
No, AMZ doesn't pay any dividends to its shareholders. But don't worry, we've prepared a list of high-dividend stocks for you.
As of Nov 2, 2025, the company has 1.56 M employees. See our rating of the largest employees — is Amazon.com, Inc. on this list?
EBITDA measures a company's operating performance, its growth signifies an improvement in the efficiency of a company. Amazon.com, Inc. EBITDA is 120.73 B EUR, and current EBITDA margin is 19.15%. See more stats in Amazon.com, Inc. financial statements.
Like other stocks, AMZ shares are traded on stock exchanges, e.g. Nasdaq, Nyse, Euronext, and the easiest way to buy them is through an online stock broker. To do this, you need to open an account and follow a broker's procedures, then start trading. You can trade Amazon.com, Inc. stock right from TradingView charts — choose your broker and connect to your account.
Investing in stocks requires a comprehensive research: you should carefully study all the available data, e.g. company's financials, related news, and its technical analysis. So Amazon.com, Inc. technincal analysis shows the buy rating today, and its 1 week rating is strong buy. Since market conditions are prone to changes, it's worth looking a bit further into the future — according to the 1 month rating Amazon.com, Inc. stock shows the buy signal. See more of Amazon.com, Inc. technicals for a more comprehensive analysis.
If you're still not sure, try looking for inspiration in our curated watchlists.
If you're still not sure, try looking for inspiration in our curated watchlists.