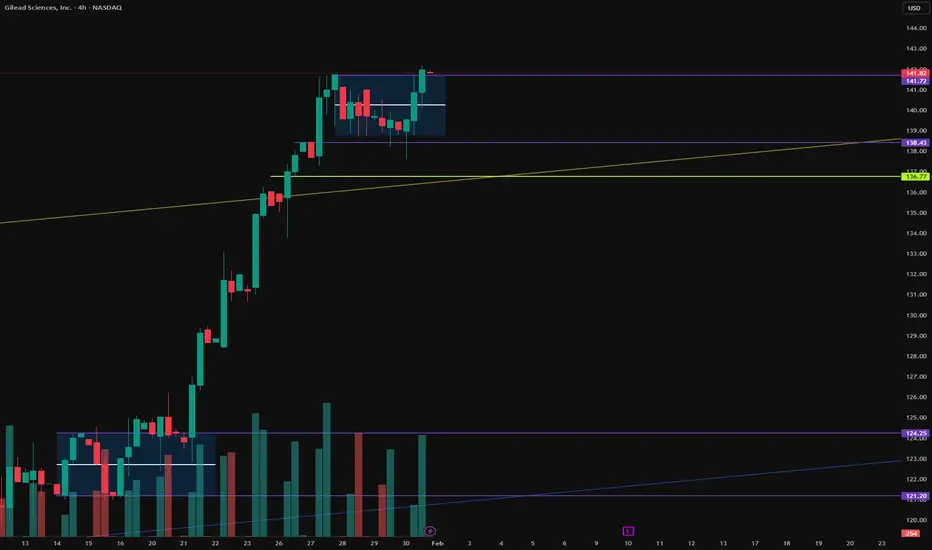
GILD PUT 20 FEB $132It is believed that GILD is running out of steam and will continue the trend of rising fast and dropping harder.
Ceiling (seller exist here ): 141.72
CB (Cost Basis): 140.28
Floor (Where buyers are): 138.48
(Note to self it has to break floor then retest to confirm the fall.)
Alert set for floor
Gilead Sciences, Inc.
No trades
Key facts today
Next report date
—
Report period
—
EPS estimate
—
Revenue estimate
—
5.82 EUR
7.25 B EUR
25.07 B EUR
1.24 B
About Gilead Sciences, Inc.
Sector
Industry
CEO
Daniel P. O'Day
Website
Headquarters
Foster City
Founded
1987
IPO date
Jan 22, 1992
Identifiers
3
ISIN US3755581036
Gilead Sciences, Inc. is a biopharmaceutical company, which engages in the research, development, and commercialization of medicines in areas of unmet medical need. The firm's primary areas of focus include human immunodeficiency virus, acquired immunodeficiency syndrome, liver diseases, hematology, oncology, and inflammation and respiratory diseases. It offers antiviral products under Harvoni, Genvoya, Epclusa, Truvada, Atripla, Descovy, Stribild, Viread, Odefsey, Complera/Eviplera, Sovaldi, and Vosevi brands. The company was founded by Michael L. Riordan on June 22, 1987 and is headquartered in Foster City, CA.
Related stocks
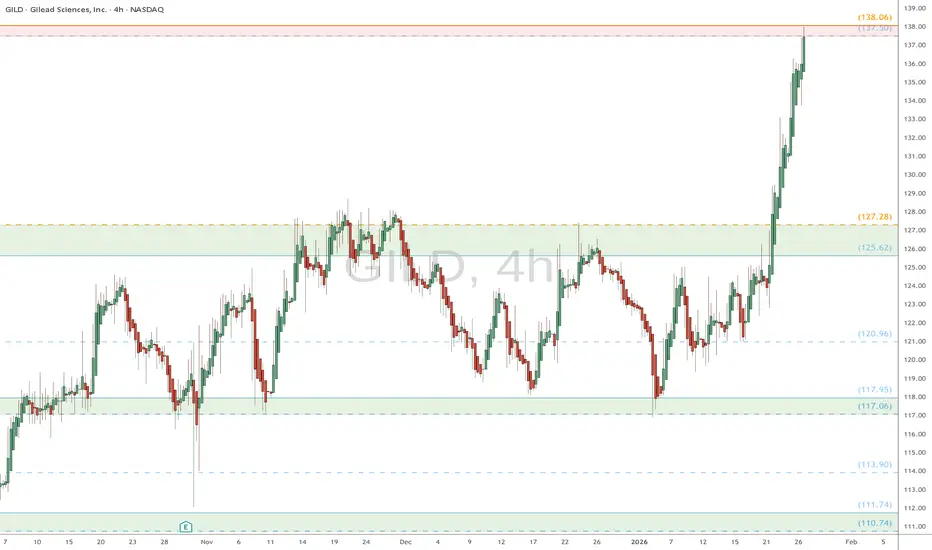
GILD watch $138: Golden Genesis zone that should give us a DIP GILD has been surging along with the pharma sector.
Just this a Major Resistance zone at $137.50-138.06
Looking for a Dip-to-Fib or Break-n-Retest for longs.
.
Previous Analysis that caught a PERFECT DIP:
Hit BOOST and FOLLOW for more such PRECISE and TIMELY charts.
=============================
Gilead Sciences — Durable HIV Cash Engine, Expanding OncologyMarket Overview
Gilead NASDAQ:GILD is a leading biopharma with a durable HIV franchise and a scaling oncology portfolio. Biktarvy (U.S. exclusivity to 2036) underpins predictable cash flows to fund growth in oncology and inflammation.
Key Catalysts
HIV Leadership: Biktarvy’s longevity funds pipe

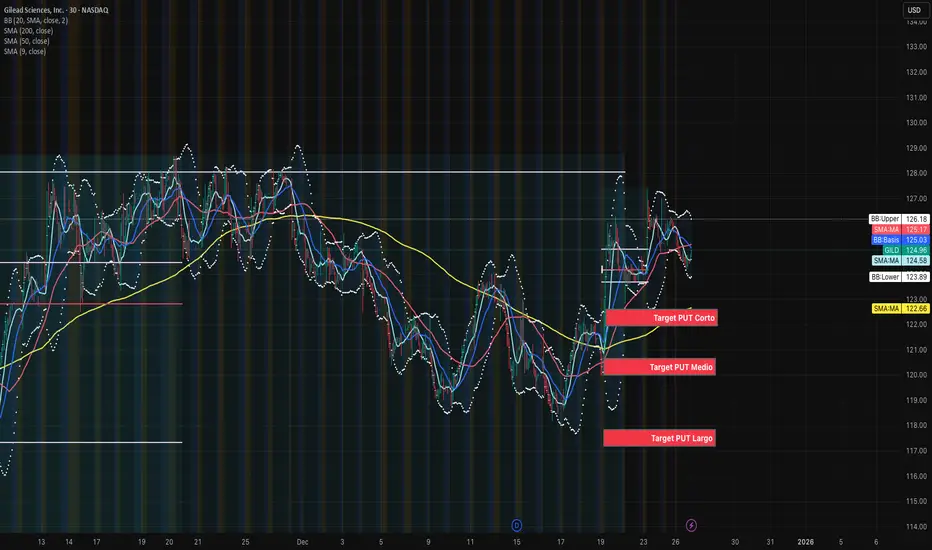
GILD - Estrategia de PUT's para la semana.Gilead Sciences is rising, but technically needs to close a gap before reaching 130.
PUT Strike 123, January 9
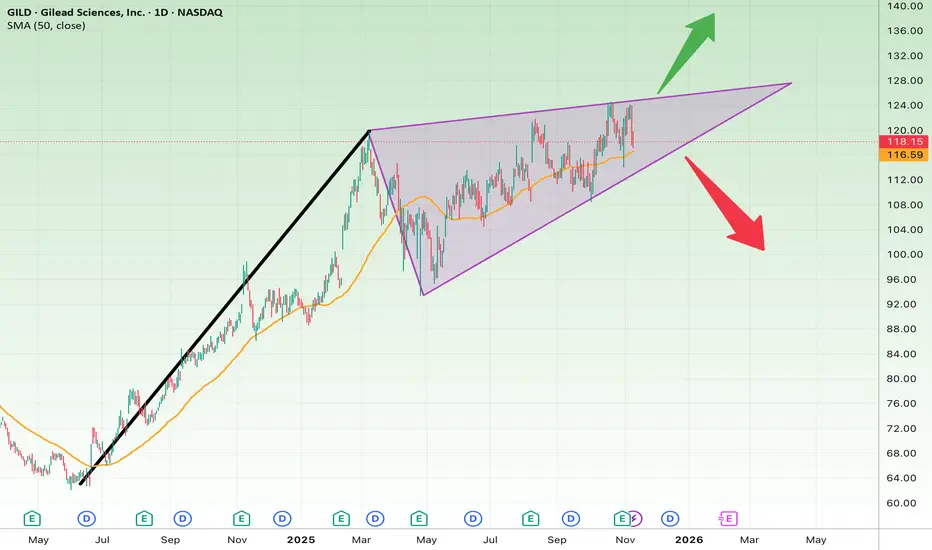
GILD Technical Analysis – Daily TimeframeAfter a strong bullish impulse, GILD has entered a consolidation/corrective phase and is currently trading inside a rising wedge pattern.
Price is hovering near the lower boundary of the wedge and the 50-day SMA, making this area a key decision zone.
Bullish Scenario
If price holds support and br

Parallel channelWith my little analysis I do, the parallel channel for the most part has been very promising to me. Looks great on this one as well

$GILD Tradespoon – Neutral Entry $127.51Tradespoon model shows a neutral signal for $ NASDAQ:GILD . Predicted range: $125.13–$128.02. Trend: –0.37%. NASDAQ:GILD
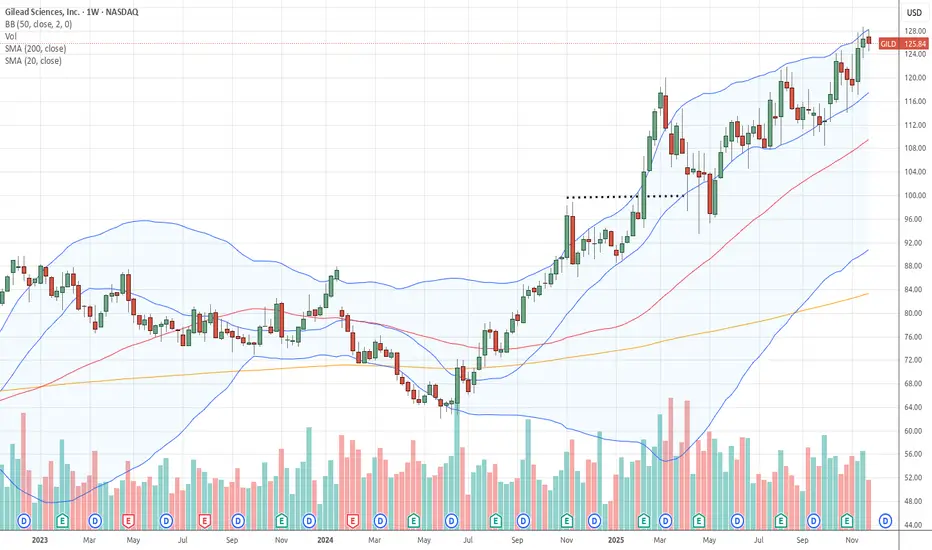
Tight Triangle Formation — GILD Ready for a BreakoutOn the daily chart, GILD is forming an ascending triangle, a bullish continuation pattern that often precedes a breakout move. The stock has rallied from around $75 to $125 and is now consolidating within a tightening range.
The 50-day SMA (around $114) is providing dynamic support.
Short-Term Vie
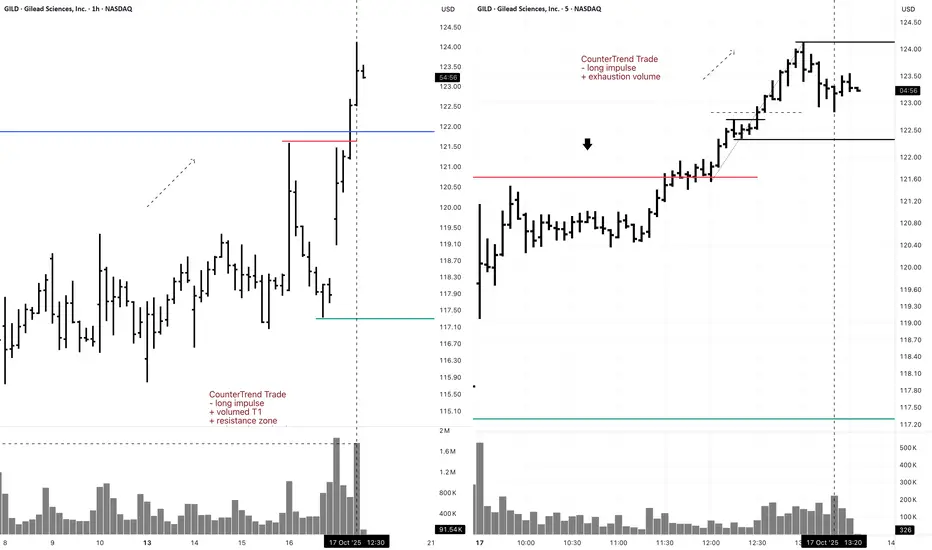
GILD 5M Short CounterTrend Daytrade (Buy Put to Open)5M CounterTrend Trade
- long impulse
+ exhaustion volume
1H CounterTrend
"- long impulse
+ volumed T1
+ resistance zone
+ volumed reaction bar"
1D CounterTrend
"- long impulse
- unvolumed T1
+ resistance level
+ volumed manipulation bar "
1M CounterTrend
"- long impulse
+ volumed T1 level
+ resis
GILD - Leading to the top =======
Volume
=======
- increasing
==========
Price Action
==========
- rounding bottom recently
=================
Technical Indicators
=================
- Ichimoku
>>> price above cloud
>>> Green kumo budding
>>> Tenken + Chiku - above clouds and pointing up
>>> Kijun - Above clouds and po

See all ideas
Summarizing what the indicators are suggesting.
Neutral
SellBuy
Strong sellStrong buy
Strong sellSellNeutralBuyStrong buy
Neutral
SellBuy
Strong sellStrong buy
Strong sellSellNeutralBuyStrong buy
Neutral
SellBuy
Strong sellStrong buy
Strong sellSellNeutralBuyStrong buy
An aggregate view of professional's ratings.
Neutral
SellBuy
Strong sellStrong buy
Strong sellSellNeutralBuyStrong buy
Neutral
SellBuy
Strong sellStrong buy
Strong sellSellNeutralBuyStrong buy
Neutral
SellBuy
Strong sellStrong buy
Strong sellSellNeutralBuyStrong buy
Displays a symbol's price movements over previous years to identify recurring trends.
US375558BF9
Gilead Sciences, Inc. 3.65% 01-MAR-2026Yield to maturity
7.60%
Maturity date
Mar 1, 2026
GILD5939386
Gilead Sciences, Inc. 5.6% 15-NOV-2064Yield to maturity
5.65%
Maturity date
Nov 15, 2064
GILD5939385
Gilead Sciences, Inc. 5.5% 15-NOV-2054Yield to maturity
5.58%
Maturity date
Nov 15, 2054
GILD5648609
Gilead Sciences, Inc. 5.55% 15-OCT-2053Yield to maturity
5.57%
Maturity date
Oct 15, 2053
US375558BK8
Gilead Sciences, Inc. 4.15% 01-MAR-2047Yield to maturity
5.51%
Maturity date
Mar 1, 2047
GISE
Gilead Sciences, Inc. 4.75% 01-MAR-2046Yield to maturity
5.50%
Maturity date
Mar 1, 2046
GILD5050849
Gilead Sciences, Inc. 2.8% 01-OCT-2050Yield to maturity
5.49%
Maturity date
Oct 1, 2050
GISA
Gilead Sciences, Inc. 4.5% 01-FEB-2045Yield to maturity
5.47%
Maturity date
Feb 1, 2045
US375558AX11
Gilead Sciences, Inc. 4.8% 01-APR-2044Yield to maturity
5.46%
Maturity date
Apr 1, 2044
US375558AS26
Gilead Sciences, Inc. 5.65% 01-DEC-2041Yield to maturity
5.27%
Maturity date
Dec 1, 2041
US375558BS1
Gilead Sciences, Inc. 2.6% 01-OCT-2040Yield to maturity
5.17%
Maturity date
Oct 1, 2040
See all GIS bonds
Frequently Asked Questions
The current price of GIS is 131.40 EUR — it has decreased by −1.05% in the past 24 hours. Watch Gilead Sciences, Inc. stock price performance more closely on the chart.
Depending on the exchange, the stock ticker may vary. For instance, on SWB exchange Gilead Sciences, Inc. stocks are traded under the ticker GIS.
GIS stock has risen by 5.04% compared to the previous week, the month change is a 23.77% rise, over the last year Gilead Sciences, Inc. has showed a 36.82% increase.
We've gathered analysts' opinions on Gilead Sciences, Inc. future price: according to them, GIS price has a max estimate of 149.12 EUR and a min estimate of 99.42 EUR. Watch GIS chart and read a more detailed Gilead Sciences, Inc. stock forecast: see what analysts think of Gilead Sciences, Inc. and suggest that you do with its stocks.
GIS stock is 1.06% volatile and has beta coefficient of 0.17. Track Gilead Sciences, Inc. stock price on the chart and check out the list of the most volatile stocks — is Gilead Sciences, Inc. there?
Today Gilead Sciences, Inc. has the market capitalization of 162.85 B, it has increased by 4.99% over the last week.
Yes, you can track Gilead Sciences, Inc. financials in yearly and quarterly reports right on TradingView.
Gilead Sciences, Inc. is going to release the next earnings report on Apr 23, 2026. Keep track of upcoming events with our Earnings Calendar.
GIS earnings for the last quarter are 1.58 EUR per share, whereas the estimation was 1.54 EUR resulting in a 2.76% surprise. The estimated earnings for the next quarter are 1.59 EUR per share. See more details about Gilead Sciences, Inc. earnings.
Gilead Sciences, Inc. revenue for the last quarter amounts to 6.75 B EUR, despite the estimated figure of 6.55 B EUR. In the next quarter, revenue is expected to reach 5.83 B EUR.
GIS net income for the last quarter is 1.86 B EUR, while the quarter before that showed 2.60 B EUR of net income which accounts for −28.54% change. Track more Gilead Sciences, Inc. financial stats to get the full picture.
Yes, GIS dividends are paid quarterly. The last dividend per share was 0.67 EUR. As of today, Dividend Yield (TTM)% is 2.03%. Tracking Gilead Sciences, Inc. dividends might help you take more informed decisions.
Gilead Sciences, Inc. dividend yield was 2.57% in 2025, and payout ratio reached 46.61%. The year before the numbers were 3.33% and 805.23% correspondingly. See high-dividend stocks and find more opportunities for your portfolio.
Like other stocks, GIS shares are traded on stock exchanges, e.g. Nasdaq, Nyse, Euronext, and the easiest way to buy them is through an online stock broker. To do this, you need to open an account and follow a broker's procedures, then start trading. You can trade Gilead Sciences, Inc. stock right from TradingView charts — choose your broker and connect to your account.
Investing in stocks requires a comprehensive research: you should carefully study all the available data, e.g. company's financials, related news, and its technical analysis. So Gilead Sciences, Inc. technincal analysis shows the buy rating today, and its 1 week rating is strong buy. Since market conditions are prone to changes, it's worth looking a bit further into the future — according to the 1 month rating Gilead Sciences, Inc. stock shows the strong buy signal. See more of Gilead Sciences, Inc. technicals for a more comprehensive analysis.
If you're still not sure, try looking for inspiration in our curated watchlists.
If you're still not sure, try looking for inspiration in our curated watchlists.