HII Long Trade – Warship of a Breakout! “Not all battles are fo⚓🛳️ 🌊⚔️📈
NYSE:HII – the builder of America’s most powerful warships – just breached a technical triangle like a submarine breaching the surface 🚢🔺
Is this just a chart pattern… or is it the start of a geopolitical move? 🤫
When the world is on edge, maritime defense matters more than ever.
📌 Tr
Next report date
—
Report period
—
EPS estimate
—
Revenue estimate
—
11.35 EUR
531.29 M EUR
11.14 B EUR
38.89 M
About Huntington Ingalls Industries, Inc.
Sector
Industry
CEO
Christopher D. Kastner
Website
Headquarters
Newport News
Founded
2010
ISIN
US4464131063
FIGI
BBG004PD5J35
Huntington Ingalls Industries, Inc. engages in the shipbuilding business. It operates through the following business segments: Ingalls, Newport News, and Mission Technologies. The Ingalls segment designs and constructs non-nuclear ships, including amphibious assault ships, expeditionary warfare ships, surface combatants, and national security cutters (NSC). The Newport News segment designs and builds nuclear-powered aircraft carriers and submarines, and the refueling and overhaul and the inactivation of nuclear-powered aircraft carriers. The Mission Technologies segment includes business groups focused on high-end information technology (IT) and mission-based solutions for DoD, intelligence, and federal civilian customers, life-cycle sustainment services to the U.S. Navy fleet and other maritime customers, unmanned, autonomous systems, and nuclear management and operations and environmental management services for the Department of Energy (DoE), DoD, state and local governments, and private sector companies. The company was founded on August 4, 2010 and is headquartered in Newport News, VA.
Related stocks

$HII Earnings Beat and Breakout ContinuationI have been long this name since April 17th. I held through earnings as it has been a slow but steady gainer.
Revenue did fall about 2% YOY. However, this is a good candidate for the new ship building initiative.
If you like this idea, please make it your own and be sure to follow "your" rules of

$HII - Shipbuilding - gap fill idea.Looking for a continuation and gap fill on $HII. Trump admin looking to return shipbuilding to the US. Strong curling of MACD/RSI. Pretty simple thesis.

$HII for a 90%+ profit.RSI is in the buy zone. P/E and P/B are in a beautiful buy range too. Sell at the red line.

Bad earnings, catalyst delay, and TA RESET.All indicators point in one direction as the stock continues to fall after the initial good catalyst but has been marred by more bad news, with stochastic heading down and other indicators now also pointing in the direction of a bearish move, support areas remain key.

Missa da Requiem ~MiserereWeekly Chart, so this May take a while.
but it will be worth it!
Short, at $255ish, Cover $219 or Lower. Juice with some PUTS, Lemon, ice gently Shaken, not Stirred
yippee Ki-yay... Hombres
A planet of playthings, we dance on the strings of powers we cannot perceive

$HII Long-Term HoldWe will likely see short-term declines for HII but long-term, the stock looks primed to do well over the next 3-5 years. I'd buy in around $200.

Huntington Ingalls: Cup with Handle with 89% Upside PotentialHII is a Shipbuilder US Defense Contractor that has formed a Cup with Handle Pattern with MACD Hidden Bullish Divergence, and it is currently breaking free from the handle and will soon challenge the Cup's Horizontal Resistance. If it breaks out, HII could nearly double up in value all the way to $4

Huntington Ingalls (HII) Wins $347M Deal to Aid Lionfish ProgramHuntington Ingalls Industries Inc.’s HII Mission Technologies segment recently secured a contract to develop nine small unmanned undersea vehicles (“SUUV”) for the U.S. Navy’s Lionfish System program. The program is used to conduct intelligence gathering for expeditionary marine countermeasure missi

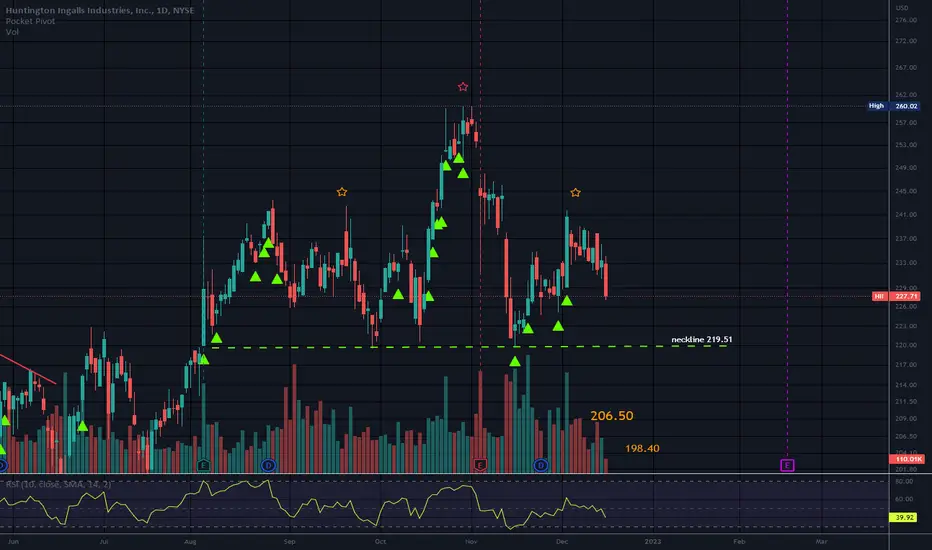
Head and ShouldersPrice is above the neckline which is strong support until broken.
ES would be a break of the neckline with a downtrend.
No recommendation.
“One minute of patience, ten years of peace.”
Huntington Ingalls Industries, Inc. engages in designing, building, overhauling, and repairing military ships i
See all ideas
An aggregate view of professional's ratings.
Neutral
SellBuy
Strong sellStrong buy
Strong sellSellNeutralBuyStrong buy
Neutral
SellBuy
Strong sellStrong buy
Strong sellSellNeutralBuyStrong buy
Neutral
SellBuy
Strong sellStrong buy
Strong sellSellNeutralBuyStrong buy
Displays a symbol's price movements over previous years to identify recurring trends.
HII5939588
Huntington Ingalls Industries, Inc. 5.749% 15-JAN-2035Yield to maturity
4.98%
Maturity date
Jan 15, 2035
HII5939587
Huntington Ingalls Industries, Inc. 5.353% 15-JAN-2030Yield to maturity
4.46%
Maturity date
Jan 15, 2030
HII5088072
Huntington Ingalls Industries, Inc. 4.2% 01-MAY-2030Yield to maturity
4.43%
Maturity date
May 1, 2030
HII5444418
Huntington Ingalls Industries, Inc. 2.043% 16-AUG-2028Yield to maturity
4.23%
Maturity date
Aug 16, 2028
HII4636809
Huntington Ingalls Industries, Inc. 3.483% 01-DEC-2027Yield to maturity
3.75%
Maturity date
Dec 1, 2027
HII5237290
Huntington Ingalls Industries, Inc. 2.043% 16-AUG-2028Yield to maturity
—
Maturity date
Aug 16, 2028
See all HI4 bonds
Frequently Asked Questions
Depending on the exchange, the stock ticker may vary. For instance, on SWB exchange Huntington Ingalls Industries, Inc. stocks are traded under the ticker HI4.
We've gathered analysts' opinions on Huntington Ingalls Industries, Inc. future price: according to them, HI4 price has a max estimate of 277.68 EUR and a min estimate of 198.10 EUR. Watch HI4 chart and read a more detailed Huntington Ingalls Industries, Inc. stock forecast: see what analysts think of Huntington Ingalls Industries, Inc. and suggest that you do with its stocks.
Yes, you can track Huntington Ingalls Industries, Inc. financials in yearly and quarterly reports right on TradingView.
Huntington Ingalls Industries, Inc. is going to release the next earnings report on Oct 30, 2025. Keep track of upcoming events with our Earnings Calendar.
HI4 earnings for the last quarter are 3.28 EUR per share, whereas the estimation was 2.78 EUR resulting in a 17.74% surprise. The estimated earnings for the next quarter are 2.83 EUR per share. See more details about Huntington Ingalls Industries, Inc. earnings.
Huntington Ingalls Industries, Inc. revenue for the last quarter amounts to 2.62 B EUR, despite the estimated figure of 2.48 B EUR. In the next quarter, revenue is expected to reach 2.53 B EUR.
HI4 net income for the last quarter is 129.03 M EUR, while the quarter before that showed 137.73 M EUR of net income which accounts for −6.31% change. Track more Huntington Ingalls Industries, Inc. financial stats to get the full picture.
Yes, HI4 dividends are paid quarterly. The last dividend per share was 1.16 EUR. As of today, Dividend Yield (TTM)% is 1.91%. Tracking Huntington Ingalls Industries, Inc. dividends might help you take more informed decisions.
Huntington Ingalls Industries, Inc. dividend yield was 2.78% in 2024, and payout ratio reached 37.61%. The year before the numbers were 1.93% and 29.41% correspondingly. See high-dividend stocks and find more opportunities for your portfolio.
As of Oct 4, 2025, the company has 44 K employees. See our rating of the largest employees — is Huntington Ingalls Industries, Inc. on this list?
EBITDA measures a company's operating performance, its growth signifies an improvement in the efficiency of a company. Huntington Ingalls Industries, Inc. EBITDA is 668.09 M EUR, and current EBITDA margin is 6.96%. See more stats in Huntington Ingalls Industries, Inc. financial statements.
Like other stocks, HI4 shares are traded on stock exchanges, e.g. Nasdaq, Nyse, Euronext, and the easiest way to buy them is through an online stock broker. To do this, you need to open an account and follow a broker's procedures, then start trading. You can trade Huntington Ingalls Industries, Inc. stock right from TradingView charts — choose your broker and connect to your account.