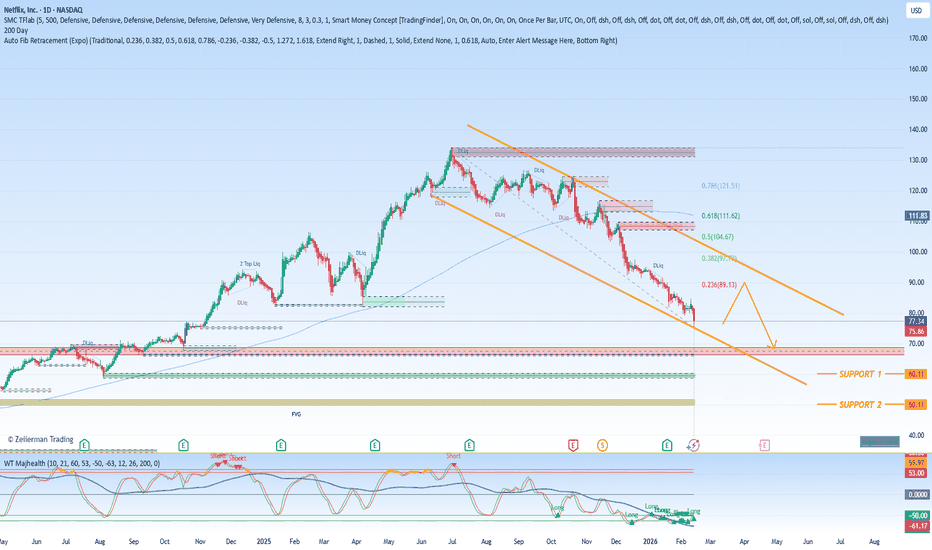
Netflix - Finally approaching support!🎥Netlix ( NASDAQ:NFLX ) will soon reverse higher:
🔎Analysis summary:
The recent -40% correction on Netflix was totally expected. But slowly, Netflix is approaching a major confluence of support at the previous all time high. If we see a final -15% drop, Netflix can then reverse towards the up
Netflix, Inc.
No trades
Next report date
—
Report period
—
EPS estimate
—
Revenue estimate
—
2.20 EUR
9.35 B EUR
38.55 B EUR
4.20 B
About Netflix, Inc.
Sector
Industry
Website
Headquarters
Los Gatos
Founded
1997
IPO date
May 23, 2002
Identifiers
3
ISIN US64110L1061
Netflix, Inc. engages in providing entertainment services. It also offers activities for leisure time, entertainment video, video gaming, and other sources of entertainment. It operates through the United States and International geographic segments. The company was founded by Marc Randolph and Wilmot Reed Hastings on August 29, 1997 and is headquartered in Los Gatos, CA.
Related stocks
Netflix ($NFLX) — odds are becoming favorable for a reversal.Netflix ( NASDAQ:NFLX ) — odds are becoming favorable for a reversal.
Why:👇
A small base is forming near the 2025 lows.
The extended downtrend is becoming increasingly unsustainable.
The $100 big round number often acts as a long-term magnet.
The entry was shared earlier today with members. I’l
Easy Buy on Netflix - Breakout of Ascending Channel !Netflix is currently down almost 50% from its all time high in Nov 2021.
Currently traded in an ascending channel since Oct 2022 and briefly broke out above with strong volume to close at 357.42 as of market close.
Now we look for some profit taking and pullback to retest the top of the channel
B
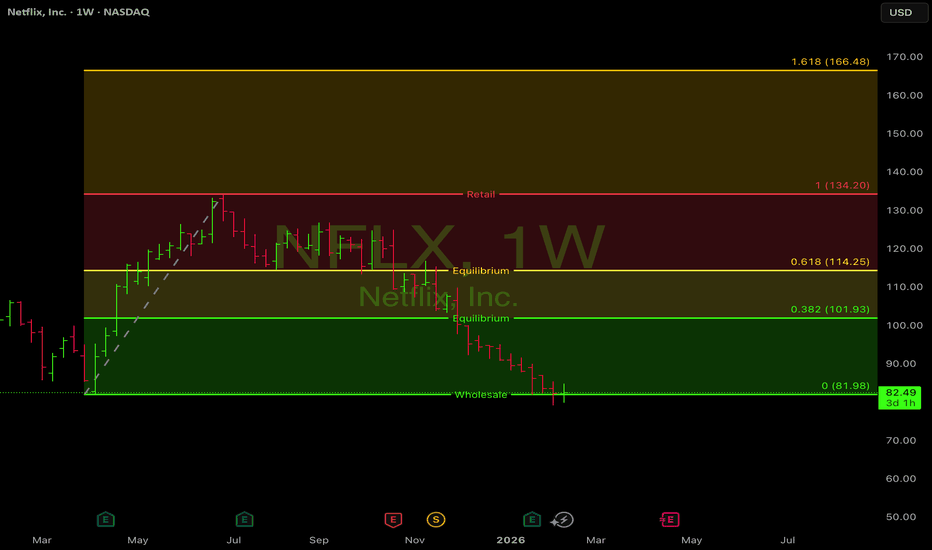
$NFLX Discounted Prices!!!!NFLX is back in the **wholesale zone 82.56–98.75** after rejecting the **retail/supply band ~115–135**.
If price reclaims **98.75**, the path opens back toward prior supply.
If it loses **82.56**, the market is signaling lower before higher.
Education only, not advice. Patience pays when risk is d
Netflix at a Major Channel SupportMarket Structure
• Price has been moving inside a long-term ascending channel
• Recently:
• Strong rejection from channel top
• Sharp corrective move
• Current price is testing the lower channel boundary + key horizontal support
➡️ Decision zone
Key Levels
• Major Support: 80 – 78
• Ne
Three Reasons to Buy the Streaming Leader at a DiscountNetflix Inc. finds itself in an unusual position. The company remains the undisputed global leader in subscription streaming, commands nearly 325 million paid memberships, and continues to generate double-digit revenue growth. Yet its stock has been conspicuously out of favor. Over the past 12 month
Slight Bullish Divergence...?NFLX - Still in a downtrend until its not, but on most TF's were seeing candles made a lower low and the RSI & MACD not following, making a little bullish divergence (yellow dotted lines). Are we finally seeing support respected or another fakeout, time will tell. Already down +50% from recent highs
See all ideas
Summarizing what the indicators are suggesting.
Neutral
SellBuy
Strong sellStrong buy
Strong sellSellNeutralBuyStrong buy
Neutral
SellBuy
Strong sellStrong buy
Strong sellSellNeutralBuyStrong buy
Neutral
SellBuy
Strong sellStrong buy
Strong sellSellNeutralBuyStrong buy
An aggregate view of professional's ratings.
Neutral
SellBuy
Strong sellStrong buy
Strong sellSellNeutralBuyStrong buy
Neutral
SellBuy
Strong sellStrong buy
Strong sellSellNeutralBuyStrong buy
Neutral
SellBuy
Strong sellStrong buy
Strong sellSellNeutralBuyStrong buy
Displays a symbol's price movements over previous years to identify recurring trends.
NFLX5862368
Netflix, Inc. 5.4% 15-AUG-2054Yield to maturity
5.57%
Maturity date
Aug 15, 2054
NFLX5862367
Netflix, Inc. 4.9% 15-AUG-2034Yield to maturity
4.58%
Maturity date
Aug 15, 2034
NFLX4901374
Netflix, Inc. 4.875% 15-JUN-2030Yield to maturity
4.23%
Maturity date
Jun 15, 2030
USU74079AN1
Netflix, Inc. 5.375% 15-NOV-2029Yield to maturity
4.11%
Maturity date
Nov 15, 2029
NFLX4908613
Netflix, Inc. 6.375% 15-MAY-2029Yield to maturity
3.99%
Maturity date
May 15, 2029
NFCD
Netflix, Inc. 4.375% 15-NOV-2026Yield to maturity
3.94%
Maturity date
Nov 15, 2026
NFLX4826528
Netflix, Inc. 5.875% 15-NOV-2028Yield to maturity
3.88%
Maturity date
Nov 15, 2028
NFLX4764899
Netflix, Inc. 4.875% 15-APR-2028Yield to maturity
3.80%
Maturity date
Apr 15, 2028
XS198938050
Netflix, Inc. 3.875% 15-NOV-2029Yield to maturity
3.30%
Maturity date
Nov 15, 2029
XS207282979
Netflix, Inc. 3.625% 15-JUN-2030Yield to maturity
2.92%
Maturity date
Jun 15, 2030
XS198938017
Netflix, Inc. 3.875% 15-NOV-2029Yield to maturity
2.85%
Maturity date
Nov 15, 2029
See all NFC bonds
Frequently Asked Questions
The current price of NFC is 64.71 EUR — it has increased by 1.24% in the past 24 hours. Watch Netflix, Inc. stock price performance more closely on the chart.
Depending on the exchange, the stock ticker may vary. For instance, on SWB exchange Netflix, Inc. stocks are traded under the ticker NFC.
NFC stock has fallen by −5.63% compared to the previous week, the month change is a −17.05% fall, over the last year Netflix, Inc. has showed a −34.42% decrease.
We've gathered analysts' opinions on Netflix, Inc. future price: according to them, NFC price has a max estimate of 127.29 EUR and a min estimate of 67.26 EUR. Watch NFC chart and read a more detailed Netflix, Inc. stock forecast: see what analysts think of Netflix, Inc. and suggest that you do with its stocks.
NFC stock is 1.85% volatile and has beta coefficient of 1.04. Track Netflix, Inc. stock price on the chart and check out the list of the most volatile stocks — is Netflix, Inc. there?
Today Netflix, Inc. has the market capitalization of 269.84 B, it has increased by 1.08% over the last week.
Yes, you can track Netflix, Inc. financials in yearly and quarterly reports right on TradingView.
Netflix, Inc. is going to release the next earnings report on Apr 21, 2026. Keep track of upcoming events with our Earnings Calendar.
NFC earnings for the last quarter are 0.48 EUR per share, whereas the estimation was 0.47 EUR resulting in a 1.41% surprise. The estimated earnings for the next quarter are 0.64 EUR per share. See more details about Netflix, Inc. earnings.
Netflix, Inc. revenue for the last quarter amounts to 10.26 B EUR, despite the estimated figure of 10.19 B EUR. In the next quarter, revenue is expected to reach 10.26 B EUR.
NFC net income for the last quarter is 2.06 B EUR, while the quarter before that showed 2.17 B EUR of net income which accounts for −5.13% change. Track more Netflix, Inc. financial stats to get the full picture.
No, NFC doesn't pay any dividends to its shareholders. But don't worry, we've prepared a list of high-dividend stocks for you.
As of Feb 14, 2026, the company has 16 K employees. See our rating of the largest employees — is Netflix, Inc. on this list?
EBITDA measures a company's operating performance, its growth signifies an improvement in the efficiency of a company. Netflix, Inc. EBITDA is 25.69 B EUR, and current EBITDA margin is 66.65%. See more stats in Netflix, Inc. financial statements.
Like other stocks, NFC shares are traded on stock exchanges, e.g. Nasdaq, Nyse, Euronext, and the easiest way to buy them is through an online stock broker. To do this, you need to open an account and follow a broker's procedures, then start trading. You can trade Netflix, Inc. stock right from TradingView charts — choose your broker and connect to your account.
Investing in stocks requires a comprehensive research: you should carefully study all the available data, e.g. company's financials, related news, and its technical analysis. So Netflix, Inc. technincal analysis shows the strong sell today, and its 1 week rating is sell. Since market conditions are prone to changes, it's worth looking a bit further into the future — according to the 1 month rating Netflix, Inc. stock shows the sell signal. See more of Netflix, Inc. technicals for a more comprehensive analysis.
If you're still not sure, try looking for inspiration in our curated watchlists.
If you're still not sure, try looking for inspiration in our curated watchlists.


