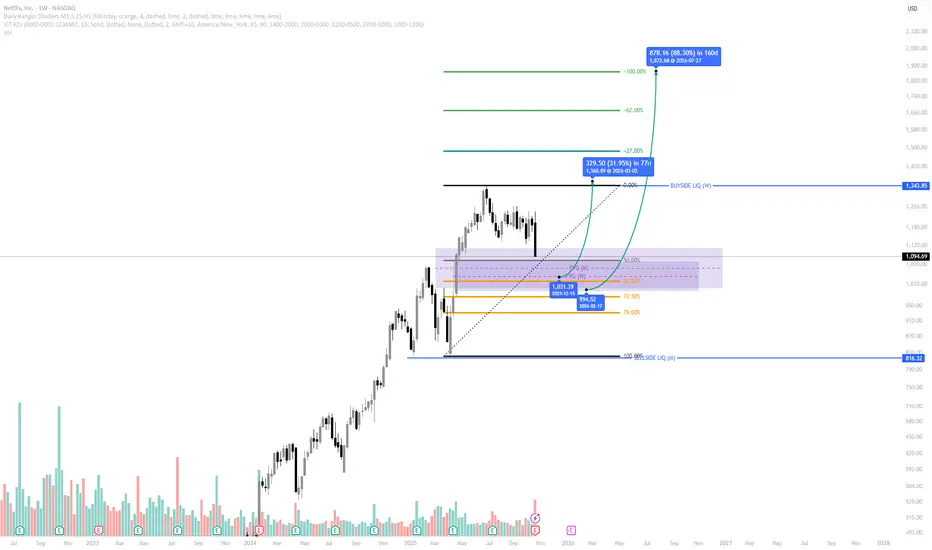
Netflix: A Correction Within a Strong UptrendNetflix: A Correction Within a Strong Uptrend
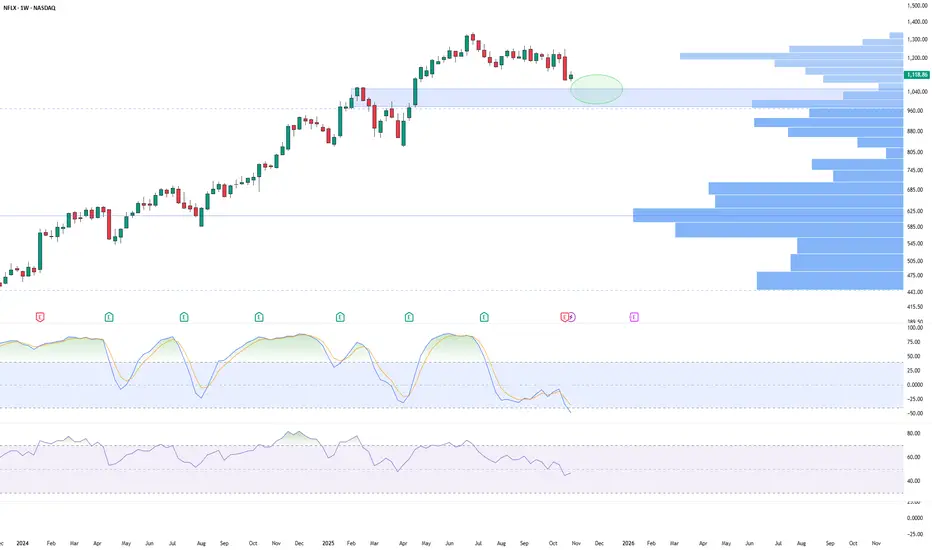
NASDAQ:NFLX has gone through a lot over the past few years, from huge growth to deep corrections, and lately we’ve seen a (healthy?) 20% pullback that brought the price right to the lower boundary of its long-term ascending channel.
At first glanc
Key facts today
Next report date
—
Report period
—
EPS estimate
—
Revenue estimate
—
20.9 EUR
8.42 B EUR
37.55 B EUR
421.12 M
About Netflix, Inc.
Sector
Industry
Website
Headquarters
Los Gatos
Founded
1997
ISIN
US64110L1061
FIGI
BBG000CYF5J3
Netflix, Inc. engages in providing entertainment services. It also offers activities for leisure time, entertainment video, video gaming, and other sources of entertainment. It operates through the United States and International geographic segments. The company was founded by Marc Randolph and Wilmot Reed Hastings on August 29, 1997 and is headquartered in Los Gatos, CA.
Related stocks

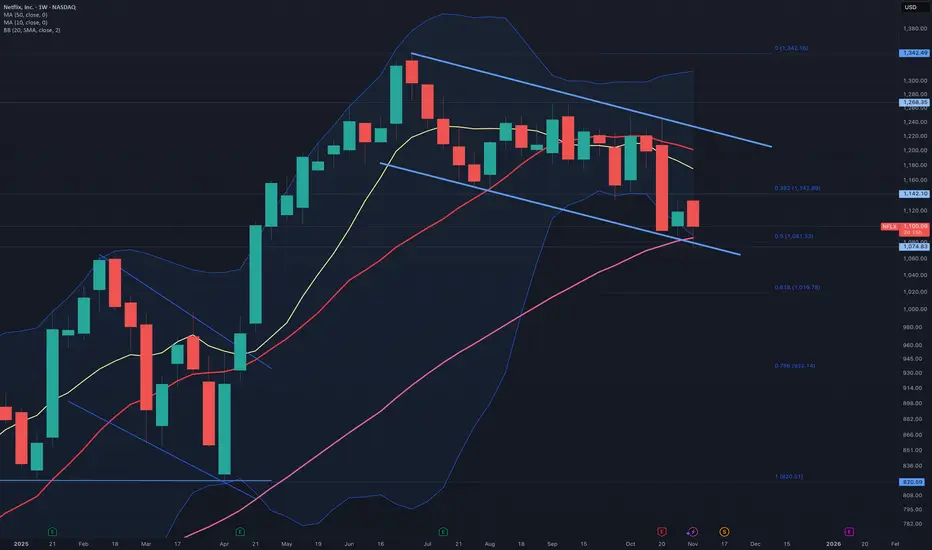
Netflix Daily & Weekly Chart: Critical Support Zone in PlaIn front of us is a daily chart of Netflix, and at first glance, you might think we’re staring at a straightforward top. But there’s more going on beneath the surface.
📉 Daily Chart Insight
We’re currently sitting at the bottom of a parallel down channel. That’s not just noise—it’s a potential infle

$NFLX | Weekly ChartNetflix enters the shortlist this week.
A potential buy zone is approaching, with momentum indicators turning interesting.
My custom indicator The Wave is flashing a potential long setup, right around the $1,000 area, maybe slightly above.
Earnings are already behind us, which clears the way for
$NFLX: READY FOR A BOUNCE NASDAQ:NFLX is showing a bullish flag and has reached the 0.5 retracement level. It has also tested the 50-week SMA twice, indicating it may be ready for a bounce.
Nflx I think the top has being made and a correction will happens . monthly Macd showing bulls are exahusted history I think meta and nflx are done for a while better staying away from those two if going long but that’s just my opinion .

NFLX - 2B REVERSAL PATTERN FORMATIONSharp drop after earnings ERRANTE:NETFLIX seems to be forming a new bottom around $1,095. Consolidating for some now and a 2b pattern is developing.
A lower candle in the same time frame invalidates the pattern.
NFA.
Good luck
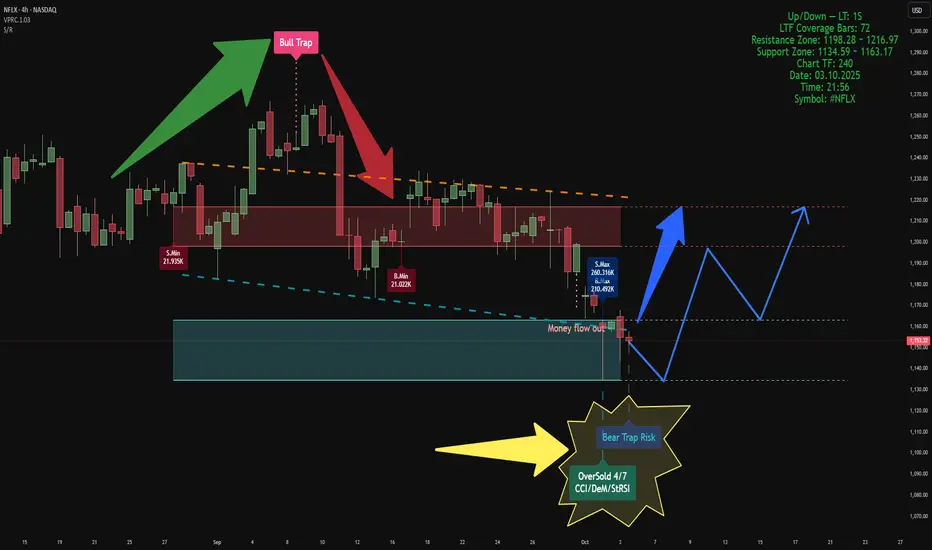
Volume-Based Market AnalysisUsing Indicators:
Smart Money Support/Resistance and ATAI Volume Analysis with Price Action V1.03
Analytical Configuration
This analysis combines two advanced indicators. The calculation period for both has been set to 52 bars, based on a lower timeframe of 1 second (1S), which provides 72 valid
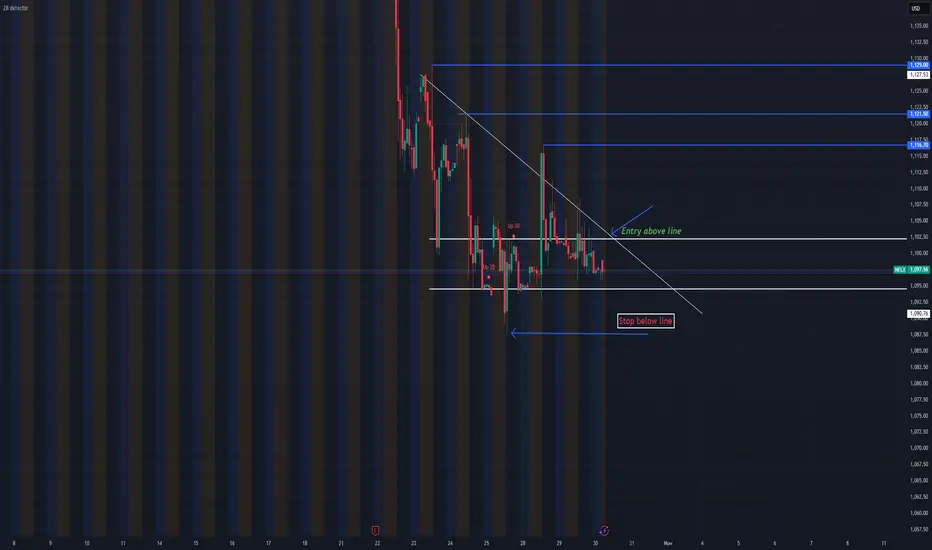
BUY NFLXNFLX is due to fall down or short soon at 1,134.00 to 1,405.00, but for next week or maybe this week – it's time to BUY NFLX at 1,164.00, riding back up to 1,134.00 to 1,405.00 as Profit Targets, Stop Loss is at 1,132.00!
If anyone likes long mumbo jumbo garbage analysis, than this is NOT for you.

Netflix (NFLX) | FVG + OTE Entry Loading | Multi-Confluence ICT Netflix (NASDAQ: NFLX) is currently retracing into a high-probability multi-timeframe setup, aligning several ICT confluences that suggest a potential re-entry opportunity within a bullish continuation narrative.
Market Structure:
Price remains bullish overall, with clear higher highs (HH) and high
NetflixHeard someone online talk about Netflix so I decided to throw this together real quick. Weekly levels are grey
Daily timeframe levels are red

See all ideas
Summarizing what the indicators are suggesting.
Neutral
SellBuy
Strong sellStrong buy
Strong sellSellNeutralBuyStrong buy
Neutral
SellBuy
Strong sellStrong buy
Strong sellSellNeutralBuyStrong buy
Neutral
SellBuy
Strong sellStrong buy
Strong sellSellNeutralBuyStrong buy
An aggregate view of professional's ratings.
Neutral
SellBuy
Strong sellStrong buy
Strong sellSellNeutralBuyStrong buy
Neutral
SellBuy
Strong sellStrong buy
Strong sellSellNeutralBuyStrong buy
Neutral
SellBuy
Strong sellStrong buy
Strong sellSellNeutralBuyStrong buy
Displays a symbol's price movements over previous years to identify recurring trends.
NFLX5862368
Netflix, Inc. 5.4% 15-AUG-2054Yield to maturity
5.46%
Maturity date
Aug 15, 2054
NFLX5862367
Netflix, Inc. 4.9% 15-AUG-2034Yield to maturity
4.51%
Maturity date
Aug 15, 2034
NFLX4901374
Netflix, Inc. 4.875% 15-JUN-2030Yield to maturity
4.29%
Maturity date
Jun 15, 2030
USU74079AN1
Netflix, Inc. 5.375% 15-NOV-2029Yield to maturity
4.22%
Maturity date
Nov 15, 2029
NFLX4908613
Netflix, Inc. 6.375% 15-MAY-2029Yield to maturity
4.11%
Maturity date
May 15, 2029
NFLX4826528
Netflix, Inc. 5.875% 15-NOV-2028Yield to maturity
4.02%
Maturity date
Nov 15, 2028
NFLX4764899
Netflix, Inc. 4.875% 15-APR-2028Yield to maturity
4.00%
Maturity date
Apr 15, 2028
US64110LAN64
Netflix, Inc. 4.375% 15-NOV-2026Yield to maturity
3.84%
Maturity date
Nov 15, 2026
XS198938050
Netflix, Inc. 3.875% 15-NOV-2029Yield to maturity
3.34%
Maturity date
Nov 15, 2029
XS207282979
Netflix, Inc. 3.625% 15-JUN-2030Yield to maturity
2.95%
Maturity date
Jun 15, 2030
XS198938017
Netflix, Inc. 3.875% 15-NOV-2029Yield to maturity
2.82%
Maturity date
Nov 15, 2029
See all NFC bonds
Curated watchlists where NFC is featured.


Frequently Asked Questions
The current price of NFC is 954.3 EUR — it has decreased by −0.67% in the past 24 hours. Watch Netflix, Inc. stock price performance more closely on the chart.
Depending on the exchange, the stock ticker may vary. For instance, on SWB exchange Netflix, Inc. stocks are traded under the ticker NFC.
NFC stock has risen by 0.40% compared to the previous week, the month change is a −4.87% fall, over the last year Netflix, Inc. has showed a 31.34% increase.
We've gathered analysts' opinions on Netflix, Inc. future price: according to them, NFC price has a max estimate of 1,379.06 EUR and a min estimate of 818.82 EUR. Watch NFC chart and read a more detailed Netflix, Inc. stock forecast: see what analysts think of Netflix, Inc. and suggest that you do with its stocks.
NFC stock is 0.74% volatile and has beta coefficient of 1.06. Track Netflix, Inc. stock price on the chart and check out the list of the most volatile stocks — is Netflix, Inc. there?
Today Netflix, Inc. has the market capitalization of 403.13 B, it has increased by 3.51% over the last week.
Yes, you can track Netflix, Inc. financials in yearly and quarterly reports right on TradingView.
Netflix, Inc. is going to release the next earnings report on Jan 15, 2026. Keep track of upcoming events with our Earnings Calendar.
NFC earnings for the last quarter are 5.00 EUR per share, whereas the estimation was 5.93 EUR resulting in a −15.68% surprise. The estimated earnings for the next quarter are 4.78 EUR per share. See more details about Netflix, Inc. earnings.
Netflix, Inc. revenue for the last quarter amounts to 9.81 B EUR, despite the estimated figure of 9.81 B EUR. In the next quarter, revenue is expected to reach 10.37 B EUR.
NFC net income for the last quarter is 2.17 B EUR, while the quarter before that showed 2.65 B EUR of net income which accounts for −18.19% change. Track more Netflix, Inc. financial stats to get the full picture.
No, NFC doesn't pay any dividends to its shareholders. But don't worry, we've prepared a list of high-dividend stocks for you.
As of Nov 7, 2025, the company has 14 K employees. See our rating of the largest employees — is Netflix, Inc. on this list?
EBITDA measures a company's operating performance, its growth signifies an improvement in the efficiency of a company. Netflix, Inc. EBITDA is 24.49 B EUR, and current EBITDA margin is 66.68%. See more stats in Netflix, Inc. financial statements.
Like other stocks, NFC shares are traded on stock exchanges, e.g. Nasdaq, Nyse, Euronext, and the easiest way to buy them is through an online stock broker. To do this, you need to open an account and follow a broker's procedures, then start trading. You can trade Netflix, Inc. stock right from TradingView charts — choose your broker and connect to your account.
Investing in stocks requires a comprehensive research: you should carefully study all the available data, e.g. company's financials, related news, and its technical analysis. So Netflix, Inc. technincal analysis shows the sell today, and its 1 week rating is sell. Since market conditions are prone to changes, it's worth looking a bit further into the future — according to the 1 month rating Netflix, Inc. stock shows the buy signal. See more of Netflix, Inc. technicals for a more comprehensive analysis.
If you're still not sure, try looking for inspiration in our curated watchlists.
If you're still not sure, try looking for inspiration in our curated watchlists.