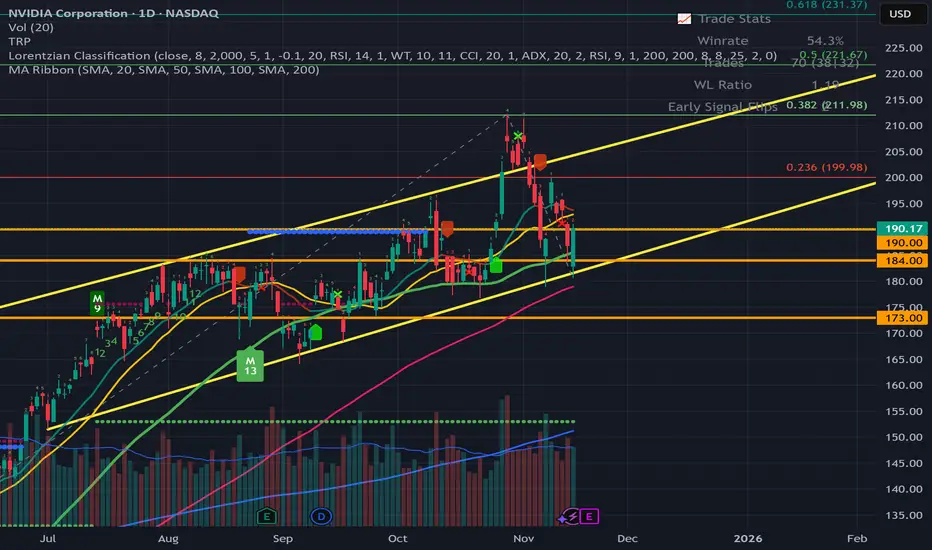
NVDIA - Earnings Setup for This WeekHello Everyone , Followers,
NVDIA will release its financial reports on Wednesday after market closed. I would like to share my view and follow up level depends on good and bad reports
Bullish Scenario
If earnings beat + guidance strong → next target: 221 - 222
Bearish Scenario
Weak numbers → potential drop to between 173.00 - 176.00
🔹 Key Support Zones
First support: 184.00
Deeper support: 173.00
🔹 Resistance Levels
Main resistance: 199.00 - 200.00
Breakout target: 221 - 222
🔹 Outlook
As long as It stays above 190.00 , momentum remains bullish.
A breakdown below that level could open the door for a deeper pullback. This is depends on Results of financial reports.
🔹 My Plan
I will wait for the financial report before i buy it . With a bearish scenario my buy level is between 176-173 then probably i will hold it for next 5 years.
If it can achive to stay above 190 and if you like to take a risk then you can buy it above this level .
If you enjoy and like clean, simple analysis — follow me for more.
Have a lovelly and Sunny Weekend to all.
Trade ideas
NVDA QuantSignals V3 — Katy Flags Subtle Reversal MoveNVDA (QuantSignals V3)
Market Structure:
NVDA is showing neutral-to-weak momentum with price hovering near short-term resistance at $189–190. Buyers are losing strength, and the tape shows lower high formations, signaling potential exhaustion.
Trend Outlook:
The Katy 1M model flags soft downside pressure. Despite the neutral trend reading, intraday structure leans toward a controlled pullback, supported by moderate volatility (16.5%).
Order Flow Insight:
Momentum flow appears to be slowing, with reduced upward volume. The micro-trend suggests fade-the-rip behavior—small rallies may get sold into.
Key Levels:
Resistance: $189.40 / $191.70
Support: $188.00 / $186.80
Short Trigger Zone: $188.50–$189.00
Vision Summary:
NVDA shows lower momentum, weak buyer conviction, and a short-biased micro-shift. Best setup aligns with a tight short scalp targeting the next liquidity pocket below $188.00.
NVDA earnings thsi week - will that be catalyst for a move?Its been another few months of great bullish moves on NVDA, however the last couple of weeks have been choppy. We rejected the $200 level and now find ourselves sat above $180 and the Weekly 20MA.
If the numbers are good then I'm sure the giddiness will take us higher. If the numbers are poor the you have to ask will $180 and the Weekly 20MA act as support, or will they collapse? If they do, what will happen to tech and US markets in general? It means that its going to be an interesting week!

Ahead of Nvidia’s (NVDA) Earnings: How the Price Could MoveAhead of Nvidia’s (NVDA) Earnings: How the Price Could Move
On Wednesday, after the close of the main US trading session, Nvidia will release its quarterly results — a report seen not merely as another batch of corporate data but as a crucial test for the entire AI-driven bull run.
NVDA shares are up more than 40% since the start of the year, and the company must now prove that this surge is justified and that the AI revolution is still accelerating. According to media reports, Wall Street analysts remain optimistic:
→ Revenue: forecast around $54.9bn, implying roughly 56% year-on-year growth.
→ Earnings per share (EPS): about $1.25 (previous quarter: $1.05).
What should investors focus on?
Of particular importance will be:
→ data on Data Centre revenue, a key indicator of whether the AI boom remains intact;
→ forward guidance, as the market is looking for reassurance that Big Tech will continue to spend heavily on AI.
Technical Analysis of the Nvidia (NVDA) Chart
Recent price action in NVDA points to a sequence that can be interpreted as bearish:
→ 28 October: a strong rally above the psychological $200 level;
→ a failure to hold above that barrier;
→ a pullback on rising volumes (Nasdaq data) with expanding candles in early November.
In the broader market context, it is notable that early November has seen NVDA underperforming major equity indices, signalling firm resistance from sellers around $200.
From a bullish perspective, the decline from the all-time high resembles a correction pattern (shown in red) within a larger uptrend.
However, there is a risk that the market’s high expectations will not be met when the earnings report is published. If that happens, NVDA could extend its decline towards the lower boundary of the rising channel, where support lies near $165.
This article represents the opinion of the Companies operating under the FXOpen brand only. It is not to be construed as an offer, solicitation, or recommendation with respect to products and services provided by the Companies operating under the FXOpen brand, nor is it to be considered financial advice.

$NVDA | The Next Big Leg?NVIDIA has been a textbook case of Smart Money structure this cycle.
✅ Break of Structure (BOS) confirmed
✅ Trendline + MA confluence support at ~$177
✅ Strong premium zone rejection near $195
✅ Fibonacci extension eyeing $231.80
🔑 Levels to Watch:
$177 = Key support (trendline + MA)
$195 = Resistance zone (premium supply)
$231 = Next target if bullish momentum continues
💡 Game Plan:
Above $177 = Long bias toward $195 → $231
Break below $177 = Retrace toward $153 equilibrium
⚡️ Tech + AI flows remain strong; NVDA could be gearing up for another explosive move.
📢 Question to the community:
👉 Do you think NASDAQ:NVDA pushes through $195 straight to $231, or do we retest $153 first?
#NVDA #TradingView #Stocks #Fibonacci #SmartMoneyConcepts #AI #Bullish

$NVDA | Fib Expansion Points to $212.81 → Is the AI Supercycle JWaverVanir International LLC | Weekly Fibonacci Roadmap
📅 June 25, 2025 | +7.27% Day | Post-Stock Split Momentum
NVIDIA ( NASDAQ:NVDA ) continues to dominate the AI-driven tech rally. After reclaiming the 1.618 Fibonacci level ($128.35), price has broken above the 0.886 retracement ($146.72) and is now pressing higher with bullish volume.
🧠 Fibonacci Insights:
🔺 1.786 Fib Extension: $207.76
🎯 Primary Target: $212.81 (Golden Projection)
🚀 Long-term Fib targets extend into $250–290+ zone (2.618–3.0 extensions)
🔻 Red trendline below signals well-respected diagonal support since early 2023
📊 Price Outlook:
Current Price: $154.31
Short-term Path: Bullish breakout → $168.21 → $178.43
Next Major Resistance: $212.81
Support to Hold: $139.93 / $128.35 (previous Fib clusters)
🧩 Catalysts Ahead:
Q2 Earnings (Late August 2025) – Focus on AI/data center revenue acceleration.
NVIDIA Blackwell GPU shipments – Institutional uptake will confirm pipeline robustness.
AI Sovereign Demand – U.S., UAE, Singapore and Saudi Arabia investing in GPU infrastructure.
AI Arms Race – Competitive moat widening vs. AMD, Intel.
AI App Ecosystem Expansion – Surge in demand for inferencing chips (L4, L40, GB200).
Post-Stock Split Rotation – Retail inflow and fresh institutional allocations.
📌 Summary:
NVIDIA is not just a chipmaker — it’s the core of the modern AI stack. With clear Fibonacci structure and geopolitical tailwinds, the next target is $212.81. Watch dips into $140s for potential reload zones.
🔖 Hashtags:
#NVDA #NVIDIA #AIstocks #WaverVanir #FibExtension #FibonacciTrading #AIboom #BlackwellGPU #GPUpower #PostSplit #TechLeadership #TradingView #SMC #AIarmsrace

NVDA – First Signs of Stabilization After a Heavy Selloff (11/17NVDA finally showed the first real sign of stabilization after multiple days of controlled selling. The move off the lows wasn’t random — when you zoom into the different timeframes and combine it with the GEX landscape, the bounce actually makes a lot of sense. NVDA dropped right into a deep put zone, bottomed, and then climbed back with intent.
Let’s break down what’s really happening here.
1️⃣ 1-Hour Chart — Downtrend, but Buyers Finally Stepped Up
The 1H chart shows NVDA breaking every minor support for days, sliding cleanly down the descending channel. The selling pressure cooled only when price touched the 178–181 region. That’s where the trendline support met previous liquidity pockets, and buyers reacted instantly.
What’s notable is how quickly NVDA recovered back toward 190. That tells me two things:
1. Sellers covered aggressively at the low.
2. Buyers were waiting to step in near that trendline.
Important 1H levels:
* 190–192: First resistance test
* 194–195: Critical zone NVDA couldn’t reclaim last time
* 199–202: Bigger resistance if momentum expands
* 178–181: Strong demand zone that started the bounce
The 1H is showing the first shift from “straight down” to “controlled bounce.”
2️⃣ 15-Minute Chart — Momentum Turning Upward, but Needs Confirmation
The 15M chart shows NVDA reclaiming multiple small bullish FVGs on the way up. The most important part is how NVDA handled the intraday pullbacks — each dip was shallow and got bought quickly.
That’s what early reversal behavior looks like.
Key things I see on the 15M:
* Bullish FVGs forming under price → buyers absorbing dips
* Short-term resistance at 191–192 → price hesitating here
* Trendline reclaim gives NVDA room to test higher
The 15M doesn’t confirm a strong uptrend yet, but it shows a clear shift in character from sellers dominating to buyers at least competing.
3️⃣ GEX (1-Hour) — Explains Exactly Why NVDA Bottomed Where It Did
This is the part that ties the entire move together.
NVDA bounced precisely at the deep PUT wall around 178–181, where hedging pressure spikes. That’s why the reversal there was so sharp.
Upside Gamma Levels
* 191: First GEX pull
* 194–195: Heavy GEX cluster
* 200–203: 2nd call wall
* 210: Large GEX10 + 3rd call wall
If NVDA can reclaim 194–195, the move toward 200–203 becomes much easier than it looks on the chart alone.
Downside Gamma Levels
* 182: Pivot zone
* 178: Main put wall — the exact level that stopped the selling
* 175–170: Only activates if NVDA loses 178 decisively
The GEX structure is clean:
* Sellers lose power above 192
* Buyers lose control below 182
* Real battle zone sits between 188–192
This is the kind of GEX map that makes traders ask:
“Why does NVDA always bounce or stall at the same weird levels?”
(And yes — GEX gives the answer.)
🎯 How I’m Trading NVDA for 11/17
🔼 Bullish Scenario (Preferred Only Above 192)
NVDA needs to clear 192 with strength. If that happens:
Stock Trade Idea:
* Entry: 192.20–192.50
* Targets:
* 194
* 195
* 198
* 200–203 (call wall zone)
Options Idea:
* 195C or 200C
* Momentum-based trade IF NVDA reclaims 192 with volume
* Scale at each GEX zone
This is the cleanest setup.
🔽 Bearish Scenario (Only Valid If NVDA Rejects 192 or Loses 182)
Entry #1 (Aggressive):
* Rejects 192 → short into 188
Entry #2 (Stronger Confirmation):
* Break below 182
Targets:
* 180
* 178 (strong put wall)
* 175 (if volatility spikes)
Options Idea:
* 185P for quick moves
* 180P for continuation
* Below 178 → downside accelerates sharply
⚠️ Chop Zone: 188–191
This is the balance area where NVDA is likely to pause, fake out, and trap both sides.
Best avoided unless you’re scalping with tight risk.
Final Thoughts
NVDA finally caught a real bid after a long series of lower highs and lower lows. The bounce wasn’t accidental — it aligned with deep GEX put walls and a structural trendline. Now NVDA sits right below a key resistance at 192. That’s the line that decides whether this becomes a real reversal or just another lower high inside the downtrend.
Above 192 → the chart opens beautifully.
Below 182 → the bears take back control.
Anything between is noise.
Disclaimer
This analysis is for educational purposes only and does not constitute financial advice. Always trade with proper risk management.

NVDANVIDIA is still in an uptrend. Last week, the price hit a new high of $210, but the price was unable to break through this level, so it adjusted down. It is expected that the price will likely test the important support zone at $167-155. If the price cannot break through $155, the price still has a chance to rise.
However, if the price continues to rise in the near future, a correction may also occur.
Long-term trading plan: Wait for the correction to complete before buying.
** This is not financial advice.
🔥Trading futures, forex, CFDs and stocks carries a risk of loss.
Please consider carefully whether such trading is suitable for you.
>>GooD Luck 😊
❤️ Like and subscribe to never miss a new idea!


Nvda- Er this week I believe it has more in the tank!!Nvda smashes ER were going to see a massive inpulse! I don't see in heavy volume selling on the daily.. I think this one will be the last big pop we see before a major correction.. All other hyperscalers have performed and had major gaps on er.. Nvda is next bookmark this!!
Exchange Rate Strategies in the Global Market1. Understanding Exchange Rates and Their Importance
An exchange rate is simply the price of one currency in terms of another, such as 1 USD = 83 INR. But behind this apparent simplicity lies a complex system influenced by macroeconomic factors like inflation, interest rates, political stability, and capital flows.
Exchange rate fluctuations can determine the profit margins of exporters, the cost of imports, and the returns on foreign investments. In the global market, even a small movement—say, a 0.2% shift—can translate into millions of dollars gained or lost.
For this reason, market participants use a variety of strategies to manage risk, hedge currency exposure, and speculate on potential price movements.
2. Major Exchange Rate Strategies in the Global Market
Exchange rate strategies can be broadly classified into three categories:
Hedging Strategies – Used to protect against adverse currency movements.
Speculative Strategies – Aim to profit from expected changes in currency values.
Arbitrage and Carry Trade Strategies – Designed to exploit interest rate differentials or mispricing across markets.
Let’s explore each in detail.
3. Hedging Strategies: Protecting Against Currency Risk
Hedging is the most widely used approach in international business, especially for exporters, importers, and global investors. The goal is not to make a profit, but to avoid loss caused by unpredictable exchange rate movements.
a) Forward Contracts
A forward contract locks in a specific exchange rate for future delivery.
For example, an Indian exporter expecting $1 million payment in 3 months may fear the rupee strengthening, which would reduce rupee earnings. The exporter can fix today’s rate using a forward contract.
Benefits:
Offers certainty
Customizable to the amount and date
Drawbacks:
No benefit if the market moves favorably
Requires contractual commitment
b) Currency Futures
Currency futures serve a similar purpose as forwards but are traded on exchanges. They are standardized and offer more liquidity.
Who uses them:
Traders
Fund managers
Institutions needing transparency and daily settlement
c) Options (Currency Options)
Options provide the right—but not the obligation—to buy or sell currency at a set price.
Example: A call option on USD/INR allows buying USD at a set rate if the market rises.
Advantages:
Asymmetric protection
Gain on favorable moves, protection on unfavorable moves
Disadvantage:
Premium cost
d) Natural Hedging
Instead of using financial instruments, companies adjust their operations:
Borrow in the same currency as earnings
Match import payments with export receipts
Keep foreign currency balances
This reduces risk without needing derivatives.
4. Speculative Strategies: Profiting from Currency Movements
Speculation involves taking calculated positions in currencies, expecting changes in exchange rates. Professional traders, hedge funds, and banks commonly practice these strategies.
a) Trend Following (Momentum Trading)
Currencies often move in trends due to macroeconomic forces.
Traders use technical indicators like moving averages, RSI, and Fibonacci levels to identify upward or downward momentum.
b) Range Trading
Some currency pairs stay within predictable ranges for long periods.
Traders buy when the price touches the lower boundary (support) and sell when it hits the upper boundary (resistance).
c) Breakout Trading
Breakouts occur when currency pairs move beyond established levels due to major news, economic data, or central bank decisions.
Breakout traders aim to enter early and ride the fast movement.
d) Position Trading (Macro Trading)
These traders hold positions for months based on macroeconomic expectations:
Central bank policy divergence
Economic growth differences
Inflation trends
Political stability
Famous macro traders like George Soros used long-term fundamental strategies.
5. Arbitrage and Carry Trade Strategies
These are advanced strategies focused on inefficiencies or interest rate gaps.
a) Triangular Arbitrage
This exploits mispricing among three currencies.
For example, if EUR/USD, USD/JPY, and EUR/JPY exchange rates do not align perfectly, traders can buy one currency and sell another simultaneously for risk-free profit.
b) Covered Interest Arbitrage
This involves using forwards to lock interest rate differentials between two countries.
If a country has higher interest rates, investors borrow in a low-rate currency and invest in a high-rate one, hedging with a forward contract.
c) Uncovered Interest Arbitrage (Carry Trade)
The carry trade is one of the most popular global strategies.
How it works:
Borrow in a low-interest-rate currency (like JPY).
Invest in a high-interest-rate currency (like INR).
Earn the interest rate difference.
Risk:
If the high-rate currency depreciates sharply, losses can exceed gains.
Carry trade often collapses during global risk-off events.
6. Exchange Rate Strategies Used by Governments & Central Banks
Governments also actively manage exchange rates to stabilize the economy.
a) Currency Pegging
A country fixes its currency to another stable currency (USD, EUR, etc.).
Example: The UAE dirham is pegged to the USD.
b) Managed Float
Most currencies (including USD/INR) follow a managed float, where the central bank intervenes occasionally to prevent extreme volatility.
c) Forex Reserves Management
Countries hold large reserves to defend their currency during speculative attacks or to stabilize the exchange rate.
d) Capital Controls
Some nations restrict money movement to manage exchange rate stability.
Example: Limits on remittances or FDI flows.
7. Factors Influencing Exchange Rate Strategy Effectiveness
Several global factors shape the success of any exchange rate strategy:
Interest rate differentials
Trade balances
Inflation levels
Political and geopolitical risks
Commodity price changes (oil, gold, etc.)
Capital flows and investor sentiment
Central bank policy divergence
Understanding these factors enhances strategy accuracy.
8. Choosing the Right Exchange Rate Strategy
The optimal strategy depends on the participant’s profile:
For businesses:
Use hedging (forwards, options, natural hedges).
For traders:
Use speculative strategies (trend, breakout, arbitrage).
For investors:
Use carry trades, macro strategies, and diversified currency portfolios.
For governments:
Use policy tools (interventions, reserves, peg systems).
Conclusion
In the global market, exchange rate strategies form the backbone of international trade, investment security, and financial stability. With rising globalization, volatile currency movements are inevitable, and understanding the right mix of hedging, speculation, and arbitrage strategies can provide a strong edge. Whether one is an exporter managing risk, a trader seeking opportunity, or a policymaker stabilizing the economy, mastering exchange rate strategies enables smarter decisions and stronger resilience in today’s dynamic global market.
NVDA chart AnalysisI am sharing my NVDA chart analysis with other traders on how it can react or what potential prices it can go

$NVDANASDAQ:NVDA reports earnings next week, but I feel the hype is slowing down.
The only catalysts that could keep them strong are deeper ties with Israel’s defense systems and the new military tech initiatives they’re trying to build.
But even with that, the price needs a balance point.
NVDA is too extended it needs a healthy correction before the next leg.

Continuation of the "AI Bubble" A chart for NVDA that illustrates the parabolic curve on this very large timeframe
To expect a curve like this to break is unlikely
AI will have huge implications
The potential of AGI aswell is huge for humanity in general. I don't see a bubble at all.
Weekly timeframe

NVDA Montly Neg. Divergence?Sure, stocks will rise eventually and we have been in a strong bull market since autumn 2022 but how about this negative divergence on the monthly chart of NVDA? (Also on the weekly chart.) Monthly charts always shows us the direction and we just take action according that by looking at the daily. How long more the buyers are going to buy NVDA? Count the Elliott waves since Oct. 2022 on higher time frames as well. Indicators getting weak, Fibonacci is struggling around 161 level… Something has to cool off.

Market Noise That Traps Retail Traders1. What Is News Trading?
News trading is a strategy where traders take positions based on the expected market reaction to economic events or announcements. These events can be:
Economic data (GDP, inflation, interest rates, unemployment)
Central bank decisions (RBI, Fed, ECB meetings)
Corporate earnings and guidance
Mergers, acquisitions, buybacks
Global geopolitical developments
Commodity reports (OPEC meetings, inventory data)
Government policies and regulations
News changes market expectations, and markets move on expectations — that’s the core idea behind news trading.
2. What Is “Noise” and Why Is It Dangerous?
Noise is any information that creates confusion without adding value.
Examples of noise:
Clickbait headlines (“Market to crash 20%?”)
Social media hype (Twitter/X rumors)
WhatsApp university “insider news”
Delayed news after the market has already reacted
TV channel opinions that change every minute
Over-analysis without data
Emotional panic or euphoria from retail traders
Noise causes wrong decisions, late entries, and over-trading.
Professional traders avoid it by sticking to verified, timely, and market-moving information.
3. Why Most Retail Traders Fail in News Trading
Retail traders often:
React after the move has already happened
Trade based on emotions, not data
Follow misleading social media posts
Don’t understand whether news is actually important
Lack a prepared plan before events
Cannot interpret the deviation between expected and actual data
Professional traders, on the other hand, plan days ahead and execute in seconds.
4. How to Trade News Without Noise – The Clean Process
The core idea is: Be prepared before the news, respond instantly to real numbers, avoid emotional reactions.
Here’s the step-by-step process:
Step 1: Know Which News Actually Matters
Not all news moves markets. Learn to classify news into:
High Impact News
RBI policy meetings
US Federal Reserve meetings
Inflation data (CPI, WPI)
GDP growth numbers
Employment data
Major earnings announcements
Geopolitical tensions (war, sanctions, oil shocks)
Medium Impact News
Industrial production
Services PMI, Manufacturing PMI
Consumer sentiment
Smaller corporate updates
Low Impact News
Minister speeches
General opinions
Minor announcements
Over-analyzed TV commentary
Rule: Focus only on news with real economic consequences.
Step 2: Prepare a News Calendar
Before the week starts, create a watchlist of events:
Date
Time
Expected numbers
Previous numbers
Expected market reaction
Tools to use:
Economic calendars
Earnings calendars
OPEC & inventory calendars
RBI/Fed meeting schedules
Preparation removes confusion and reduces noise.
Step 3: Understand “Expectations vs Reality”
Markets don’t react to news itself; they react to the difference between expected and actual results.
Example:
If inflation is expected at 5% but comes at 5.4%, markets fall.
If it comes at 4.7%, markets rise.
This deviation is called “surprise factor.”
Professional traders instantly measure this deviation and take positions.
Step 4: Use the 10-Second Rule During News
During major announcements:
Avoid trading in the first 10 seconds
Let the initial volatility settle
Watch the direction that forms after the first burst
This protects you from:
Whipsaws
False breakouts
High spreads
Stop-loss hunting
Clean news trading happens when you allow the dust to settle.
Step 5: Read Market Reaction, Not Headlines
Instead of reacting to headlines, look at:
Price action
Volume
Market structure
Order flow
Option chain (PCR, IV crush, delta shift)
Markets sometimes reverse the initial move when the news is already priced in.
Price is the real truth.
Step 6: Have a Pre-Defined Plan
Before the news releases, decide:
If number is better → buy or go long
If number is worse → sell or go short
If number meets expectations → avoid trading
This clarity eliminates emotional decisions.
Step 7: Avoid Social Media & TV Noise
Once news is released, social feeds explode with:
Panic
Rumors
Emotional reactions
Incorrect interpretations
Professionals ignore all this and stick to data and price.
5. Tools and Indicators to Reduce Noise in News Trading
These tools help you filter real movements from noise:
1. Volume Profile
Shows if the move has real institutional participation or just retail panic.
2. Market Structure
Identifies:
break of structure (BOS)
change of character (CHOCH)
real trend direction
3. Volatility Indicators
ATR (Average True Range)
Implied volatility (IV)
They help you avoid fake spikes.
4. Liquidity Zones
News often sweeps liquidity before moving in the real direction.
5. Option Chain Analysis
IV Crush
Rapid delta movement
Change in OI
PCR shift
This gives instant information on institutional positioning.
6. Best Markets for News Trading
Forex Market
Most sensitive to:
interest rate decisions
inflation
employment data
Stock Market
Most sensitive to:
earnings
M&A news
regulatory changes
Commodity Market
React to:
crude oil inventory
OPEC decisions
weather reports (for agri commodities)
Index Futures (Nifty, Bank Nifty)
React strongly to:
RBI policy
global cues
geopolitical risk
These markets give clean opportunities during news.
7. Common Mistakes to Avoid
Trading BEFORE the news – high risk
Entering too late AFTER the move – trap
Following hype and rumors
Not using stop-loss
Taking too large position sizes
Over-trading due to excitement
Ignoring the bigger trend
Avoiding these mistakes helps you trade news without getting caught in noise.
8. Risk Management for News Trading
News trading is profitable only with strict risk rules:
Keep position size small (1–2%)
Use stop-loss every time
Avoid averaging losers
Take profits quickly
Never hold weak trades through big events
News moves fast; your risk control must be even faster.
9. How Professionals Maintain Clarity
Top traders follow this checklist:
They prepare for news
They track expectations, not opinions
They avoid emotions
They follow price action
They execute as per plan
They ignore noisy sources
They use data, not predictions
This is why their entries are clean and exits are disciplined.
Conclusion
Trading news without noise is all about clarity, preparation, discipline, and data-based decisions.
Instead of reacting to hype, you follow a structured process:
Identify high-impact news
Study expectations
Wait for real numbers
Confirm with price action
Execute clean trades
Manage risk tightly
When done properly, news trading can give some of the best and fastest profits in the market. When done emotionally, it becomes the fastest way to lose money.

NVIDIA hourly patteren✅ Resistance Levels
Near ~$198.50 as a third resistance point.
Around ~$194.97 as a second resistance zone.
A prior high close‑to ~$212 from recent months that may act as a major ceiling.
✅ Support Levels
Support identified at ~$183.33.
A lower support zone near ~$179.79.
Broad support zone in the ~$182‑187 range from another study.

NVDA Weekly Call Alert — AI Recovery + Institutional Flow🧭 Overview
Ticker: NVDA
Current Price (Entry): $187.50
Trend: Bullish (Analyst + AI recovery)
Expiry: 2025-11-21 (7D)
Strike: $187.50 (ATM, Delta 0.521)
Position Size: 4% of portfolio
📊 AI & Technical Forecast
Katy AI Target: Recovery sequence $185 → $190, timing for momentum reversal
Analyst Price Target: $250
PCR / Flow Intel: 0.33 → bullish institutional positioning
RSI: 80.9 → overbought, expect short-term dip before upward move
VIX: 19.84 → favorable volatility entry before expansion
Insights:
Friday entry captures weekend theta premium
Light weekly volume (0.6x) → monitor for institutional confirmation
Dip to $185.50 may provide optimal entry for maximum upside
🎯 Trade Setup
Parameter Value
Direction CALL
Strike $187.50
Entry $7.50
Target 1 $12.00 (+60%)
Target 2 $15.00 (+100%)
Stop Loss $4.50 (–40%)
Expiry 2025-11-21
Position Size 4% portfolio
Confidence 60%
⚡ Key Advantages
ATM call → balanced risk/reward vs OTM alternatives
Tight stop aligns with AI critical support at $184.44
Institutional bullish flow + AI recovery pattern → asymmetric reward potential
Timing advantage: Monday-Tuesday momentum reversal
🚨 Risk Notes
Low AI confidence (50%) → disciplined sizing required
Overbought RSI → short-term upside may be capped
Rising VIX → daily premium decay risk, consider scaling entry
Avoid holding past Wednesday if Target 1 isn’t reached
Summary
NVDA presents a medium-conviction weekly call leveraging AI recovery trajectory, institutional flow, and analyst support. Ideal for disciplined traders seeking timed momentum entry into a 7-day horizon.
Nvidia Is +115% Since April. Here's What Its Chart SaysNvidia NASDAQ:NVDA has gained some 115% since its April low and recently hit an all-time high. Let's see what the chip giant's chart and fundamental analysis can show us ahead of NVDA's fiscal Q3 earnings release next week.
Nvidia's Fundamental Analysis
Nvidia CEO Jensen Huang this month traveled to Taiwan to attend the annual sports day held by integrated-circuits maker Taiwan Semiconductor NYSE:TSM , which he called NVDA's "forever partner."
Although Nvidia has deals in place with firms like Intel NASDAQ:INTC , TSM is Nvidia's primary foundry when it comes to manufacturing high-end AI-capable GPUs.
Huang said in public remarks that he asked TSM for additional chip supplies because "the business is very strong and it's growing month by month, stronger and stronger."
I can't wait to see if next week's earnings release tells the same tale.
Nvidia plans to roll out its latest results after the closing bell next Wednesday (Nov. 19).
Wall Street's consensus view calls for the firm to report $1.25 in adjusted earnings per share on roughly $54.8 billion in revenue. That would represent a 54.3% gain from $0.81 in adjusted EPS the same period last year, as well as better than 56% top-line growth from the $35.1 billion that NVDA saw a year earlier.
While many investors would see that as incredible growth, Nvidia's sales have actually been decelerating from almost unheard-of levels in recent years due to the law of large numbers. However, a print like that would be in line with Nvidia's fiscal Q2 result released in August.
Meanwhile, 32 of the 39 sell-side analysts that I know of who cover NVDA have revised their estimates higher since the quarter began, while six have reduced their forecasts. (One estimate has been left unrevised.)
Nvidia's Technical Analysis
Next, let's check out NVDA's year-to-date chart through Monday afternoon:
Readers will see that NVDA this spring blasted out of a cup-with-handle pattern, as denoted by the green box and purple curving line at the chart's left. This is a bullish technical set-up.
The shares then rallied in late summer in an ascending-triangle pattern, marked with a green box and black lines at the chart's right.
That's normally a pattern of bullish continuance, which is exactly what Nvidia saw until the U.S. government shutdown impacted markets as October moved into November.
That said, Nvidia managed to find support at its 50-day Simple Moving Average (or "SMA," marked with a blue line at $183.90 in the chart above). That's where investors would look for professionally managed money to potentially defend the stock.
Conversely, the $212.19 intraday record high that NVDA set on Oct. 29 might serve as the stock's upside pivot.
Looking at Nvidia's secondary technical indicators, the stock's Relative Strength Index (the gray line at the chart's top) appears to have found some support recently at the neutral line and began moving higher again.
Meanwhile, Nvidia's daily Moving Average Convergence Divergence indicator (or "MACD," marked with black and gold lines and blue bars at the chart's bottom) isn't bullishly postured, at least not yet.
However, the histogram of the stock's 9-day Exponential Moving Average (or "EMA," denoted by blue bars) could be poised to move back into positive territory soon.
And while Nvidia's 12-day EMA (the black line) recently moved below the 26-day EMA (the gold line), the black line seems to be curling upward and might soon re-cross over the gold one. The bulls would be rooting for that.
An Options Option
As I write this, the options market is pricing in a roughly $16 move in Nvidia (or 8%) in relation to next week's earnings.
Option traders who expect Nvidia to rise in response to next week's earnings and who would rather use leverage than lay out to purchase the stock might employ a simple bull-call spread in this situation.
This strategy involves purchasing one call while simultaneously selling a second call at with higher strike price, but the same expiration date. Here's an example:
-- Long one NVDA $200 call with a Nov. 19 expiration date (i.e., after next week's earnings release). The cost is about $7.85 at recent prices.
-- Short one Nov. 19 NVDA $215 call, generating a $2.85 premium.
Net Debit: $5
The trader in this example is risking the $5 net debit, which would represent his or her maximum theoretical loss in the above spread.
But if NVDA rises as the trader in this example expects and both options are exercised, the person would realize $15 of proceeds minus the $5 debit for $10 net profit (the maximum gain).
(Moomoo Technologies Inc. Markets Commentator Stephen "Sarge" Guilfoyle was long NVDA and INTC at the time of writing this column.)
This article discusses technical analysis, other approaches, including fundamental analysis, may offer very different views. The examples provided are for illustrative purposes only and are not intended to be reflective of the results you can expect to achieve. Specific security charts used are for illustrative purposes only and are not a recommendation, offer to sell, or a solicitation of an offer to buy any security. Past investment performance does not indicate or guarantee future success. Returns will vary, and all investments carry risks, including loss of principal. This content is also not a research report and is not intended to serve as the basis for any investment decision. The information contained in this article does not purport to be a complete description of the securities, markets, or developments referred to in this material. Moomoo and its affiliates make no representation or warranty as to the article's adequacy, completeness, accuracy or timeliness for any particular purpose of the above content. Furthermore, there is no guarantee that any statements, estimates, price targets, opinions or forecasts provided herein will prove to be correct.
Options trading is risky and not appropriate for everyone. Read the Options Disclosure Document (j.moomoo.com j.moomoo.com ) before trading. Options are complex and you may quickly lose the entire investment. Supporting docs for any claims will be furnished upon request.
Options trading subject to eligibility requirements. Strategies available will depend on options level approved.
Maximum potential loss and profit for options are calculated based on the single leg or an entire multi-leg trade remaining intact until expiration with no option contracts being exercised or assigned. These figures do not account for a portion of a multi-leg strategy being changed or removed or the trader assuming a short or long position in the underlying stock at or before expiration. Therefore, it is possible to lose more than the theoretical max loss of a strategy.
Moomoo is a financial information and trading app offered by Moomoo Technologies Inc. In the U.S., investment products and services on Moomoo are offered by Moomoo Financial Inc., Member FINRA/SIPC.
TradingView is an independent third party not affiliated with Moomoo Financial Inc., Moomoo Technologies Inc., or its affiliates. Moomoo Financial Inc. and its affiliates do not endorse, represent or warrant the completeness and accuracy of the data and information available on the TradingView platform and are not responsible for any services provided by the third-party platform.

NVDA using TrenVantage LITEQuick look at nvidia using the TrenVantage LITE indicator. Clearly in a downtrend here, close levels plotted are daily's that have been tested, chances are they wont hold. Would expect to see the lower levels since this has already turned into a downtrend. Weekly Monthly and Daily Key Levels all plotted.

Elliott Waves Don’t Lie: NVDA’s Path to $26,000Summary: “Elliott Waves, Fibonacci, and Smart Money align perfectly — NVIDIA’s long-term chart points to an AI-powered Supercycle with massive upside." 💎📊
🚀 NVDA | The Supercycle of the AI Era! 💚
🌀 Elliott Wave Supercycle Breakdown
NVIDIA’s price action over the past two decades is a textbook example of a multi-decade Elliott Wave Supercycle — where technical , fundamentals , and Smart Money flows perfectly align to form a once-in-a-generation structure 🌎
Let’s break it down step-by-step 👇
Super Cycle Wave (1) — launched in the early 2000s, marking NVDA’s first growth phase during the birth of consumer GPUs 🎮.
Super Cycle Wave (2) — deep correction into 2002, retracing a 0.786 Fibonacci, cleansing early euphoria and creating the foundation for institutional accumulation 💼.
Then began the Super Cycle Wave (3) — the most powerful phase of all. Within it, we have distinct macro sub-waves:
1️⃣ Macro Wave (1) — ended in 2007 , aligning with the first institutional wave of adoption.
2️⃣ Macro Wave (2) — retraced 0.618 in 2008 , coinciding with the global financial crisis (perfect Smart Money shakeout).
3️⃣ Macro Wave (3) — the current dominant leg, fueled by exponential AI and data center growth . It’s extending toward the 3.618 Fibonacci extension (~$256) , confirming wave strength and institutional conviction.
4️⃣ Macro Wave (4) — expected between 2026–2027, likely retracing 0.236–0.382, a natural cooling period before the next breakout.
5️⃣ Macro Wave (5) — projected to rally toward 4.618 extension (~$2,500) , completing Super Cycle Wave (3) near 2029 🏁
From there, a larger Super Cycle Wave (4) correction could unfold before the final parabolic Super Cycle Wave (5) run to the 5.618 Fibonacci extension (~$26,000) — the climax of NVDA’s decades-long AI expansion super-trend 🌕
💰 Smart Money Concept (SMC) Perspective
The chart structure clearly shows Smart Money accumulation patterns in every correction phase:
Re-accumulation ranges appeared at every 0.618 retracement level 📊
Liquidity grabs below previous swing lows before strong impulsive moves ⚡
Fair Value Gaps (FVGs) filled during corrections, creating perfect liquidity imbalances that institutional players exploit
Currently, NVDA trades near a premium zone of Macro Wave (3), but Smart Money will likely reaccumulate during the upcoming Macro Wave (4) discount phase (2026–2027).
Expect Order Block re-tests and liquidity sweeps around discounted Fibonacci retracement zones (0.236–0.382) before the next major rally 📉➡️📈
📈 Price Action Structure
NVDA’s macro structure remains strongly bullish:
The multi-decade trend has respected every higher high and higher low sequence since 2008.
Each impulse is followed by a healthy re-accumulation range, never breaking long-term structure.
Expect distribution near the $250–$300 (split-adjusted) region as Wave (3) matures, followed by a macro correction that offers generational entries for long-term investors 🧠
🔢 Fibonacci Confluence & Technical Harmony
Fibonacci has been the invisible hand guiding NVDA’s growth 👇
0.786 retracement (2002) → deep liquidity reset
0.618 retracement (2008) → institutional re-entry
3.618 extension (256) → current macro resistance target
4.618 extension (2500) → Super Cycle Wave (3) final target
5.618 extension (26K) → ultimate Super Cycle Wave (5) projection
Each impulse and retracement aligns perfectly with Fibonacci’s geometric rhythm , proving the power of confluence between time, price, and sentiment.
🧠 Fundamentals — The Energy Behind the Waves
Behind the technicals lies unmatched fundamental growth :
💾 AI & Data Centers: NVIDIA is the core infrastructure for modern AI compute and cloud training workloads.
🧩 CUDA Ecosystem: A software moat that ties developers and enterprises directly to NVIDIA’s architecture.
🌐 Omniverse & Robotics: Positioning NVDA as a leader in 3D simulation, robotics, and digital twins — future trillion-dollar markets.
⚙️ Strategic Partnerships: Expanding across hyperscalers, automotives, and enterprise AI.
Each innovation wave fuels a new Elliott Wave impulse , with the AI revolution now driving the strongest macro leg in NVDA’s history.
⚡ Macro Outlook & Timeline
✅ Now (2025): Completing Macro Wave (3) of Super Cycle (3) → heading toward $256 target
⚠️ 2026–2027: Macro Wave (4) correction to 0.236–0.382 (Smart Money entry)
🚀 2028–2029: Macro Wave (5) push → Super Cycle (3) peak near $2,500
🌊 2030–2032: Super Cycle (4) correction — consolidation phase
💎 2035–2040+: Super Cycle (5) → ultimate 5.618 target near $26K
💬 Final Thoughts
"Every correction is a setup for the next expansion. Smart Money buys fear — not euphoria."
NVIDIA is the heartbeat of the AI revolution , the core of data-driven computing , and a living Fibonacci sequence in motion.
As long as fundamentals stay aligned with the wave rhythm, NVDA’s Supercycle will continue to redefine what’s possible in long-term growth. 🌌
#NVDA #ElliottWaveAnalysis #SmartMoneyConcept #PriceActionTrading #FibonacciMagic #AIRevolution #StockMarket #Investing #TradingViewCommunity #TechSupercycle #NVDAtoTheMoon #LongTermInvesting
💬 Traders, analysts, and wave watchers — your insights matter!
Have you spotted NVDA’s next move? Drop your Elliott Wave counts, confirmations, or constructive critiques below 👇 Let’s discuss NVIDIA’s structural evolution, AI-driven Supercycle, and long-term growth potential together 🚀💚
Every comment adds perspective — let’s decode this massive wave as a community! 🌊📈
— Team FIBCOS ⚡💎


I'm betting for a big pullback in NVDANVDA is still strong in the broader sense, but the shorter-term internal strength (momentum, volume) is waning. If it busts above ~$190-195 with volume, it could resume big.
If it doesn’t, beware the risk of a pullback or consolidation.
Choose your option path accordingly.
NVDA is still strong in the broader sense, but the shorter-term internal strength (momentum, volume) is waning. If it busts above ~$190-195 with volume, it could resume big.
If it doesn’t, beware the risk of a pullback or consolidation. Choose your option path accordingly.
