VMI +25%There were a strong impulse movement and over 1 year consolidation. Now it's ready to continue main movement
VI1 trade ideas


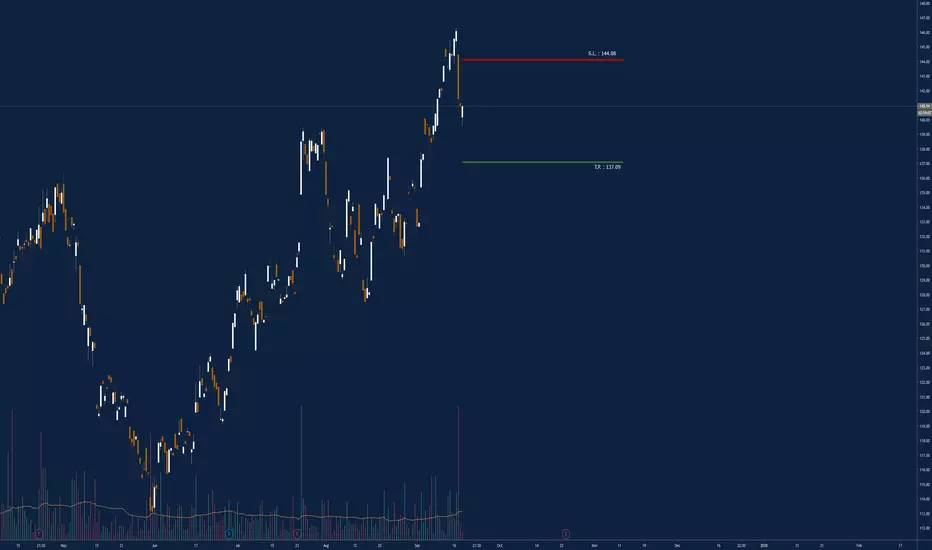
VMI: Sort opportunityAn intraday high potential, Back Tested Sort Analysis.
We ll try to enter into the correction of the uptrend movement.
DETAILS ON THE CHART
NOTE: Entry range area above the entry point, is calculated upon 80% of the recorded pullback back tested past performances
DISCLAIMER: This is a technical analysis study, not an advice or recommendation to invest money on.
Valmont Announces $250 Million Share Repurchase ReauthorizationVMI: Valmont Industries, Inc.
2018-10-31 08:30:00
Valmont Announces $250 Million Share Repurchase Reauthorization

Dow drops once again #23 (VMI)Technical Concept: Support broken becomes Resistance (Red Arrows= Resistance) (Blue Arrows= Support)
I not use sophisticated Technical jargon in an attempt to persuade and impress the reader because I not a Charlatan
I do not use fancy Charts plenty of Indicators, Oscillators, and other stuff, all in a stock chart in an attempt to impress
the reader with my knowledge because I not a Tutor or Mentor.
I am not either a Business man, Engineer, Doctor, Inventor or Innovator; this requires different skills and personalities
Who I am? What I do? And what I can do for you?
I am End of Day Analyst and Stock Picker, I support myself in Charts, but I not self-proclaimed Technical Analyst Expert
I do not fall into the mistake of comparing and affirm that Technical Analysis is better than Fundamental Analysis .
I am a person without Higher education, and not have math skills.
I am a right brain oriented person and I focus in my strengths, for this reason I use Charts and I no try to become a Quantitative Trader, since it is a lost cause, in my case.
I use a simple method based in Support and Resistance , accompanied with moving averages, and I do a Top down Analysis with multiple time frames
My first view of a Stock is a 10 year Weekly Chart, Then I do a zoom in and I focus in the action of the last 2 or 4 Years, I look my Daily Chart and 4-Hrs Chart too
I pick Stocks manually I watch one by one without the use of a Stock Screener
I follow approximately 1300 to 1400 Stocks , distributed in 10 industries, with different market cap
I do not follow Penny Stocks and Over-The-Counter stocks
I not follow Stocks with an Avg_Volume bellow 100,000 with (Low Liquidity)
I dedicated 10 lonely years of deliberate practice and in this process, I eliminated all kind of thoughts.
I open and reset a lot of Demo Accounts for this purpose
I tried and practice with different Markets (Forex, Options and Stocks) with different Time Frames (Intraday, Scalping, Swing/Position).
I tried Mechanical Trading too, But definitely I am Discretionary Analyst or Qualitative, It took me years to know it, and a lot of books.
I've learned by myself, but I do not think I'm smarter than the others, “Ego is a sin”
I understand the concept of Short Selling and spend hours searching this kind of patterns including the weekends.
What I can do for you?
I can put ideas in the desk of Professional Traders, the ideas are based in Price Patterns + Price Action,
and they can trade with your own system or set up
My ideas are not influenced by the media or my neighbors,
I have no preference for a particular industry I follow 10 Industries even Public Utilities
I only focus in Price Patterns + Price Action
This was my Resume and Cover letter
Sincerely
Alex_Quiroga

