Predicción SCYR 17-01-2022Predicción para SCYR en largo. Recomendada por nuestro algoritmo de IA. El horizonte temporal de la recomendación es 5 días.
Sacyr SA
No trades
0.15 USD
117.37 M USD
4.73 B USD
501.96 M
About Sacyr SA
Sector
Industry
CEO
Pedro Antonio Sigüenza Hernández
Website
Headquarters
Madrid
Founded
1921
IPO date
Nov 4, 1993
Identifiers
2
ISIN ES0182870214
Sacyr SA engages in building and developing real estate properties. It operates through the following business segments: Construction, Concessions, Services, and Other. The Construction segment is involved in the civil engineering and building, engineering and construction and maintenance of complex industrial and oil and gas facilities in Spain, Italy, Chile, Colombia, Peru, Mexico, Portugal, the United Kingdom, Uruguay, Brazil, and the United States. The Concessions segment focuses on the motorway, transport hub, airport and hospital concessions business. The Services segment consists of waste processing, construction, maintenance, and conservation of industrial facilities related to the environment. The Other segment refers to the other companies, which are not included in the previous segments. The company was founded by José Manuel Loureda Mantiñán on July 5, 1921 and is headquartered in Madrid, Spain.
Related stocks

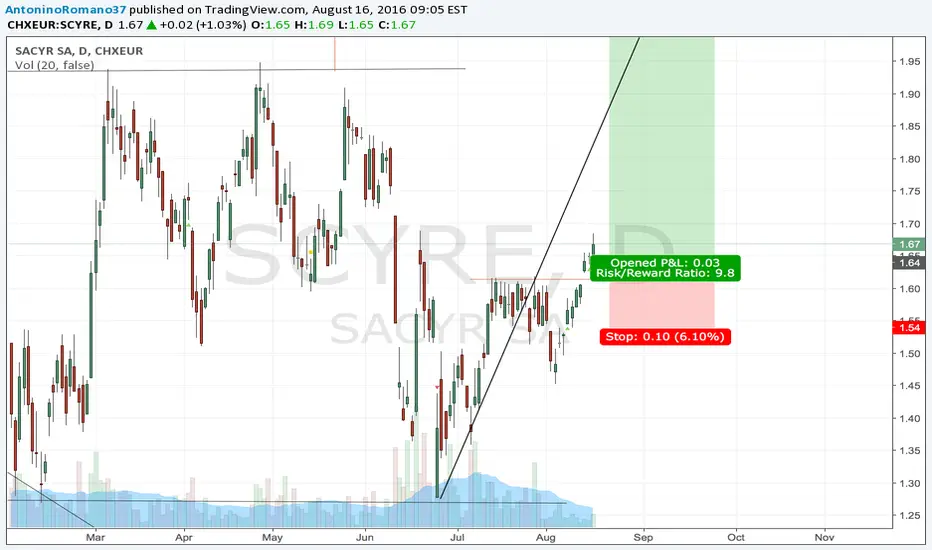
SACYR in front of major resistance/ en resistencia historicaSacyr closed on friday really close to historical resistance after a rally that started in 1.40s for almost 50% upside. With christmas approaching to markets and everything going up it wouldn't be suprise the typical december retrace taking this one 2 fib levels down to 1.69 before seriously trying

SACYR: Shaping H&S after inverse one outcome got kicked outWe are always listening to "Sacyr wins this concession in Chile", "Sacyr wins this construction in ____", "Sacyr enters bid to build a hospital in Lisbon"... But what if there are overcosts or a new confinement? Nowadays, the company is unprofitable. In 2019, it lost €297 million and historically Sa


SACYR trianglePosible new cycle, develop of 4th wave on triangular form. Follow a buy signal above 2€.
Not quite happy with a-4 overlaping 1st wave, but let's trust a 0.02€ margin error.


SACYRI just closed the long trade. I will reopen if the price falls to 1.80 or if it moves past 1.95

SACYRSacyr has moved past the 200D MA and it keeps above the Ichimoku cloud. I am maintaining my long position

SACYRThe 200D MA has stopped the Price which has been moving within a rising cannel. I have a long position according to the trading plan shown on chart.

SACYRSo far so good. The price has been going in the right direction as far as the long strategy I opened a few days ago.
See all ideas
Summarizing what the indicators are suggesting.
Neutral
SellBuy
Strong sellStrong buy
Strong sellSellNeutralBuyStrong buy
Neutral
SellBuy
Strong sellStrong buy
Strong sellSellNeutralBuyStrong buy
Neutral
SellBuy
Strong sellStrong buy
Strong sellSellNeutralBuyStrong buy
An aggregate view of professional's ratings.
Neutral
SellBuy
Strong sellStrong buy
Strong sellSellNeutralBuyStrong buy
Neutral
SellBuy
Strong sellStrong buy
Strong sellSellNeutralBuyStrong buy
Neutral
SellBuy
Strong sellStrong buy
Strong sellSellNeutralBuyStrong buy
Displays a symbol's price movements over previous years to identify recurring trends.
XS307133784
Sacyr S.A. 4.75% 29-MAY-2030Yield to maturity
3.94%
Maturity date
May 29, 2030
XS2597671051
Sacyr S.A. 6.3% 23-MAR-2026Yield to maturity
3.65%
Maturity date
Mar 23, 2026
See all SYRVF bonds
Frequently Asked Questions
The current price of SYRVF is 3.00 USD — it has increased by 10.29% in the past 24 hours. Watch Sacyr SA stock price performance more closely on the chart.
Depending on the exchange, the stock ticker may vary. For instance, on OTC exchange Sacyr SA stocks are traded under the ticker SYRVF.
We've gathered analysts' opinions on Sacyr SA future price: according to them, SYRVF price has a max estimate of 6.05 USD and a min estimate of 4.63 USD. Watch SYRVF chart and read a more detailed Sacyr SA stock forecast: see what analysts think of Sacyr SA and suggest that you do with its stocks.
SYRVF reached its all-time high on Jan 18, 2008 with the price of 36.90 USD, and its all-time low was 1.47 USD and was reached on May 15, 2012. View more price dynamics on SYRVF chart.
See other stocks reaching their highest and lowest prices.
See other stocks reaching their highest and lowest prices.
SYRVF stock is 9.33% volatile and has beta coefficient of 1.16. Track Sacyr SA stock price on the chart and check out the list of the most volatile stocks — is Sacyr SA there?
Today Sacyr SA has the market capitalization of 4.18 B, it has increased by 5.62% over the last week.
Yes, you can track Sacyr SA financials in yearly and quarterly reports right on TradingView.
SYRVF net income for the last quarter is 37.24 M USD, while the quarter before that showed 4.41 M USD of net income which accounts for 744.77% change. Track more Sacyr SA financial stats to get the full picture.
Sacyr SA dividend yield was 3.13% in 2024, and payout ratio reached 64.57%. The year before the numbers were 3.65% and 48.66% correspondingly. See high-dividend stocks and find more opportunities for your portfolio.
As of Feb 14, 2026, the company has 15.12 K employees. See our rating of the largest employees — is Sacyr SA on this list?
EBITDA measures a company's operating performance, its growth signifies an improvement in the efficiency of a company. Sacyr SA EBITDA is 1.49 B USD, and current EBITDA margin is 30.13%. See more stats in Sacyr SA financial statements.
Like other stocks, SYRVF shares are traded on stock exchanges, e.g. Nasdaq, Nyse, Euronext, and the easiest way to buy them is through an online stock broker. To do this, you need to open an account and follow a broker's procedures, then start trading. You can trade Sacyr SA stock right from TradingView charts — choose your broker and connect to your account.
Investing in stocks requires a comprehensive research: you should carefully study all the available data, e.g. company's financials, related news, and its technical analysis. So Sacyr SA technincal analysis shows the buy rating today, and its 1 week rating is buy. Since market conditions are prone to changes, it's worth looking a bit further into the future — according to the 1 month rating Sacyr SA stock shows the buy signal. See more of Sacyr SA technicals for a more comprehensive analysis.
If you're still not sure, try looking for inspiration in our curated watchlists.
If you're still not sure, try looking for inspiration in our curated watchlists.